
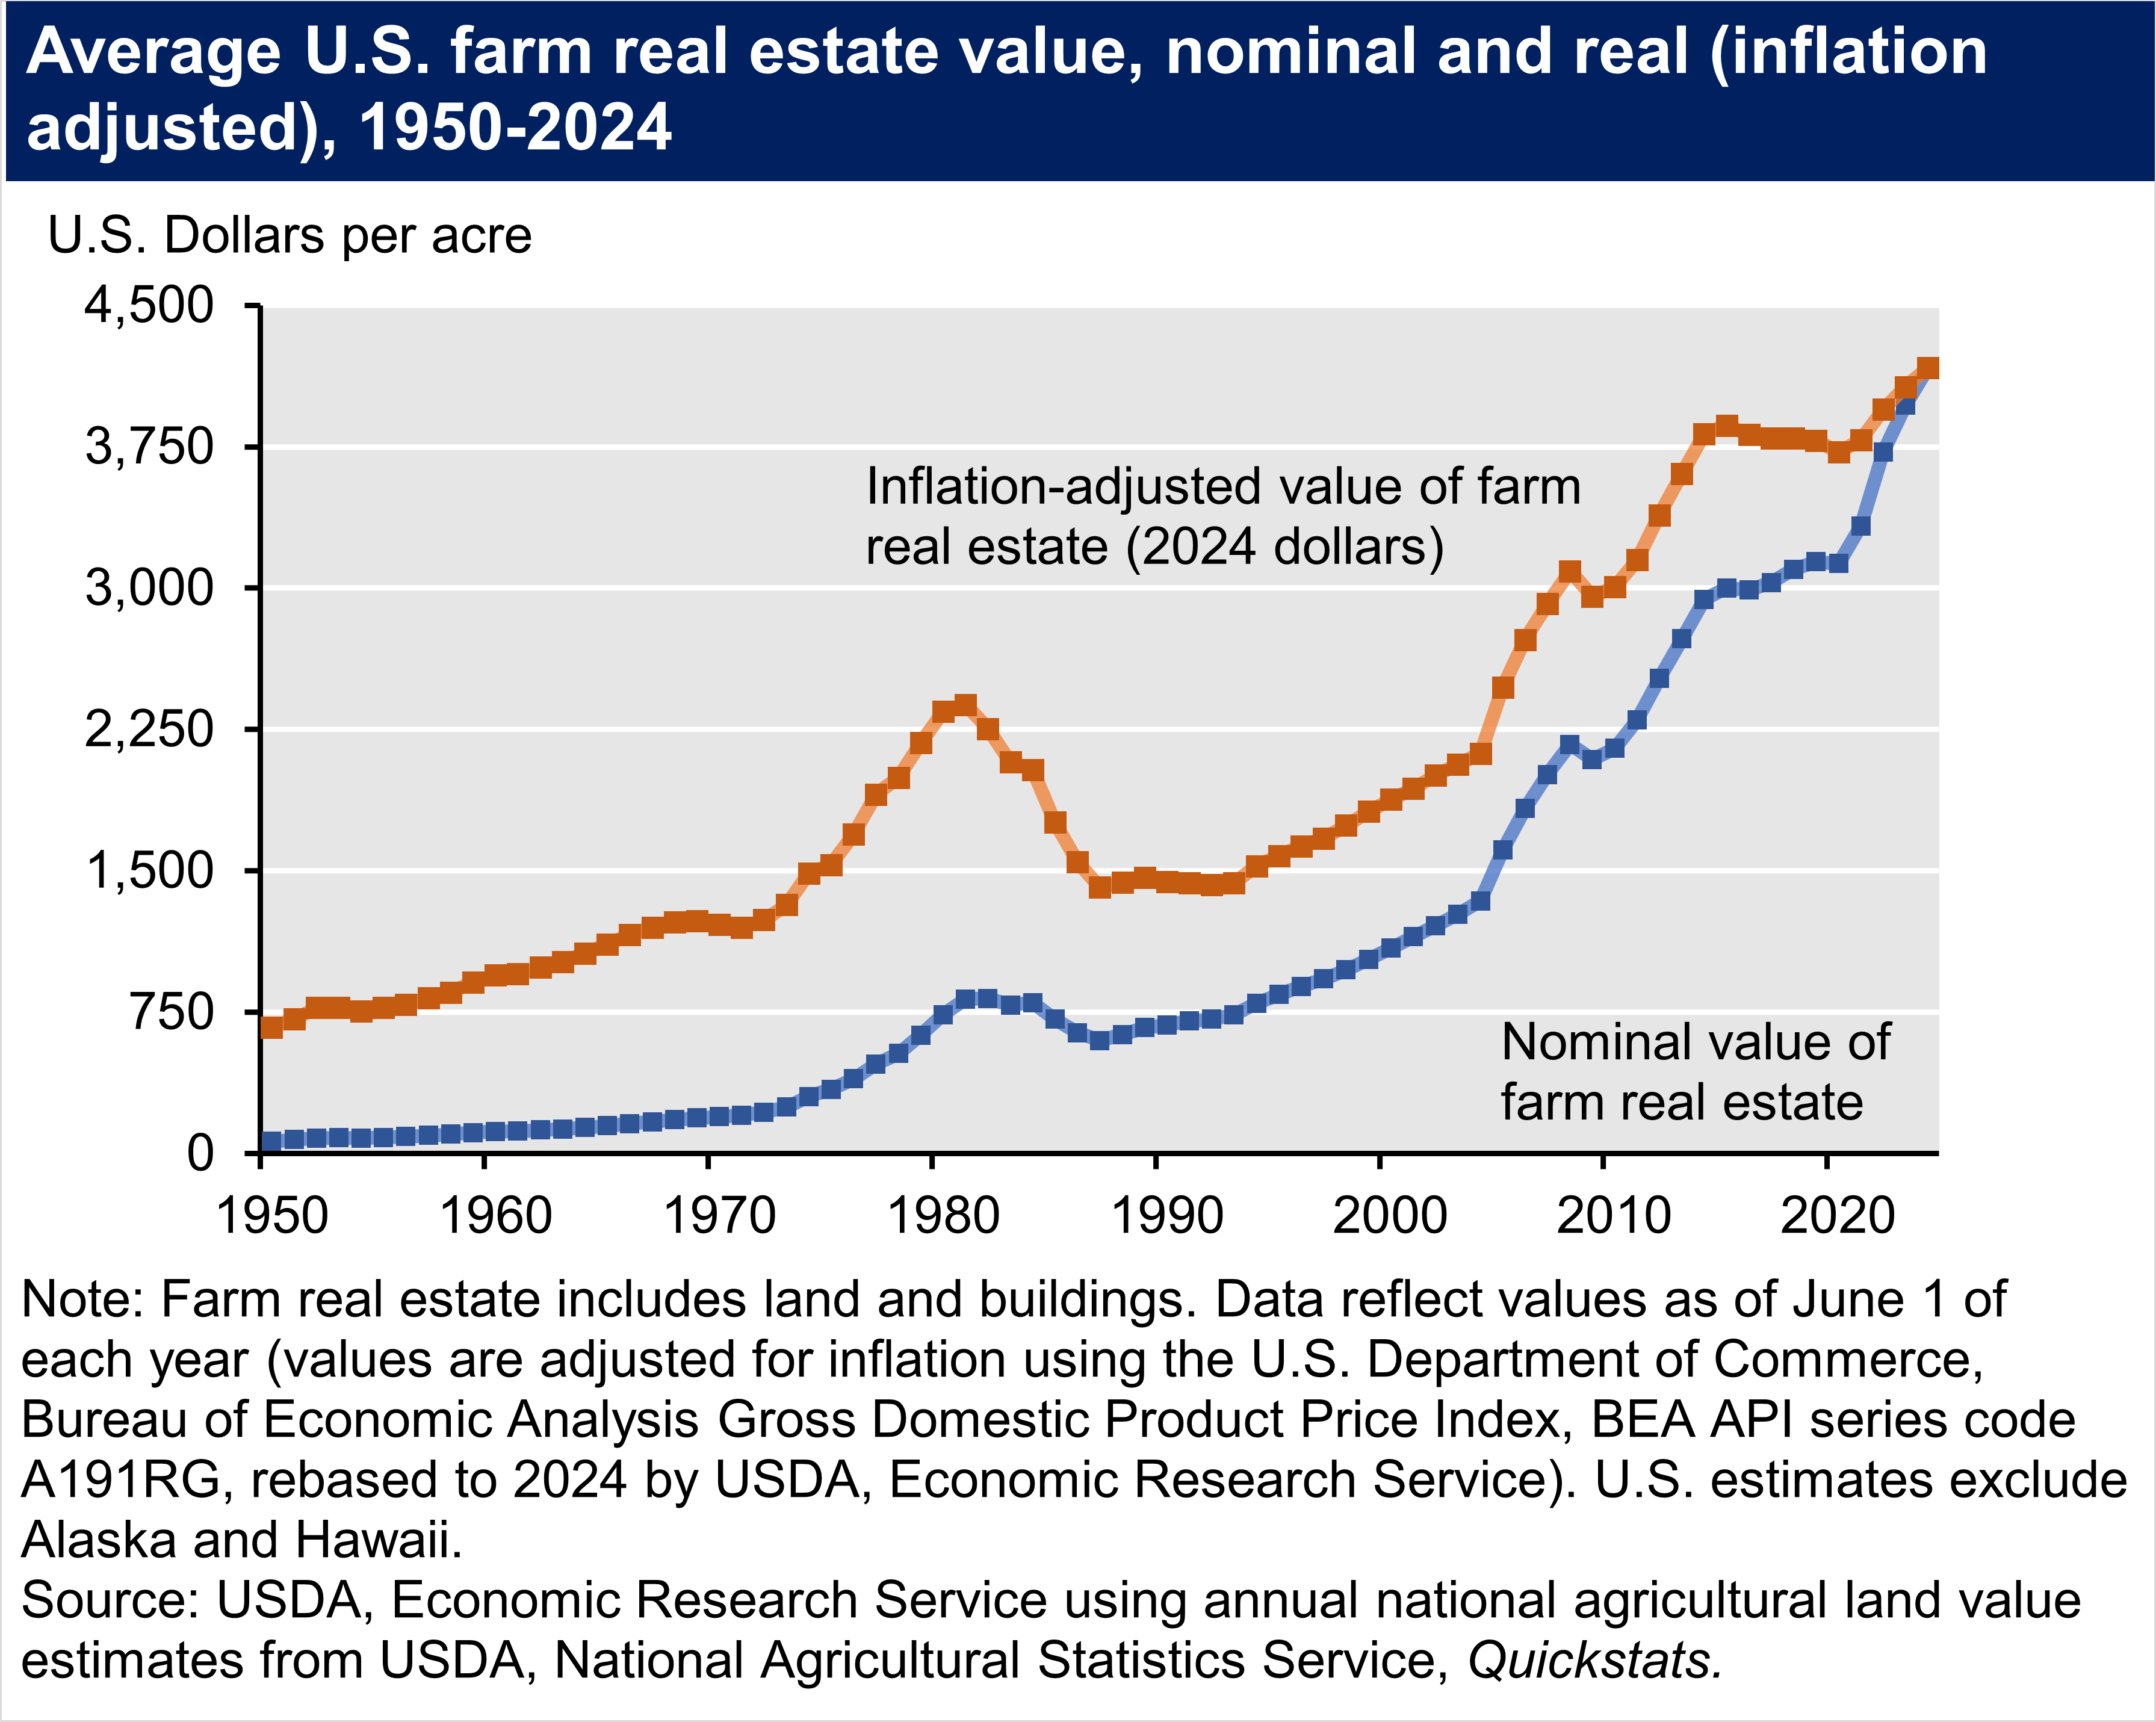
Farm real estate (land and structures) accounted for a forecasted 3.52 trillion dollars (83.5 percent) of the total value of U.S. farm assets in 2024. (see more on farm assets and debt, including real estate.) Following a period of stabilization in farmland values from 2014 to 2020, farmland values began to appreciate in 2021, even after adjusting for inflation. The trend has continued into 2024. The value of U.S. farmland averaged $4,170 per acre, an increase of 5.0 percent over 2023 values, or 2.5 percent when adjusted for inflation. Over the previous 5-year period (2018 to 2023), the compound annualized growth rate (CAGR) was 5.1 percent, or 1.4 percent after adjusting for inflation.
The USDA, Economic Research Service studies trends in farmland values, assessing the impact of both macroeconomic factors (such as interest rates and the prices of alternative investments) and parcel specific attributes (such as soil quality, government payments, rural amenity value and urban proximity). Regional farmland real estate values vary widely because of differences in general economic conditions, local farm economic conditions, and local geographic conditions that affect returns to farming. For example, in the Corn Belt, farm real estate values are nearly twice the national average, while farmland real estate values in the Mountain region are less than half the national average.
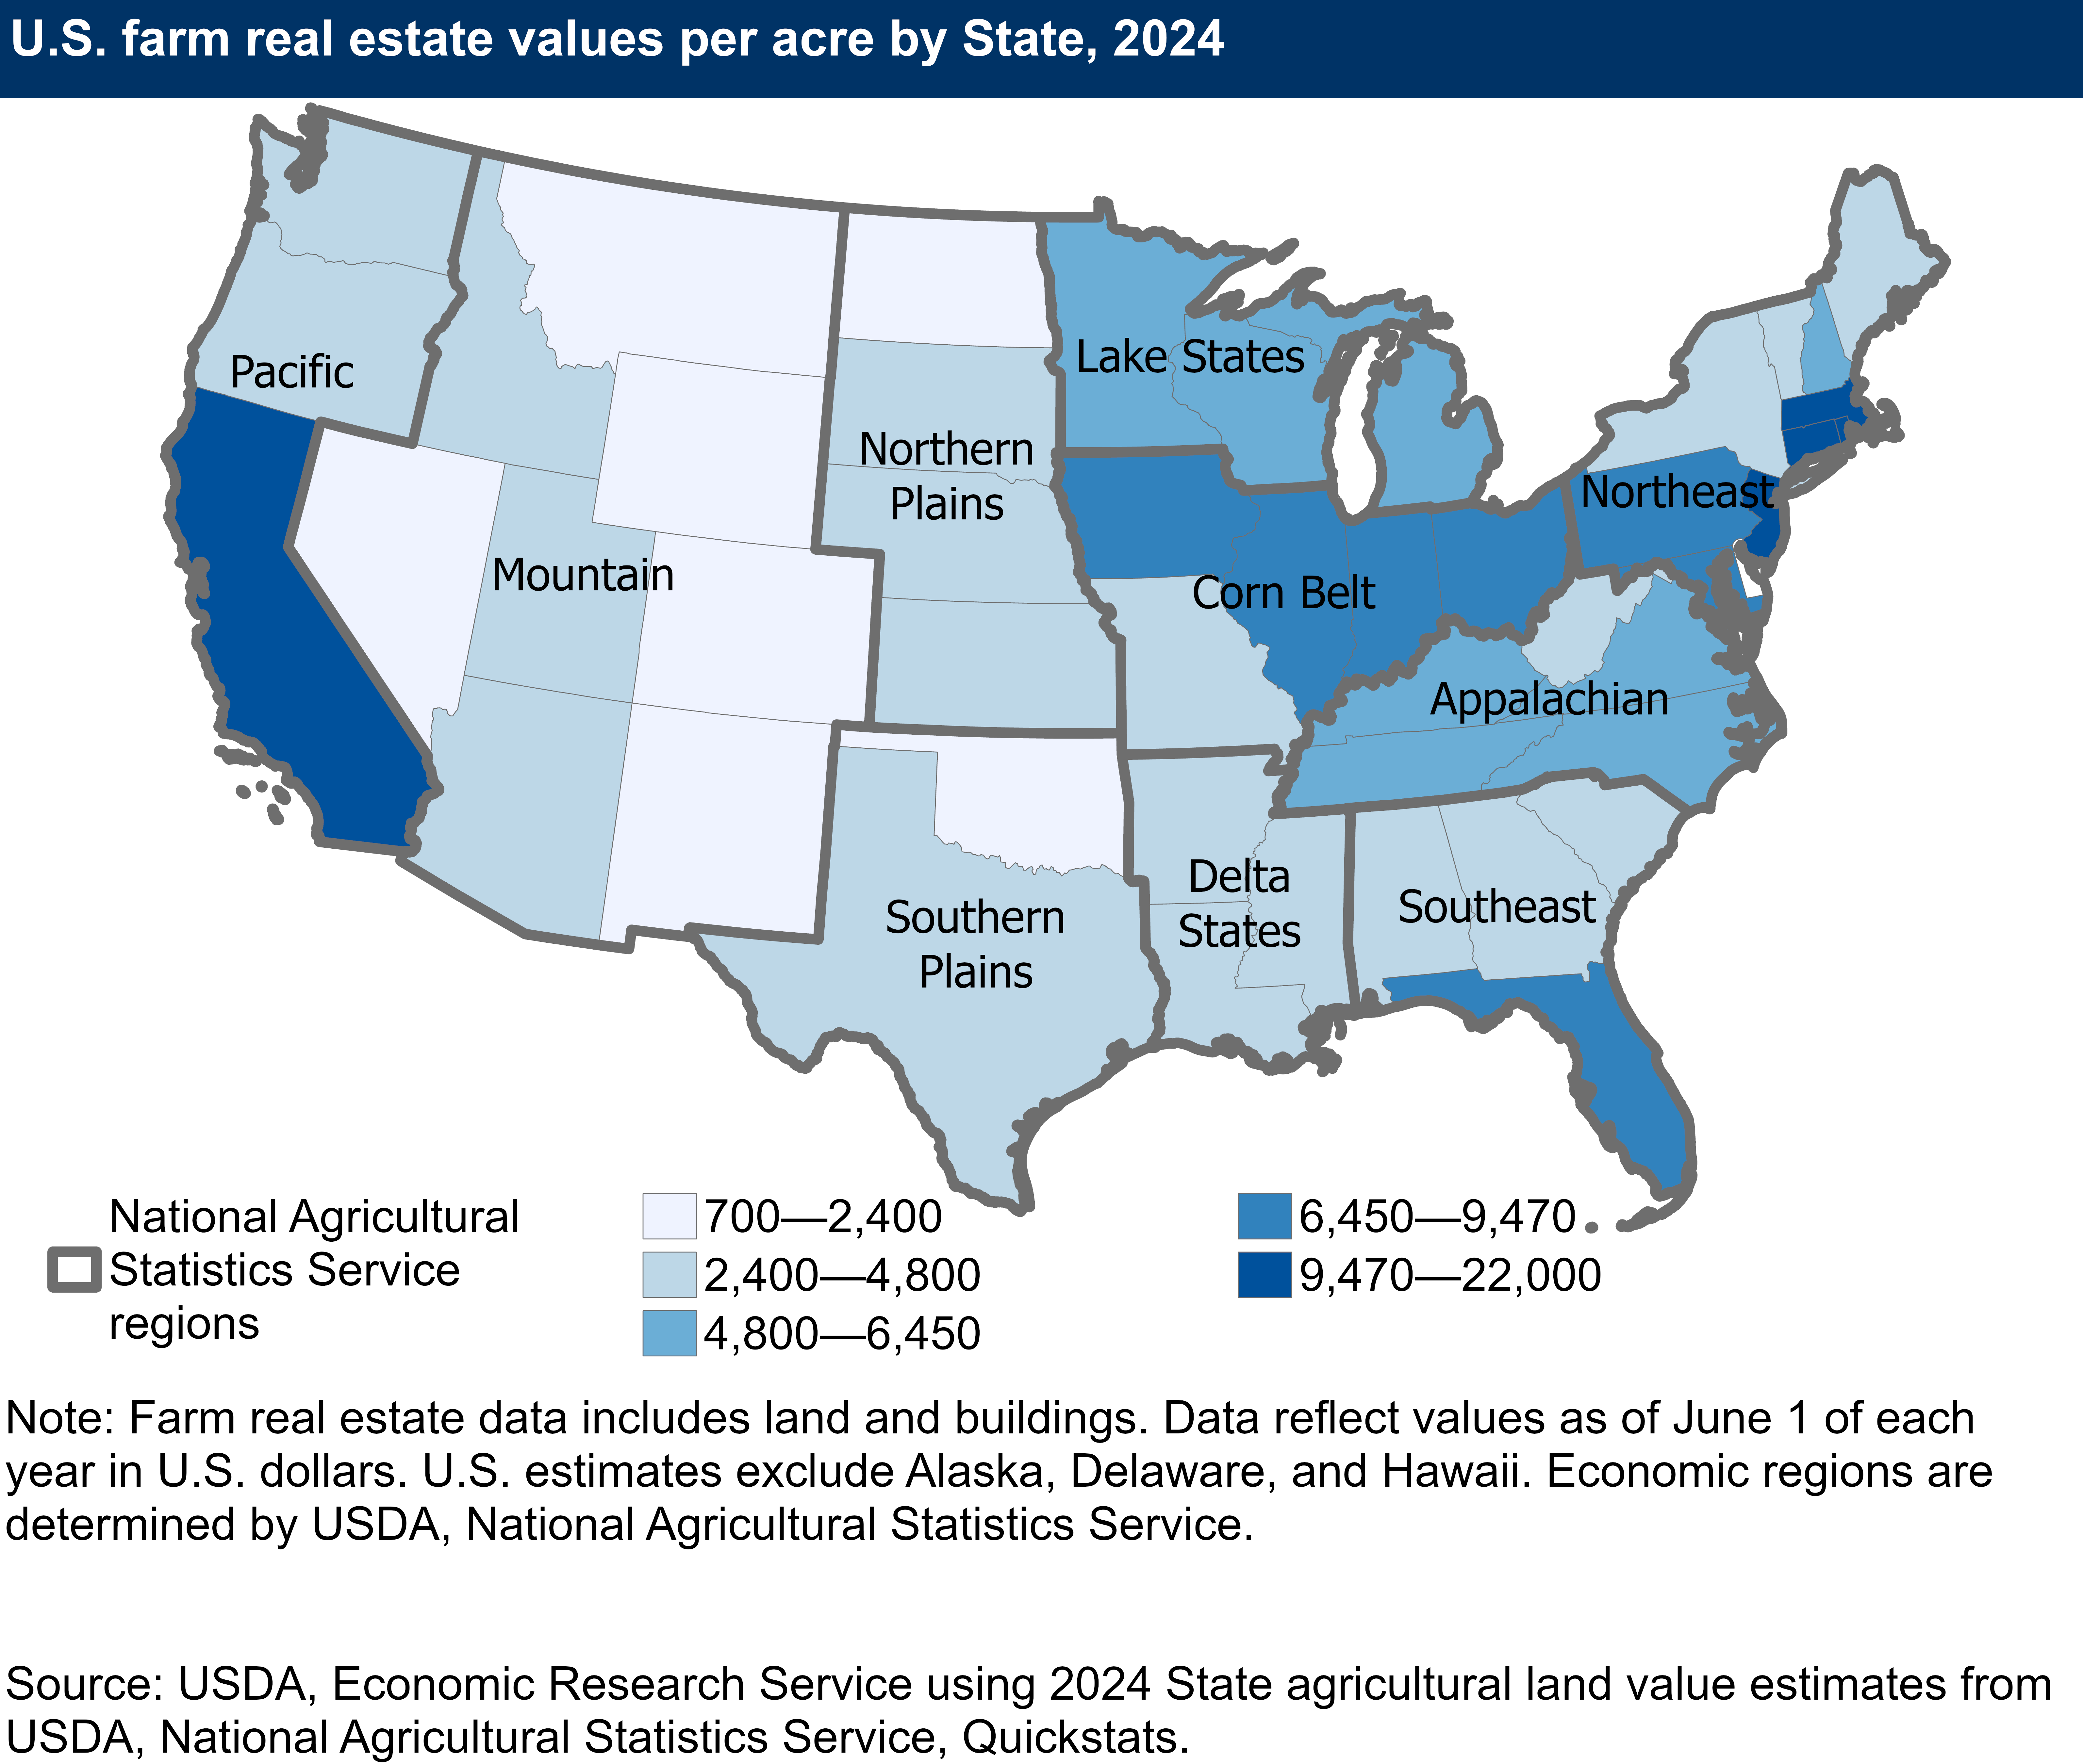
In addition to differences in the value of land, farm real estate growth varies by region. While farm real estate values increased in all economic regions between 2023 and 2024 (after adjusting for inflation), real growth ranged from a zero percent change in the Pacific region to a 6.8 percent increase in the Southeast. Over the previous 5-year period (2018 to 2023), the average annual growth rate was highest in the Pacific region (3.2 percent) and rose the least in the Appalachian region (0.3 percent).
Farm real estate values also vary according to agricultural use. Cropland maintains a premium over pastureland, due to higher per-acre returns. Between 2023 and 2024, inflation-adjusted U.S. average cropland values increased by 2.2 percent to $5,570 per acre, compared to 1.9 percent per year over the previous 5 years (2018 to 2023). Meanwhile average pastureland values increased by 2.7 percent to $1,830 per acre, compared to 1.2 percent per year over the previous 5 years (all values are adjusted for inflation). The difference between cropland and pastureland values also varies by region. Cropland values are higher than pastureland values in every region. In the Pacific region, the average cropland value per acre ($9,520) was more than four times higher than the average pastureland value per acre ($2,370) in 2024.
Another measure of value is the annual rental cost of using land for agricultural production. Between 2023 and 2024, average inflation-adjusted U.S. cropland rental rates increased by 0.8 percent to $160, while pastureland rental rates increased by 0.9 percent to $15.5 per acre.
| Economic Region | Farm real estate value | Cropland value | Cropland rent | Pasture value | Pasture rent |
|---|---|---|---|---|---|
|
Pacific |
8,040 |
9,520 |
271 |
2,370 |
13 |
|
Corn Belt |
7,930 |
8,560 |
242 |
3,000 |
45 |
|
Northeast |
7,070 |
7,690 |
102 |
4,670 |
38 |
|
Lake States |
6,330 |
6,470 |
182 |
2,560 |
35 |
|
Southeast |
5,490 |
5,640 |
106 |
5,510 |
22.5 |
|
Appalachian |
5,320 |
5,660 |
117 |
4,500 |
25.5 |
|
Delta States |
3,810 |
3,650 |
129 |
3,250 |
21.5 |
|
Northern Plains |
3,050 |
4,040 |
119 |
1,450 |
26.5 |
|
Southern Plains |
2,720 |
2,500 |
43.5 |
2,160 |
9.7 |
|
Mountain |
1,600 |
2,700 |
104 |
909 |
6.6 |
|
United States (48 States) |
4,170 |
5,570 |
160 |
1,830 |
15.5 |
| Source: Land Values, 2024 Summary, USDA, National Agricultural Statistics Service, August 2024. Annual data by region and State are available from QuickStats. | |||||