Meal preparation time varies across different U.S. demographic groups
- by Karen Hamrick
- 1/12/2017

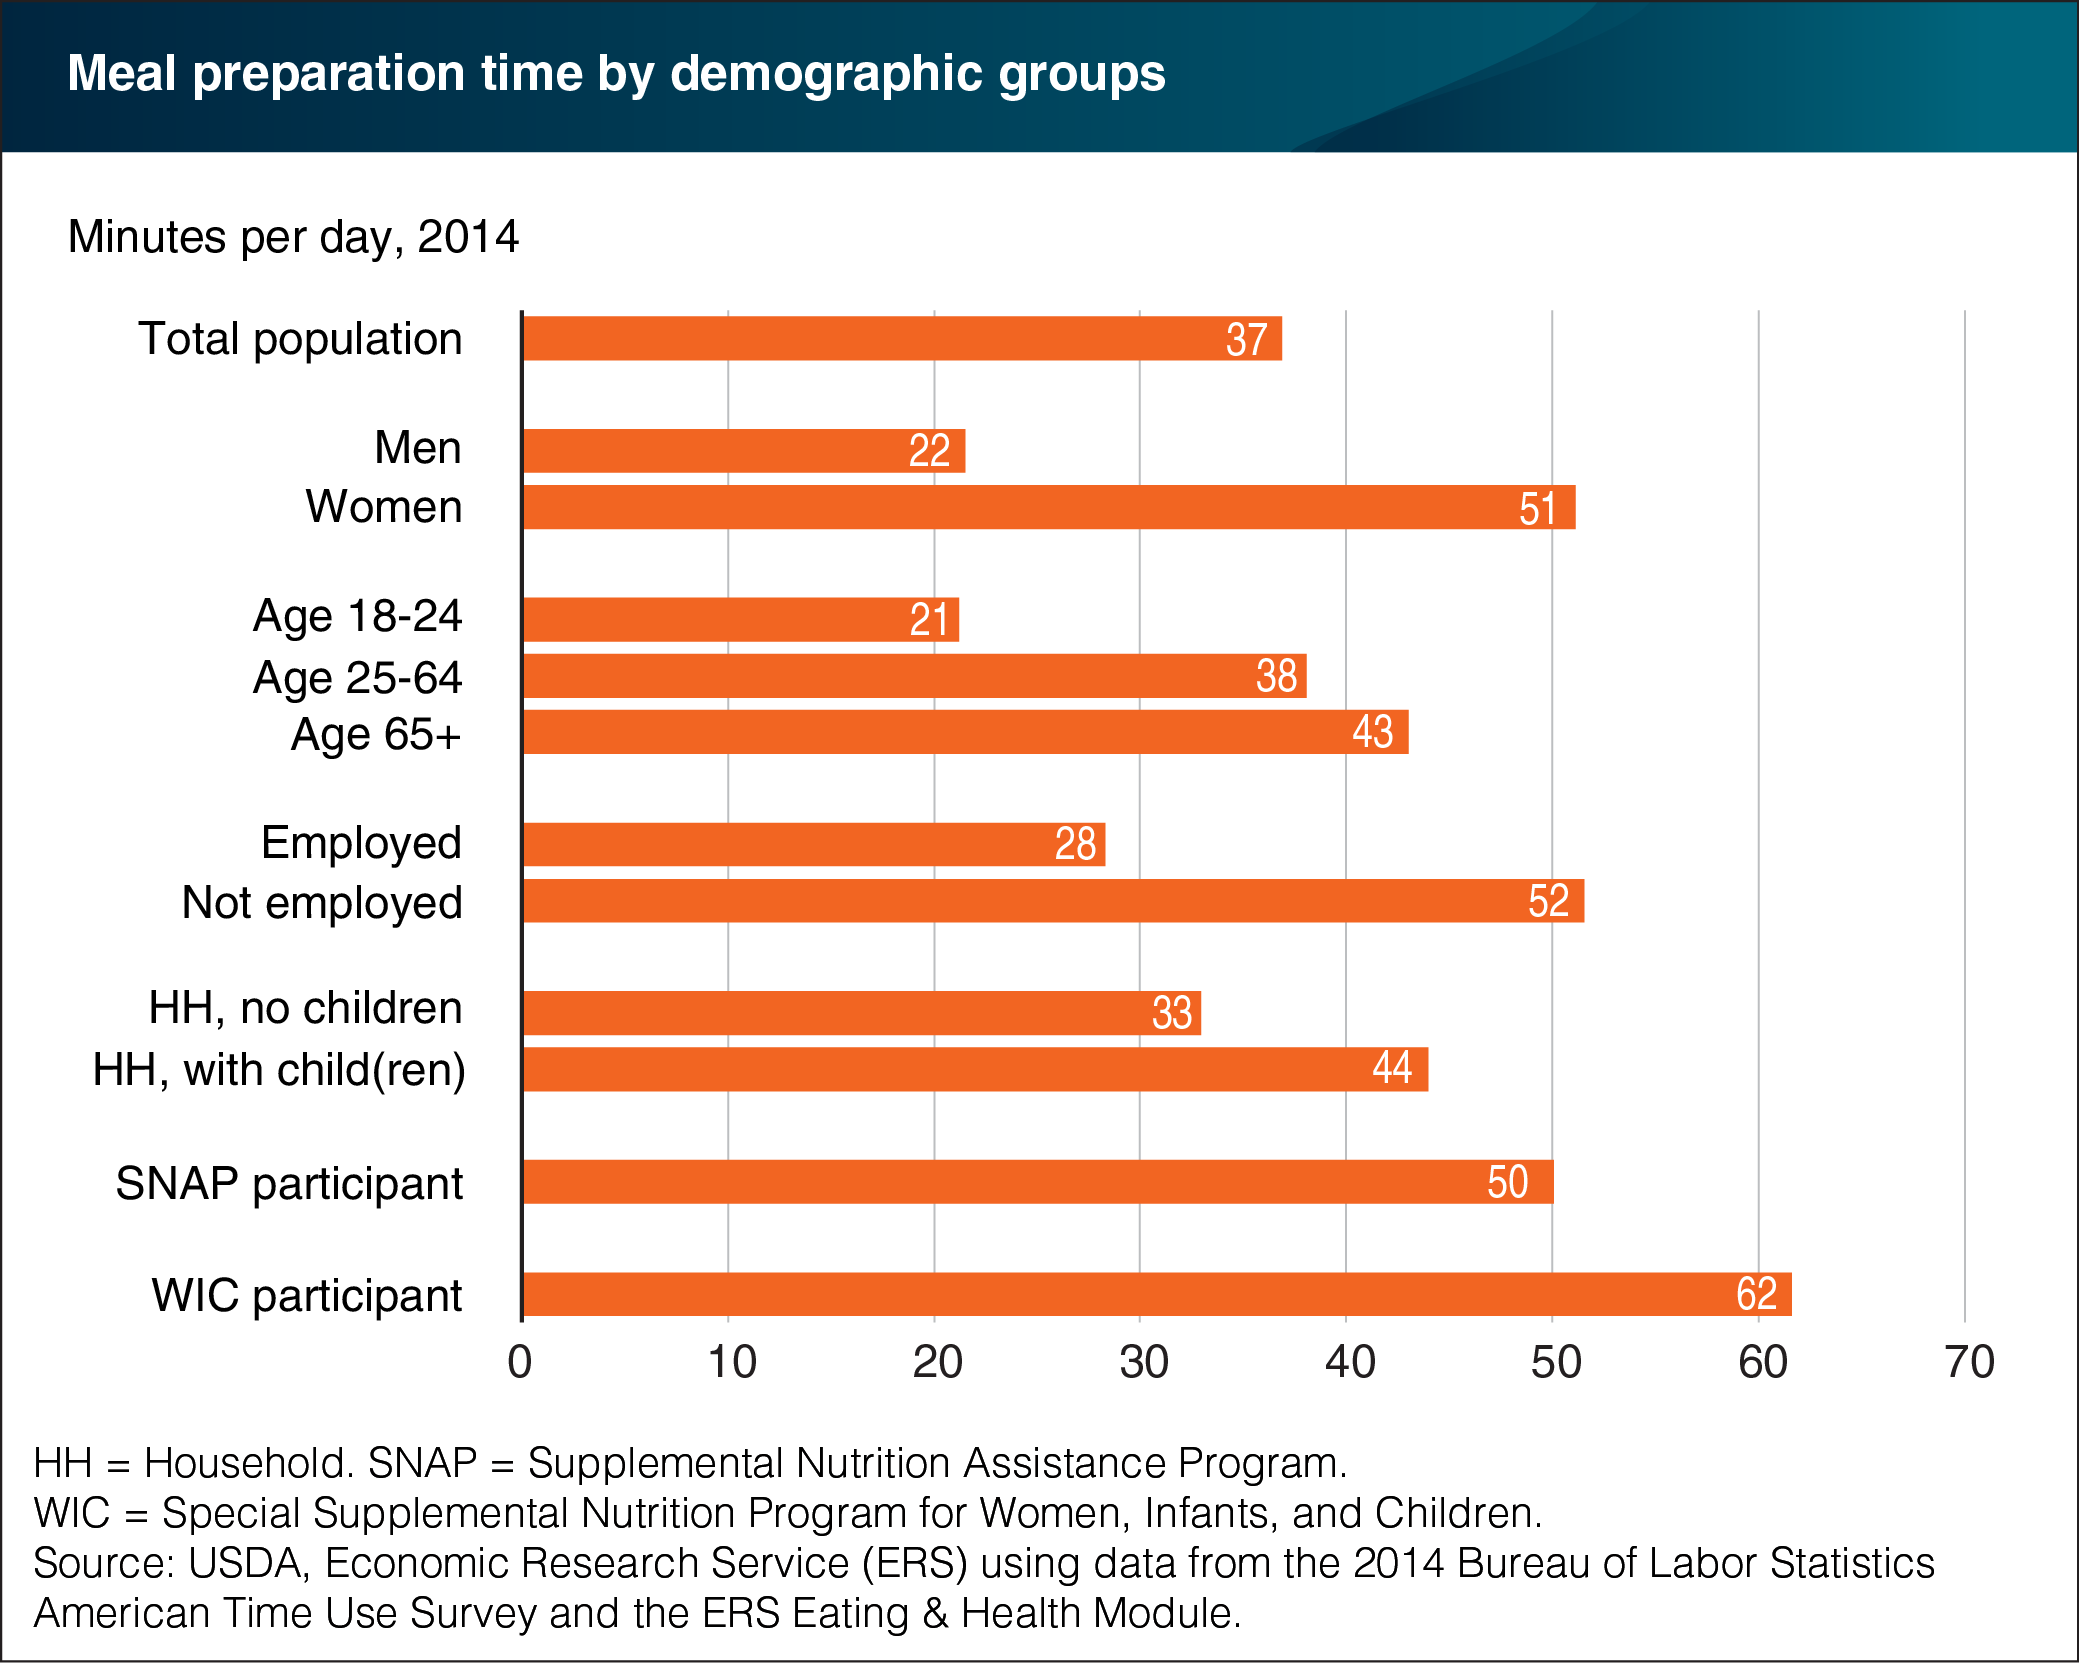
On an average day in 2014, Americans age 18 and over spent 37 minutes in food preparation and cleanup. However, the average time spent in “meal prep”—defined as preparing food and beverages, serving them, and cleaning up afterwards—varied considerably among different groups. Men spent an average of 22 minutes, whereas women spent an average of 51 minutes. Younger adults (age 18-24) spent an average of 21 minutes, while working-age adults (age 25-64) spent 38 minutes. Those age 65 or older spent an average of 43 minutes. Employed individuals spent less time in meal prep than those not employed, and those in households without children spent less time than those in households with children. Participants in USDA’s Special Supplemental Nutrition Program for Women, Infants, and Children (WIC) had the longest average duration in meal prep time—62 minutes. Time spent preparing infant formula, breastfeeding, and pumping breast milk is included in meal prep time in the American Time Use Survey (ATUS). These time use data are from the ERS-developed 2014 Eating & Health Module—a supplement to the Bureau of Labor Statistics’ ATUS. This chart appears in “Americans Spend an Average of 37 Minutes a Day Preparing and Serving Food and Cleaning Up” in ERS’s November 2016 Amber Waves magazine.

