Rural Residents Appear to be More Vulnerable to Serious Infection or Death From Coronavirus COVID-19
- by Elizabeth A. Dobis and David McGranahan
- 2/1/2021
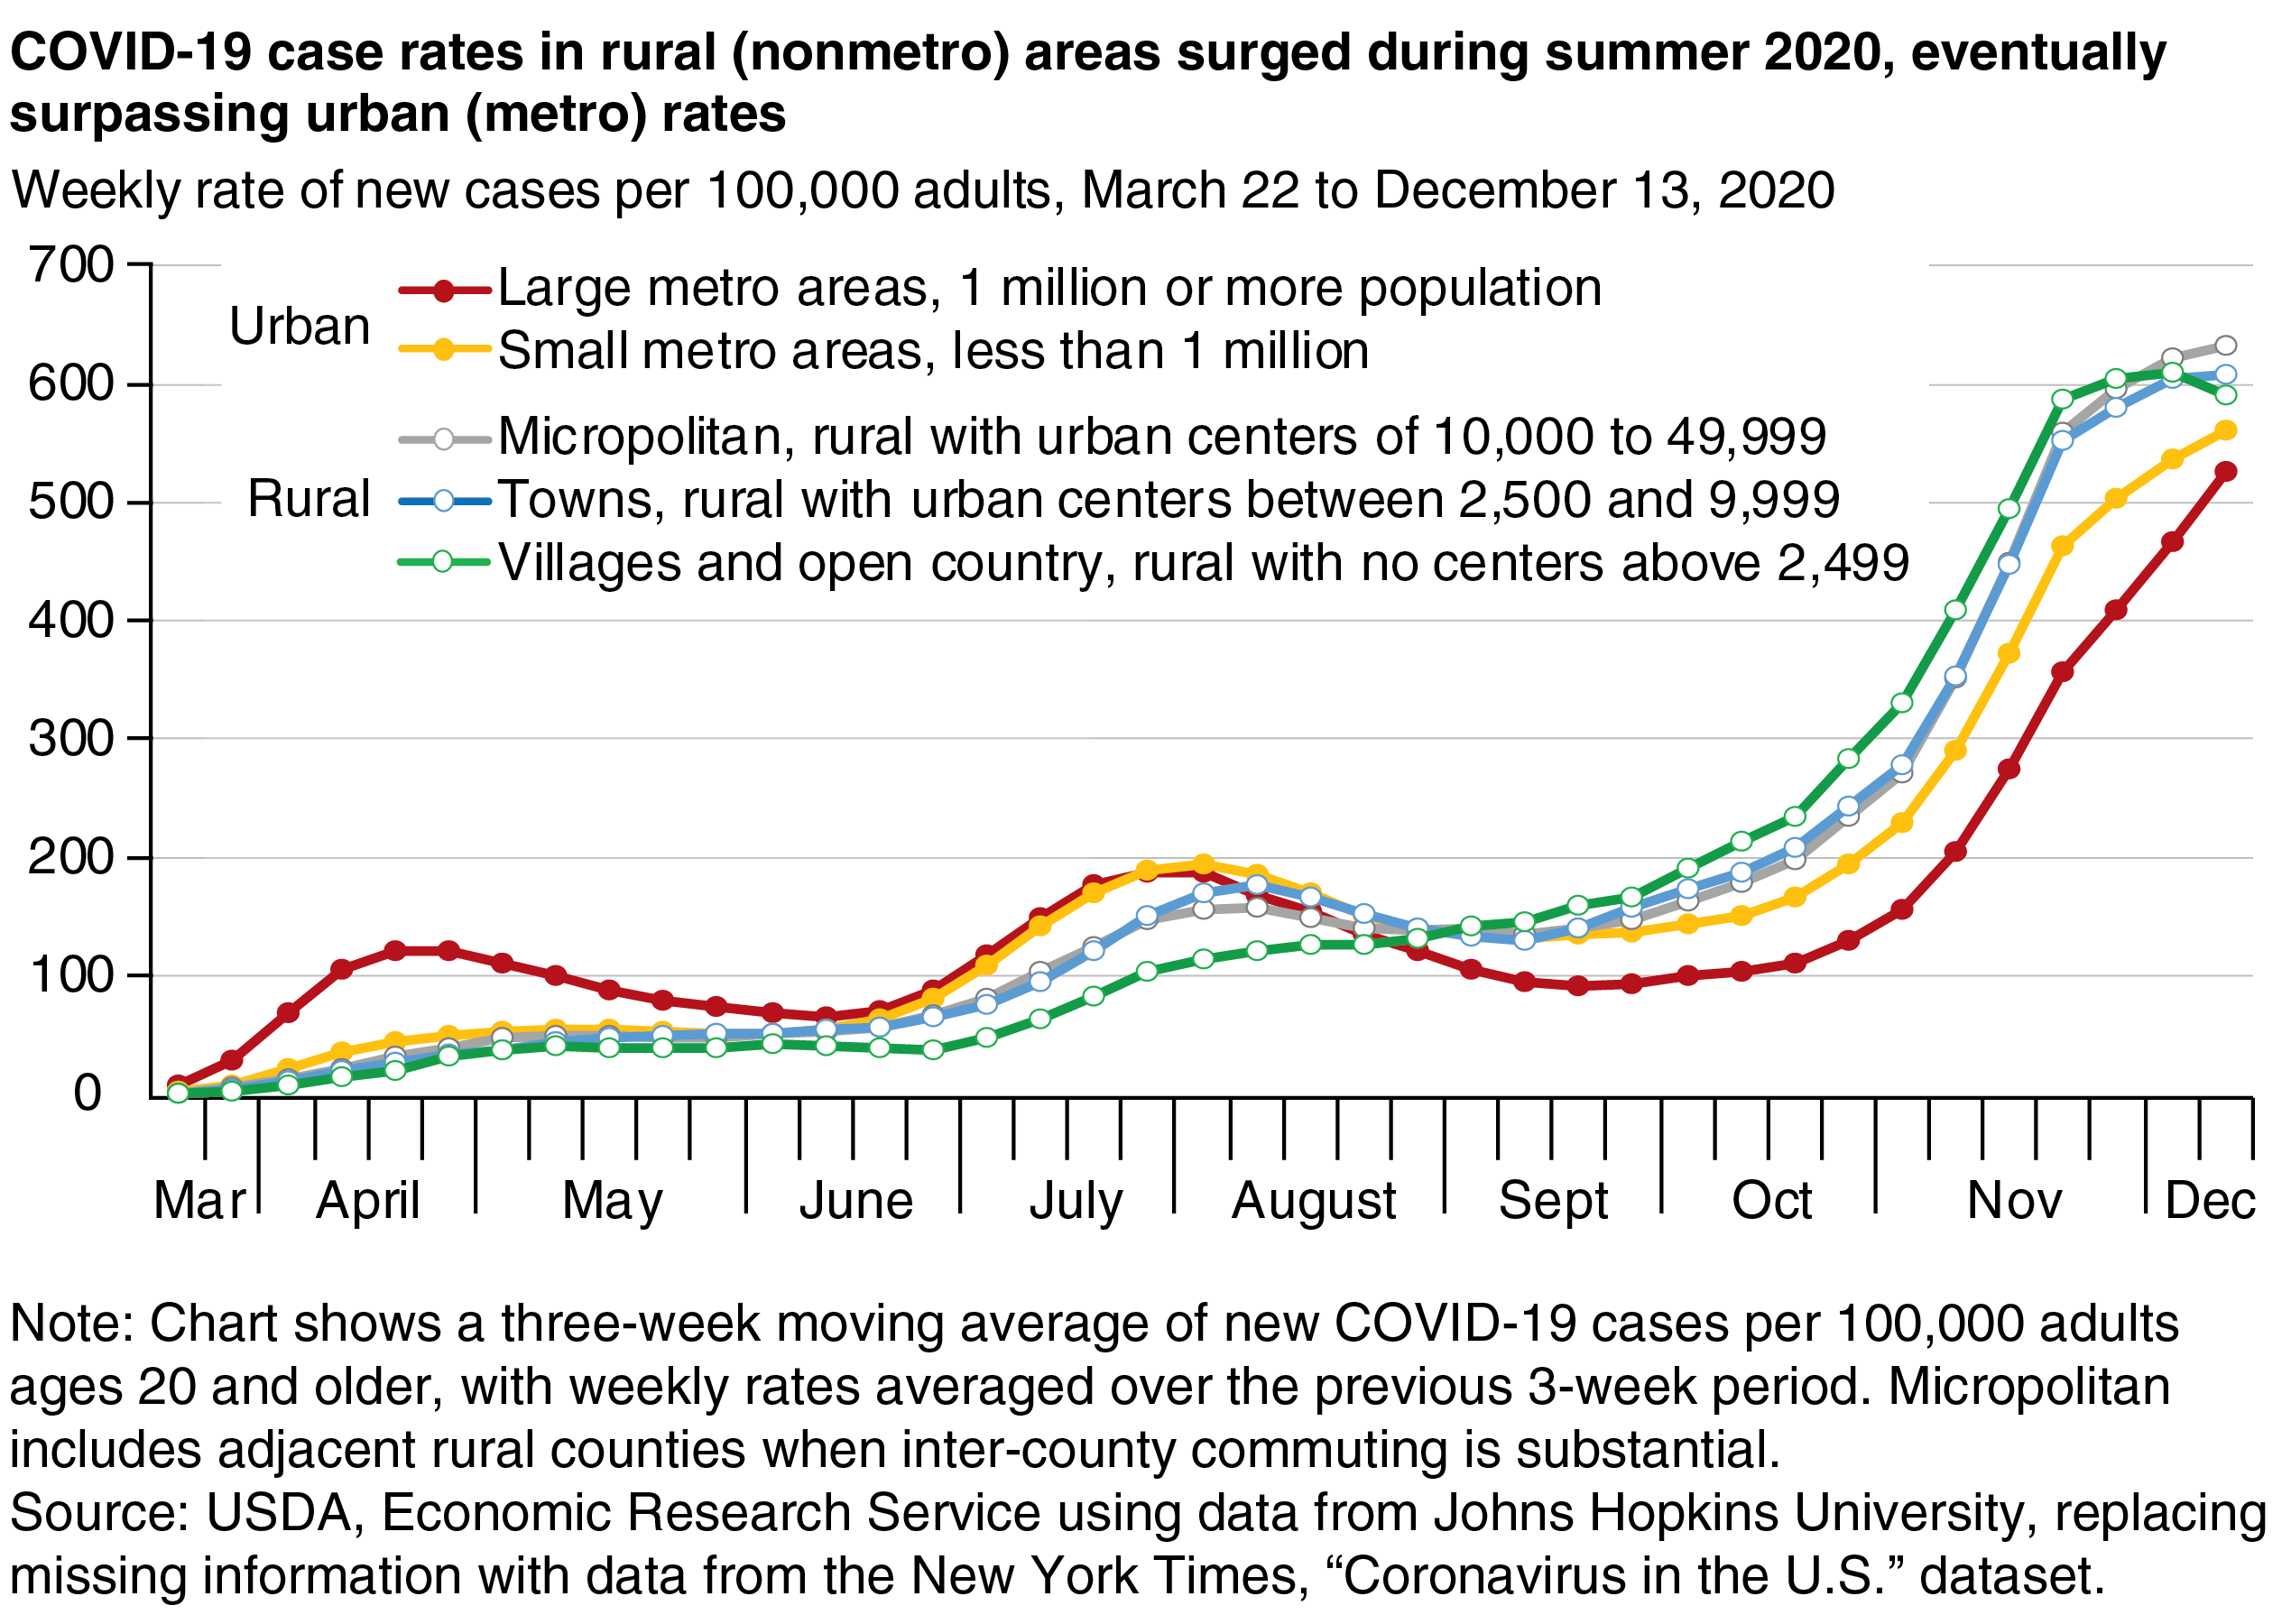
From the beginning, the coronavirus (COVID-19) pandemic has run an uneven and evolving course across the rural-urban continuum. First reported in the United States in January 2020, COVID-19 cases centered on urban (metro) areas for the first 4 months of the year. In May and June, the rate of new cases declined in large urban areas and stabilized elsewhere. A new surge in July was spread more evenly among urban and rural (nonmetro) areas, as case rates increased appreciably in rural areas for the first time. More notably, the subsequent urban decline in August and September was echoed only partially in rural areas. In the most recent surge beginning in late September, the highest case rates were in rural counties, particularly those that have no town larger than 2,499 residents. The lowest rates were in major urban areas. In late November and early December, infection rates in rural areas appeared to be slowing, while new cases in urban areas continued to grow.
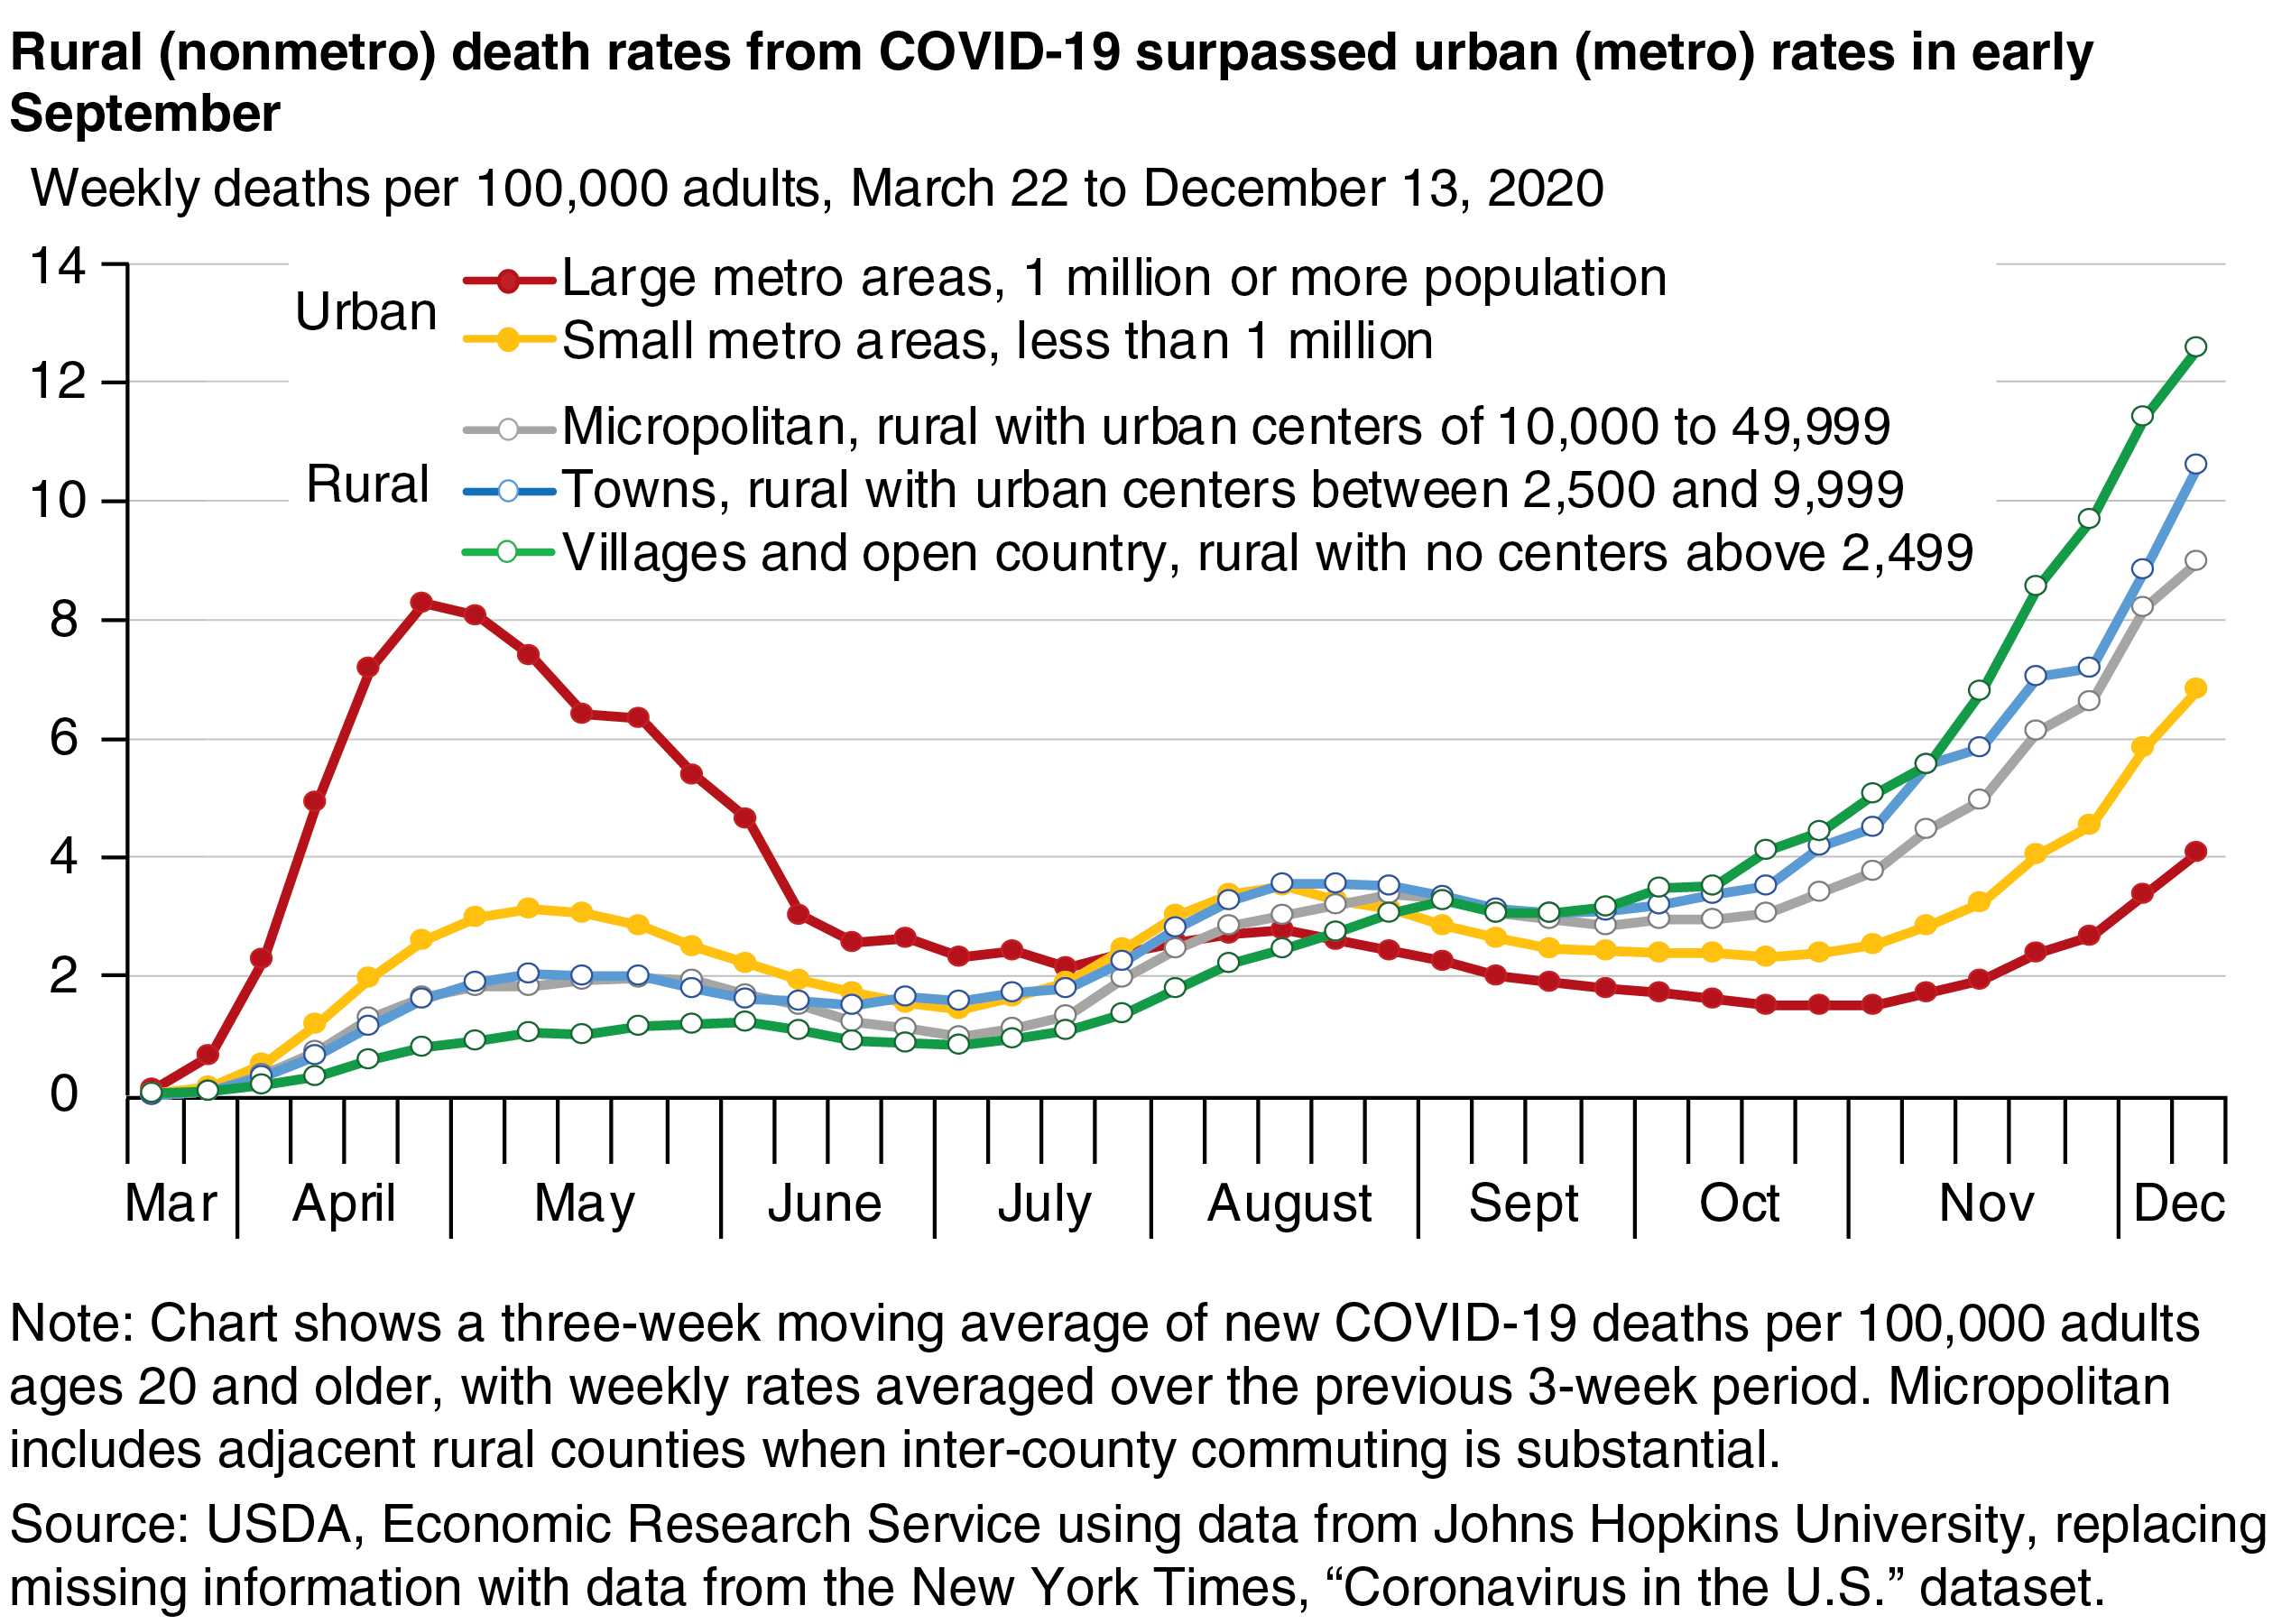
Death rates may provide a better gauge of the extent to which serious COVID-19 infections are affecting the population and the likely demand on rural healthcare resources. As with cases, deaths during the initial surge centered on large urban areas before declining as medical professionals learned more about the virus, how to treat it, and how to prevent its spread. The second COVID-19 surge brought more deaths to rural areas in July and August as the virus spread from major urban areas. This spike was smaller because testing was more widespread, the infected population was younger and less vulnerable, and treatments were more effective. The third surge reversed the rural-urban geography of mortality, and since early September COVID-19 death rates in rural areas have surpassed those in urban areas.
Rural areas showed higher death rates in December because they had more infections per 100,000 adults than urban areas, but this is not the whole story. Rural COVID-19 deaths per 100 infections 2 weeks prior (to account for the lag between infection and death) were 1.86 in the first 2 weeks of December, 48 percent higher than the corresponding urban rate of 1.26. The rural population appears to be more vulnerable to serious infection in several ways. The Centers for Disease Control and Prevention (CDC) identified two characteristics of people highly vulnerable to COVID-19:
- Older age—measured using an older adult population scale, which is defined as the percentage of residents who are age 65 and older, double-counting those age 75 and older to account for the increased vulnerability of those individuals.
- The presence of underlying medical conditions—defined as the 2014-18 average annual natural cause mortality rate.
People may also be more vulnerable when they have difficulty accessing medical care, measured as lacking health insurance or residing more than 32 miles from a county with an intensive care hospital.
| Rural Percent |
Urban Percent |
|
|---|---|---|
| Underlying health conditions (ages 20 to 84) | 23.7 | 3.0 |
| Older adult population scale | 15.9 | 4.0 |
| Lacking health insurance (ages 25 to 64) | 20.2 | 10.5 |
| Distance to county with an intensive care hospital | 11.3 | 0.3 |
|
Notes: Table shows the percentages of nonmetro and metro adult populations (ages 20 and older) in high vulnerability counties defined by each source of vulnerability. For each source, high-vulnerability counties are in the upper quintile (top 20 percent) of American counties. Underlying health conditions are measured as the average yearly age-standardized mortality rate in 2014-18 from natural causes (excludes homicide, suicide, and accidents, including overdoses). The older adult population scale is measured as the percentage of adult population ages 60 to 74, plus double the percentage of those age 75 and over. Distance is measured between county geographic population centers. Both nonmetro and metro population percentages can be under 20 when vulnerability is greater in counties with relatively small populations. Sources: USDA, Economic Research Service using data from the Centers for Disease Control and Prevention, National Center for Health Statistics, Detailed Mortality file; the U.S. Department of Commerce, Bureau of the Census, 2018 American Community Survey, 5-year data; U.S. Department of Commerce, Bureau of the Census, 2010 Decennial Census Geographic Reference Files; U.S. Department of Health and Human Services, Health Resources and Services Administration, Bureau of Health Workforce, 2018-19 Area Health Resource File; and Kaiser Health News calculations from the U.S. Centers for Medicare and Medicaid Services, 2018-19 Healthcare Cost Report Information System. |
||
For each of these four vulnerability factors, rural residents are more likely to live in a high-vulnerability county (top 20 percent of all counties) than are urban residents. For instance, nearly a quarter of rural residents live in counties with high mortality due to underlying medical conditions, 7.9 times greater than the rate for urban residents. More urban residents live in a county with high rates of uninsured individuals than any other vulnerability factor, but the proportion of the rural population living in these counties is nearly double the urban proportion. In addition, nearly a sixth of rural residents live in counties where they are vulnerable because of distance to an intensive care hospital—35 times greater than the percentage for urban residents.
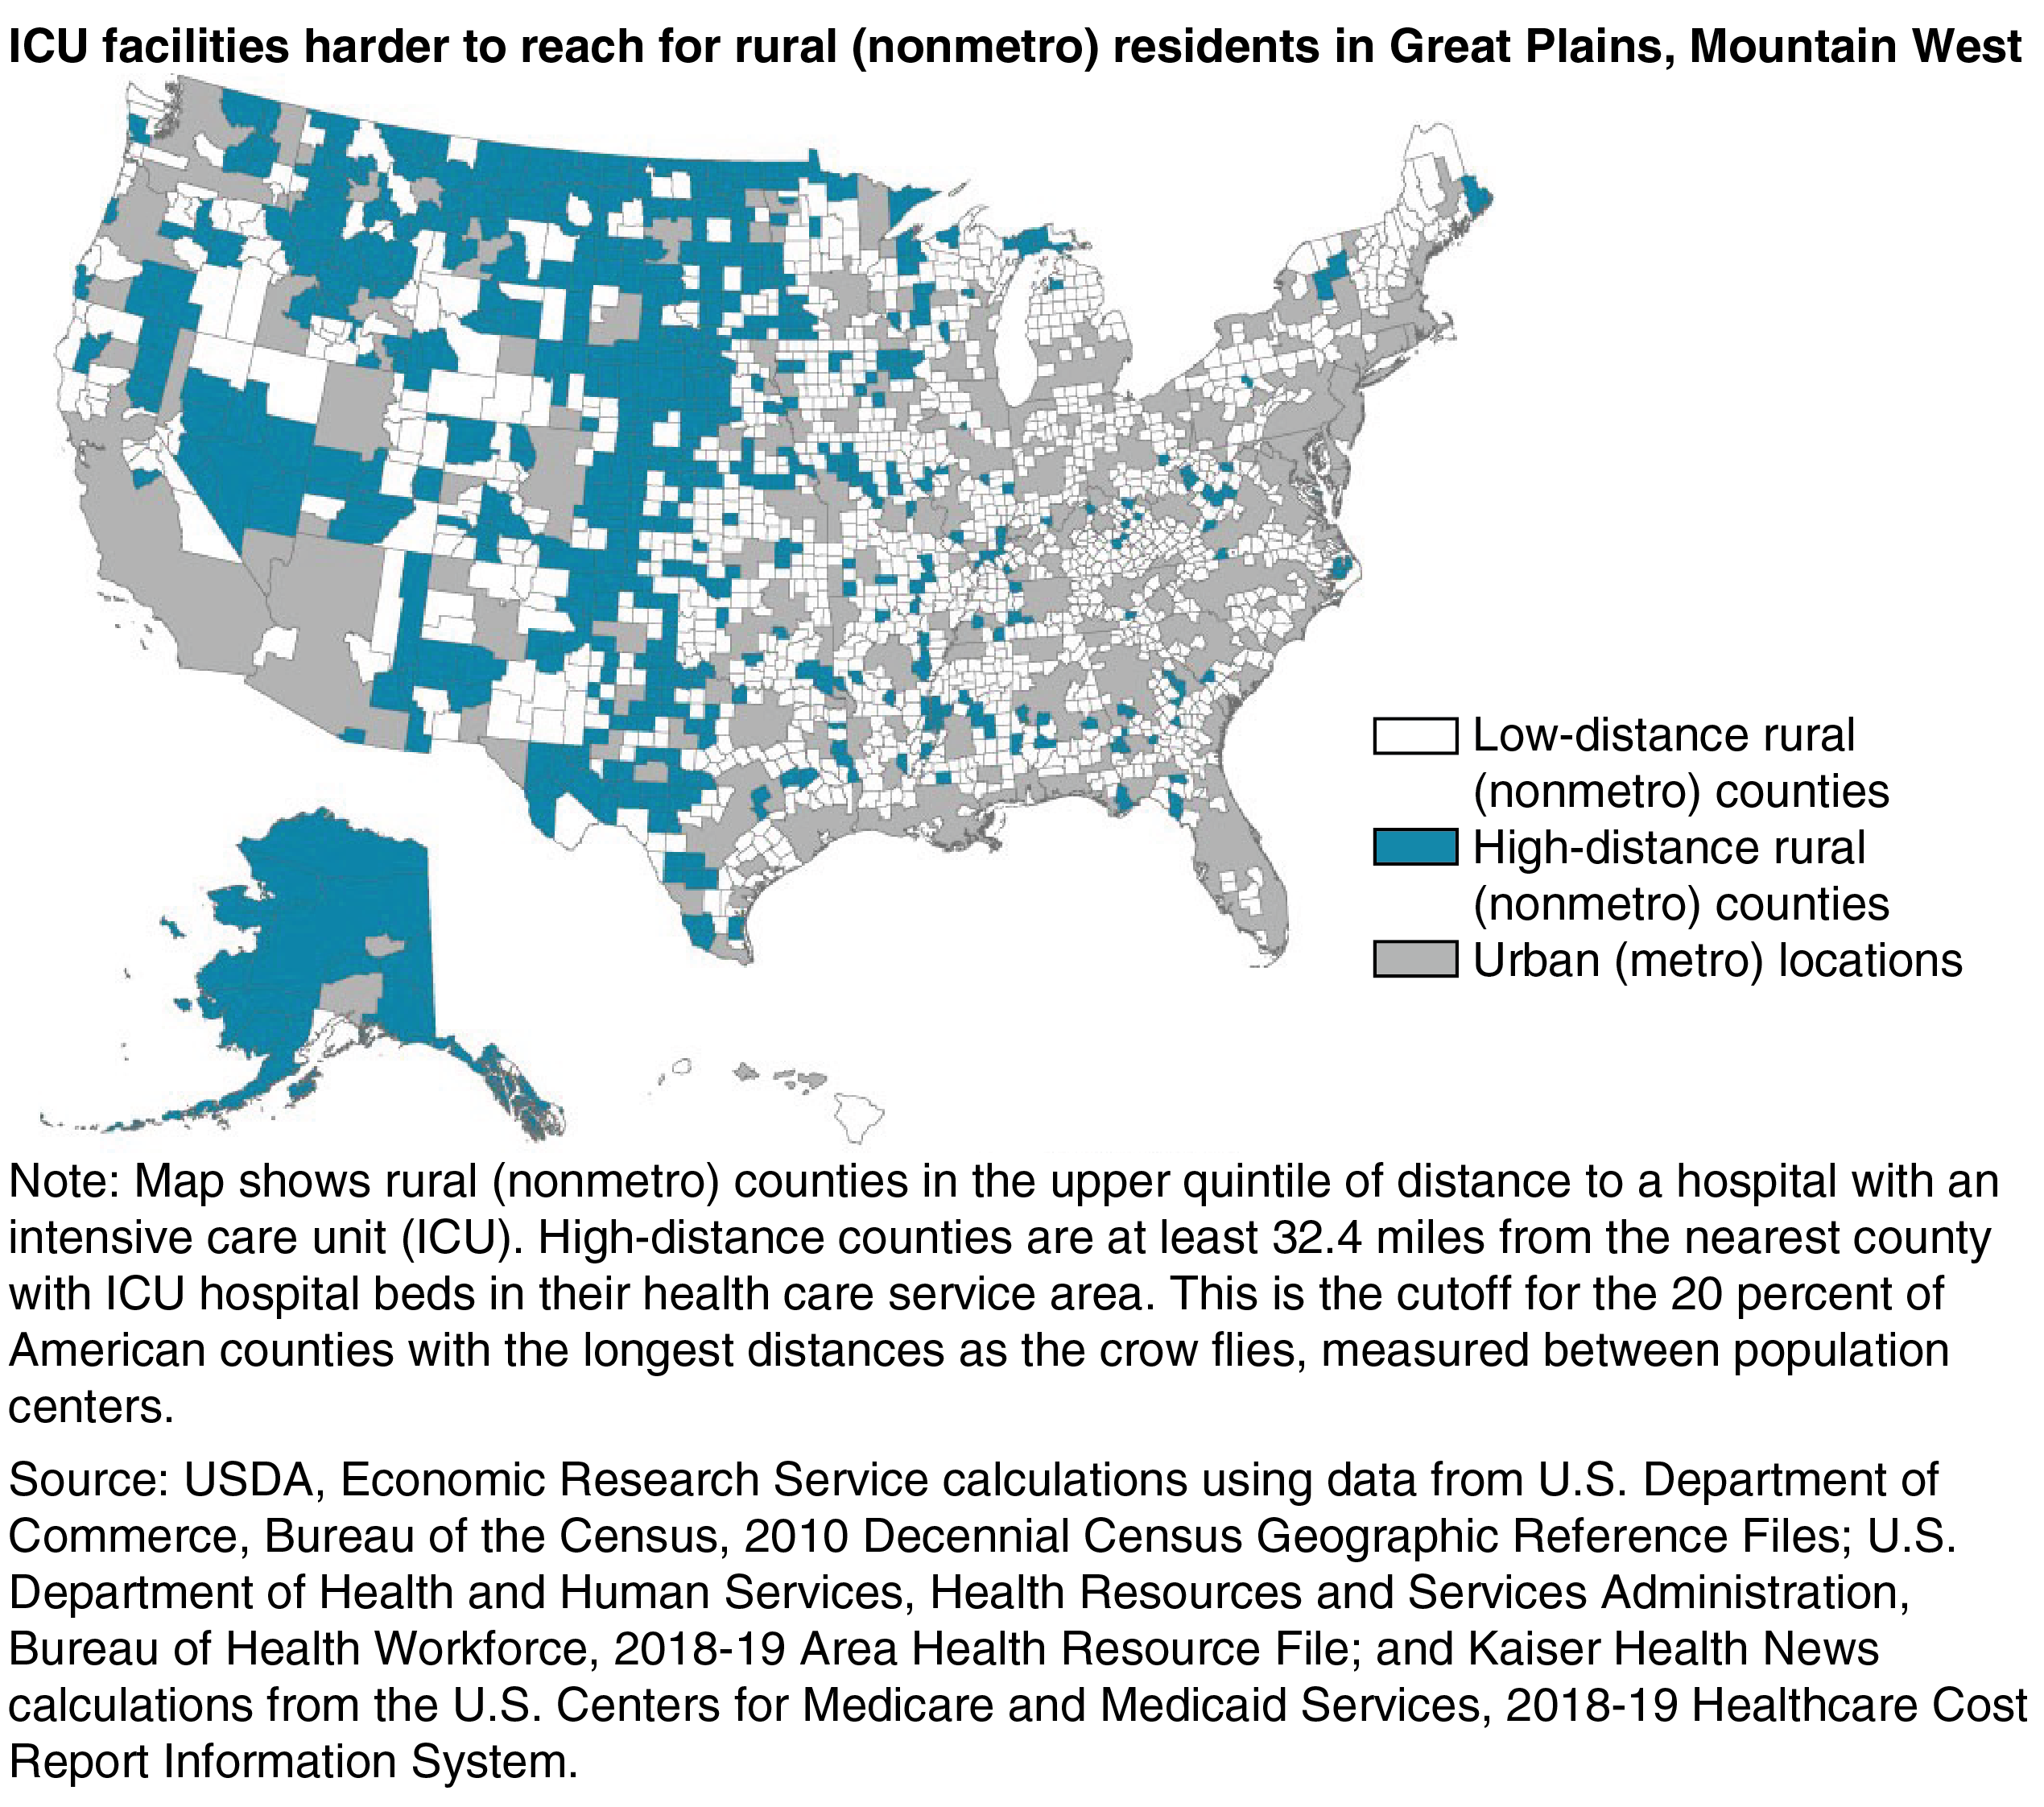
Rural residents living far from intensive care hospitals may have difficulty receiving care in a timely manner. The map shows the top 20 percent of rural counties with the longest average distance to the population center of a county with an intensive care hospital. Overall, 93 percent of high-distance counties are rural. In these counties, elderly residents and those with underlying medical conditions may have difficulty accessing medical care quickly when complications from COVID-19 arise. Of the 628 high-distance counties, 46 percent are also high vulnerability for older age and 17 percent are high vulnerability for underlying medical conditions.
This article is drawn from:
- Cromartie, J., Dobis, E.A., Krumel, T., McGranahan, D. & Pender, J. (2020). Rural America at a Glance: 2020 Edition. U.S. Department of Agriculture, Economic Research Service. EIB-221.
You may also like:
- Cromartie, J. (2020, July 6). Modest Improvement in Nonmetro Population Change During the Decade Masks Larger Geographic Shifts. Amber Waves, U.S. Department of Agriculture, Economic Research Service.
- Population & Migration. (n.d.). U.S. Department of Agriculture, Economic Research Service.
- Atlas of Rural and Small-Town America. (n.d.). U.S. Department of Agriculture, Economic Research Service.


