Modest Improvement in Nonmetro Population Change During the Decade Masks Larger Geographic Shifts
- by John Cromartie
- 7/6/2020
Natural change—fewer births, more deaths, and an aging population—is creating a major demographic challenge for many regions across rural and small-town America, according to USDA’s Economic Research Service (ERS) research. But nonmetropolitan (nonmetro) areas that border on metropolitan areas seem to fare better in attracting new people and keeping long-time residents.
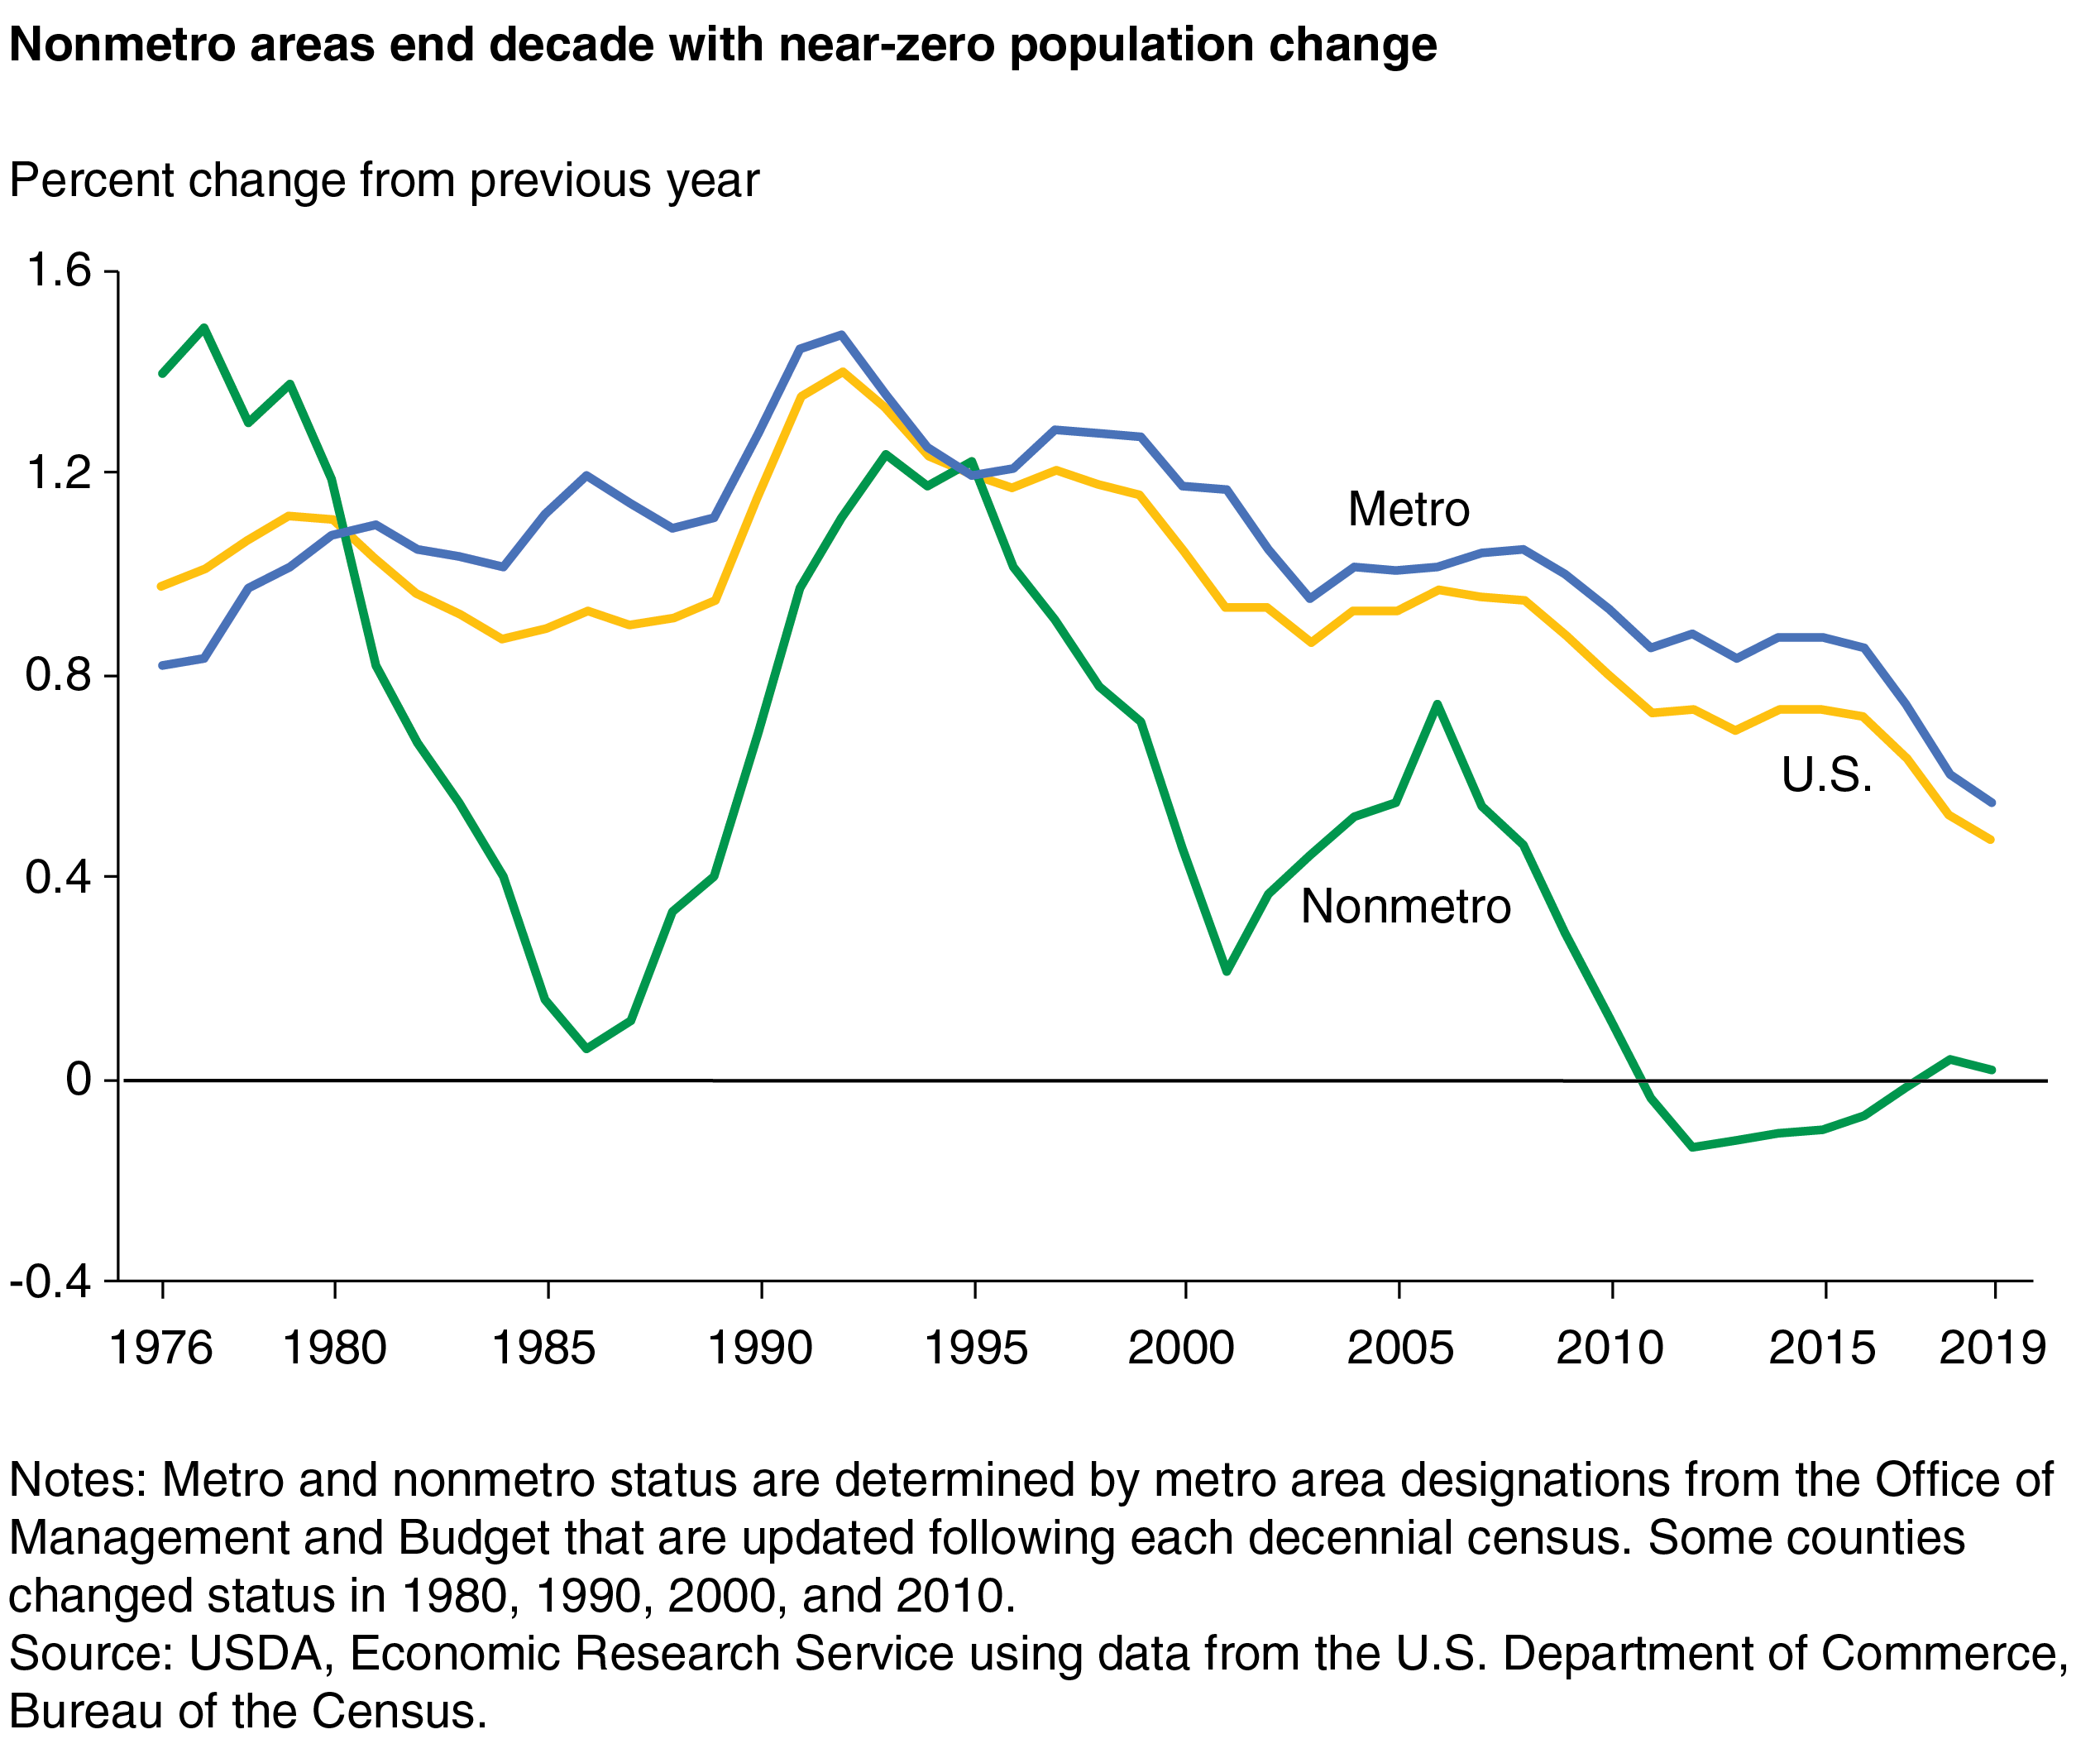
The U.S. population in nonmetro counties stood at 46.1 million in July 2019, accounting for 14 percent of U.S. residents spread across 72 percent of the Nation's land area. Nonmetro population growth has remained close to zero in recent years and grew by just 0.02 percent from July 2018 to July 2019, according to the latest county population estimates from the U.S. Department of Commerce, Bureau of the Census. As in previous periods of economic difficulties, such as in the mid-1980s and early 2000s, nonmetro America experienced a steep decline in population growth rates during the Great Recession. Nonmetro population growth fell from a peak of 0.7 percent in 2006-07 to -0.14 percent in 2011-12. Unlike those previous periods of difficulty, the post-recession population recovery during the 2010s has been quite slow. The nonmetro growth rate has been lower than in metropolitan (metro) counties since the mid-1990s, and the gap widened considerably in recent years.
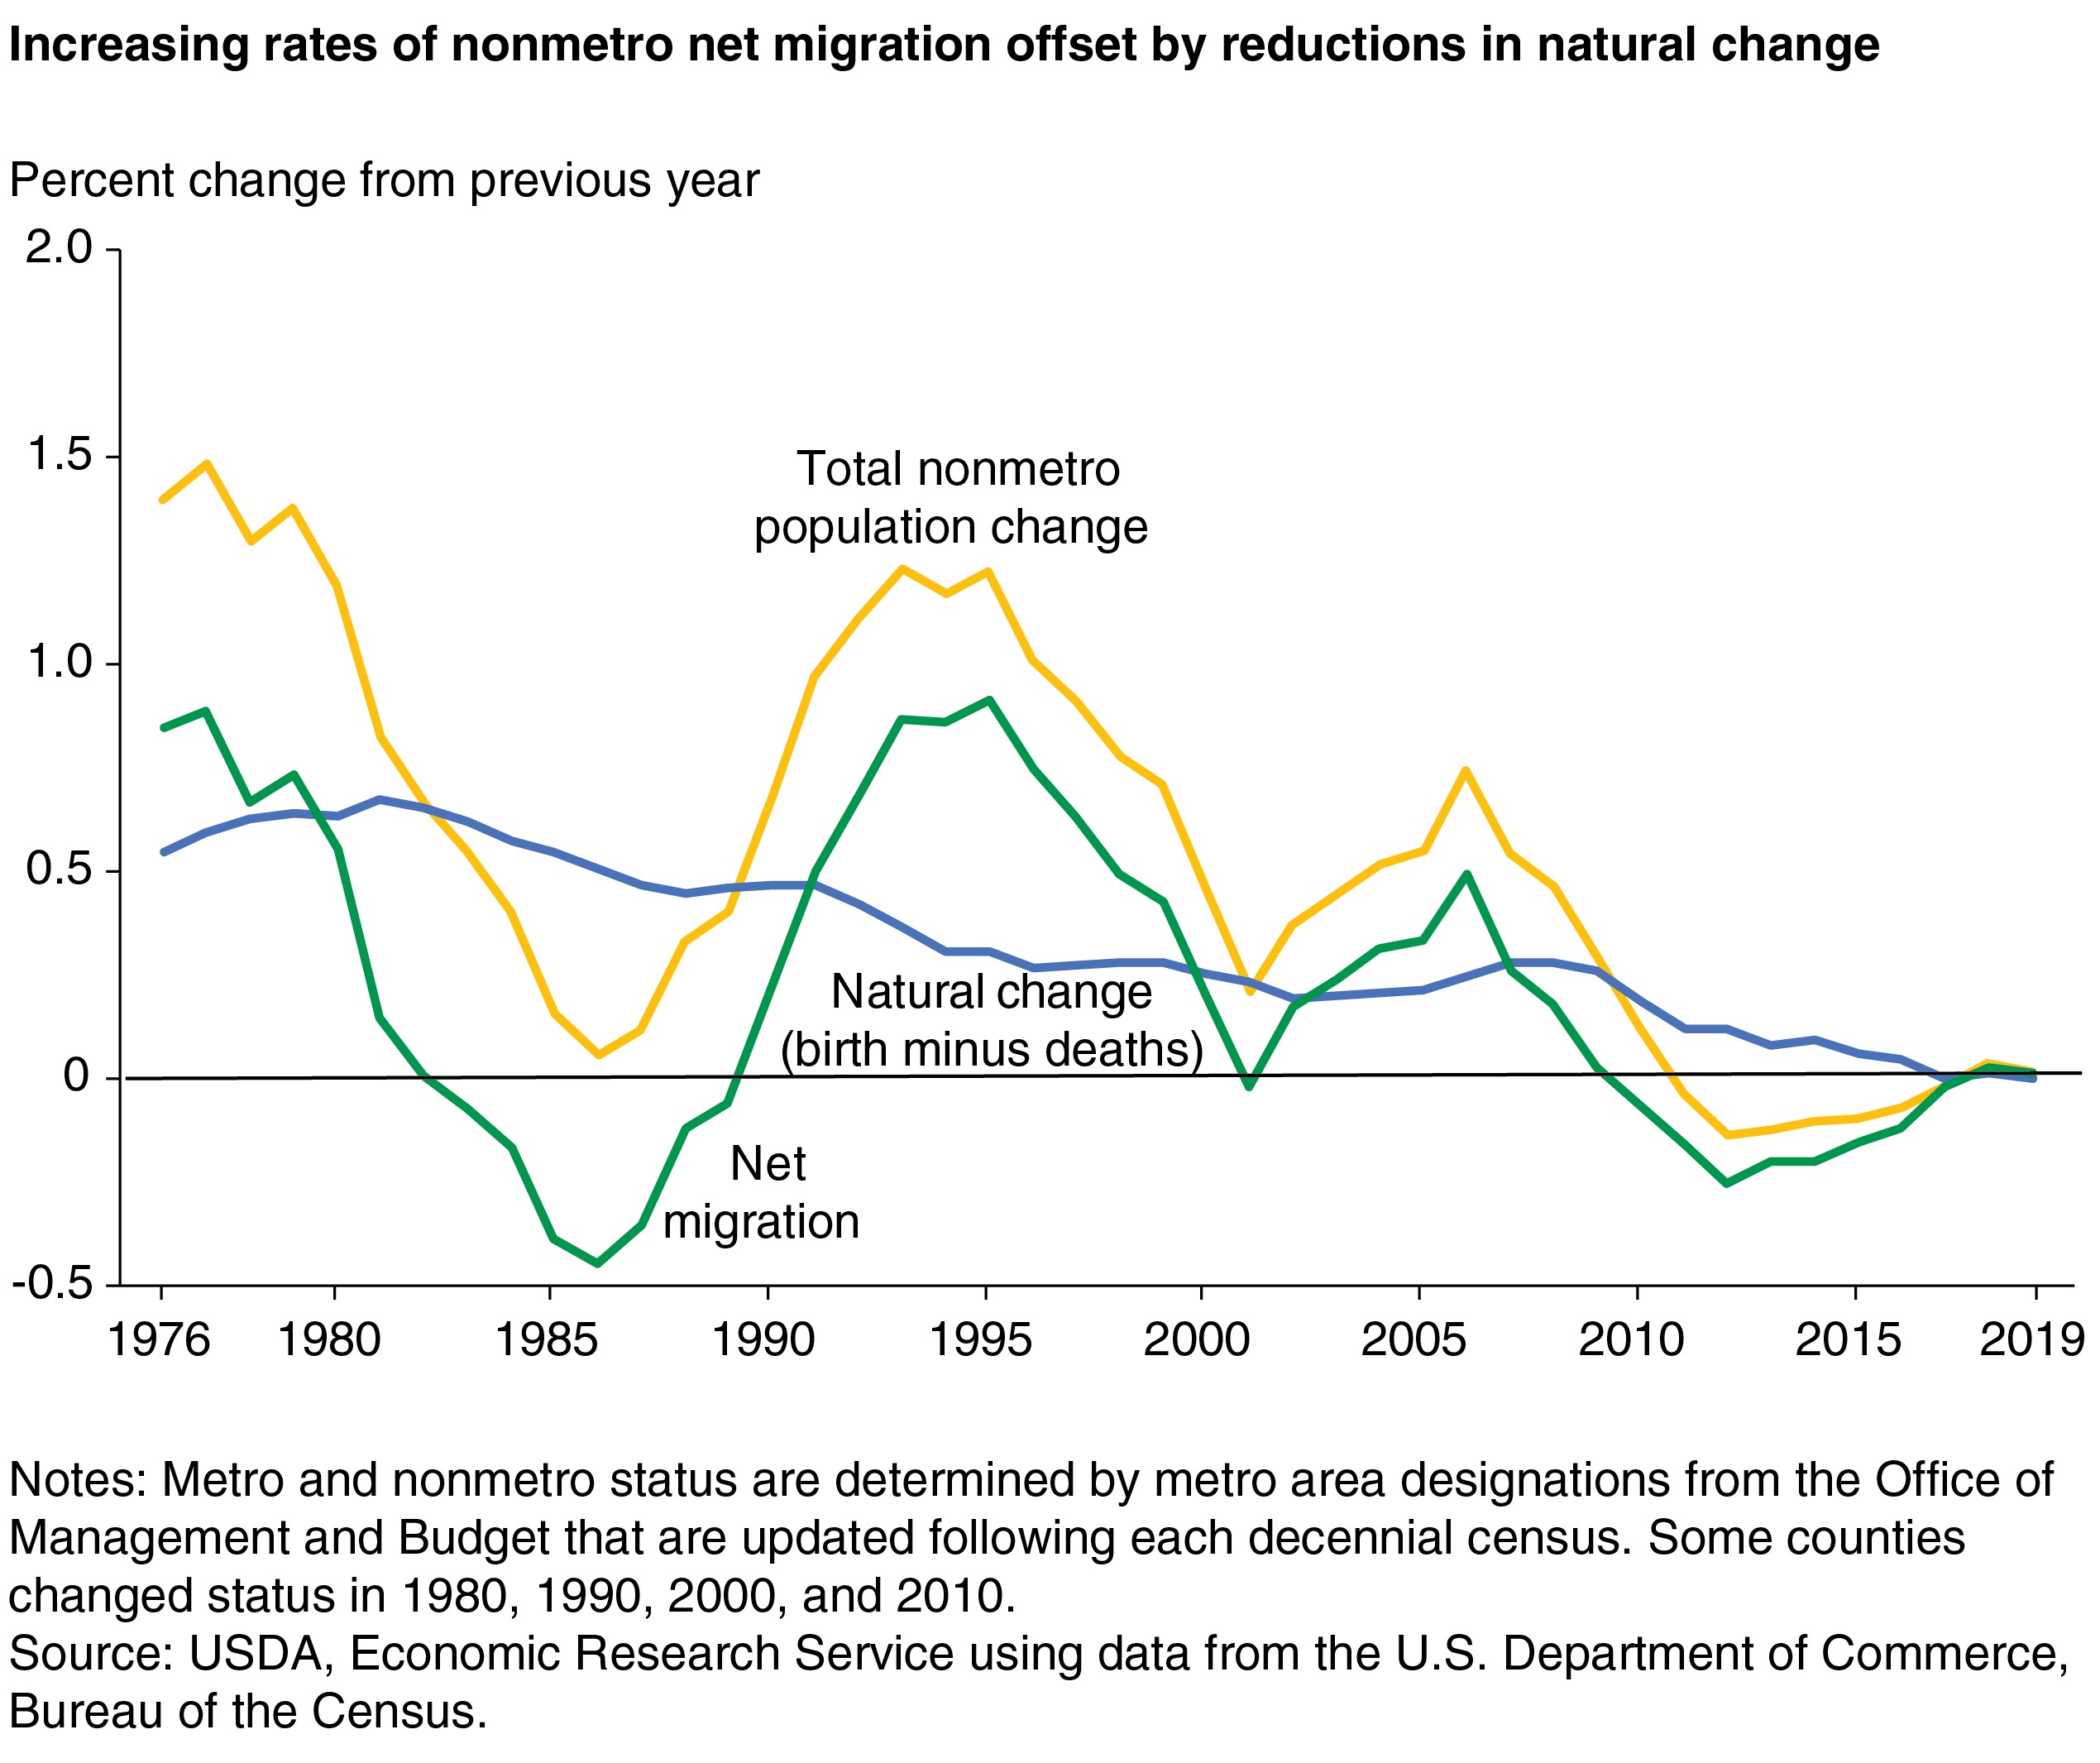
County population change includes two components: natural change (births minus deaths) and net migration (inmigrants minus outmigrants, or people moving into an area minus people moving out of the area). Historically, the nonmetro population grew because high rates of natural change always offset any net migration loss. Falling birth rates, increasing mortality rates, and an aging population have led to a decline in nonmetro natural change during this decade, contributing to a smaller population recovery than in previous decades. This historic shift to low natural change, likely for the long-term, represents a major demographic challenge facing many regions across rural and small-town America.
Modest improvements in nonmetro population trends during the 2010s can be seen by comparing two different 3-year periods. Between July 2011 and July 2014, nonmetro population growth dropped below -0.1 percent and the population declined by close to 170,000 people. By comparison, between July 2016 and July 2019, annual nonmetro population growth rates averaged 0.01 percent and the population grew by nearly 19,000. However, this overall trend masks larger underlying changes in the geography of nonmetro population growth and decline. A comparison of county maps for the same two time periods shows several geographic shifts in population change that occurred between the early and late 2010s.
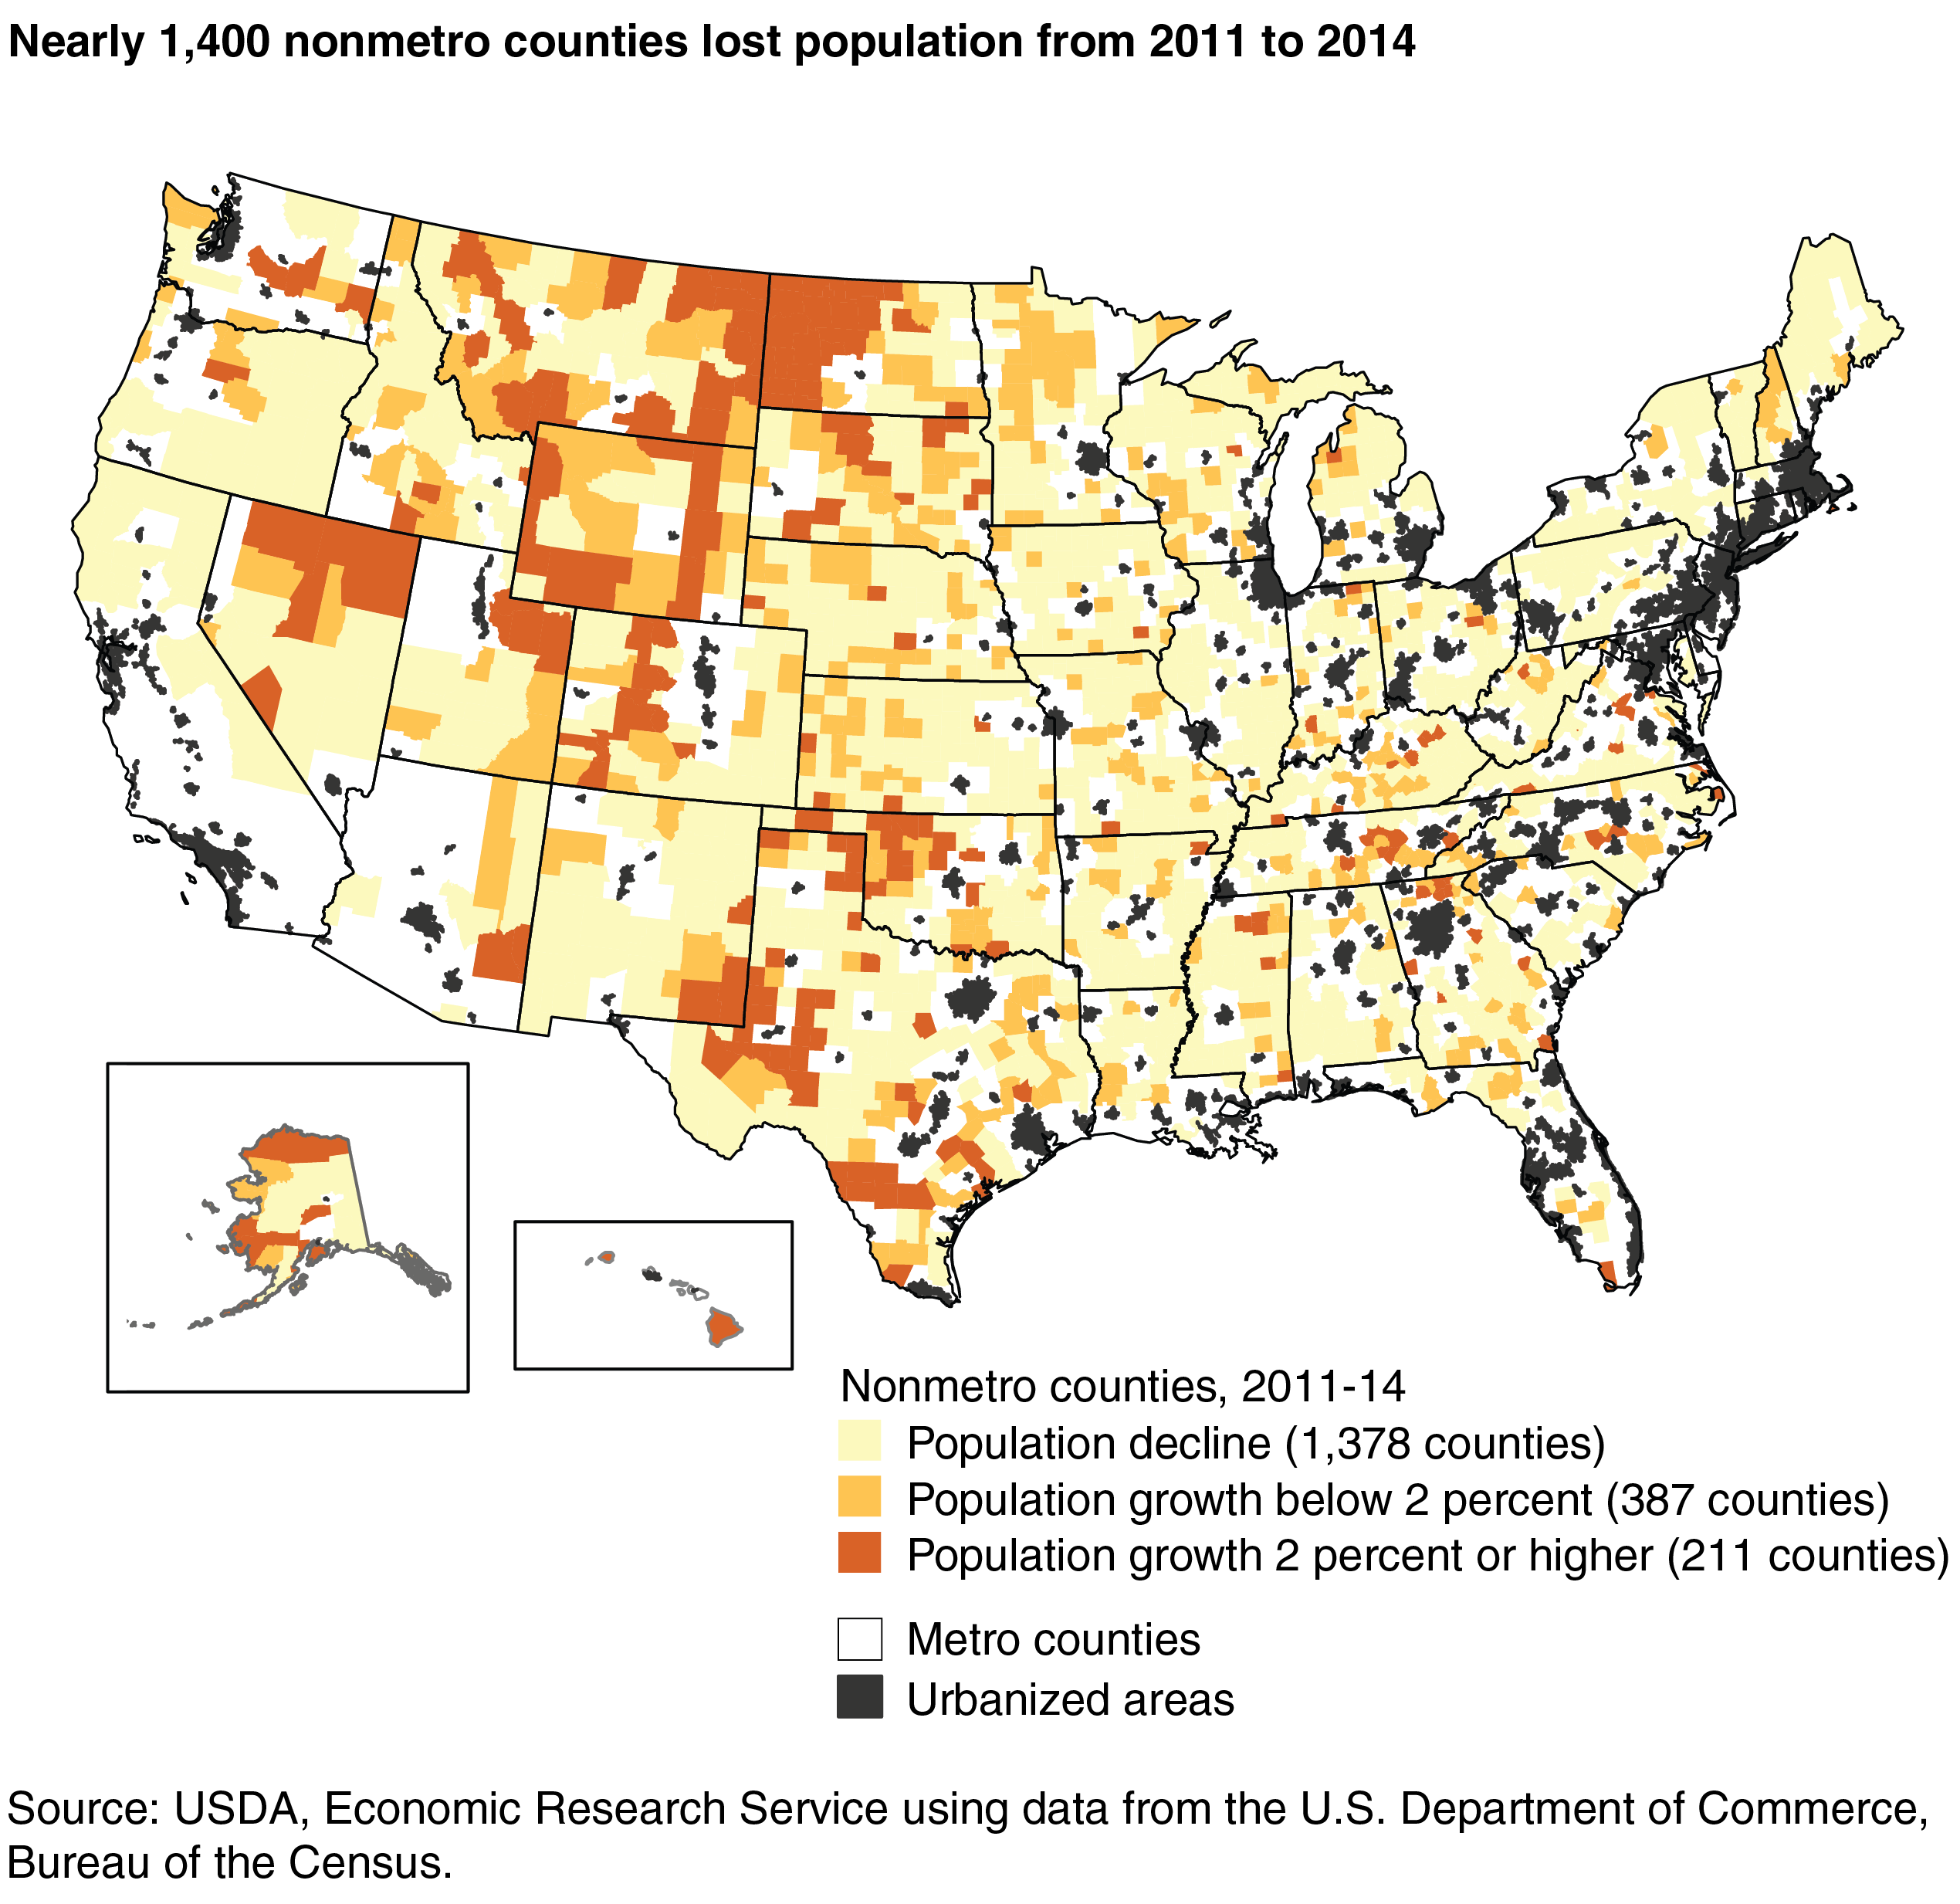
As shown in the first map below, nonmetro population loss was widespread during 2011-14, not only in parts of the Great Plains and Midwest with long-term outmigration, but throughout the eastern half of the country and along the Pacific Coast. The number of counties with rapid population growth from steadily booming recreation, tourism, and retirement economies was severely limited during this post-recession period and were found mostly in high-amenity areas in the southern Appalachians and Rocky Mountains. Most striking among the 211 nonmetro counties that were growing above 2 percent population growth early in the decade were those located in several shale oil and gas production areas, including western North Dakota and eastern Montana, central Wyoming, western Oklahoma, southeast New Mexico, and western and southern Texas. Many of these counties gained population after decades of persistent population decline.
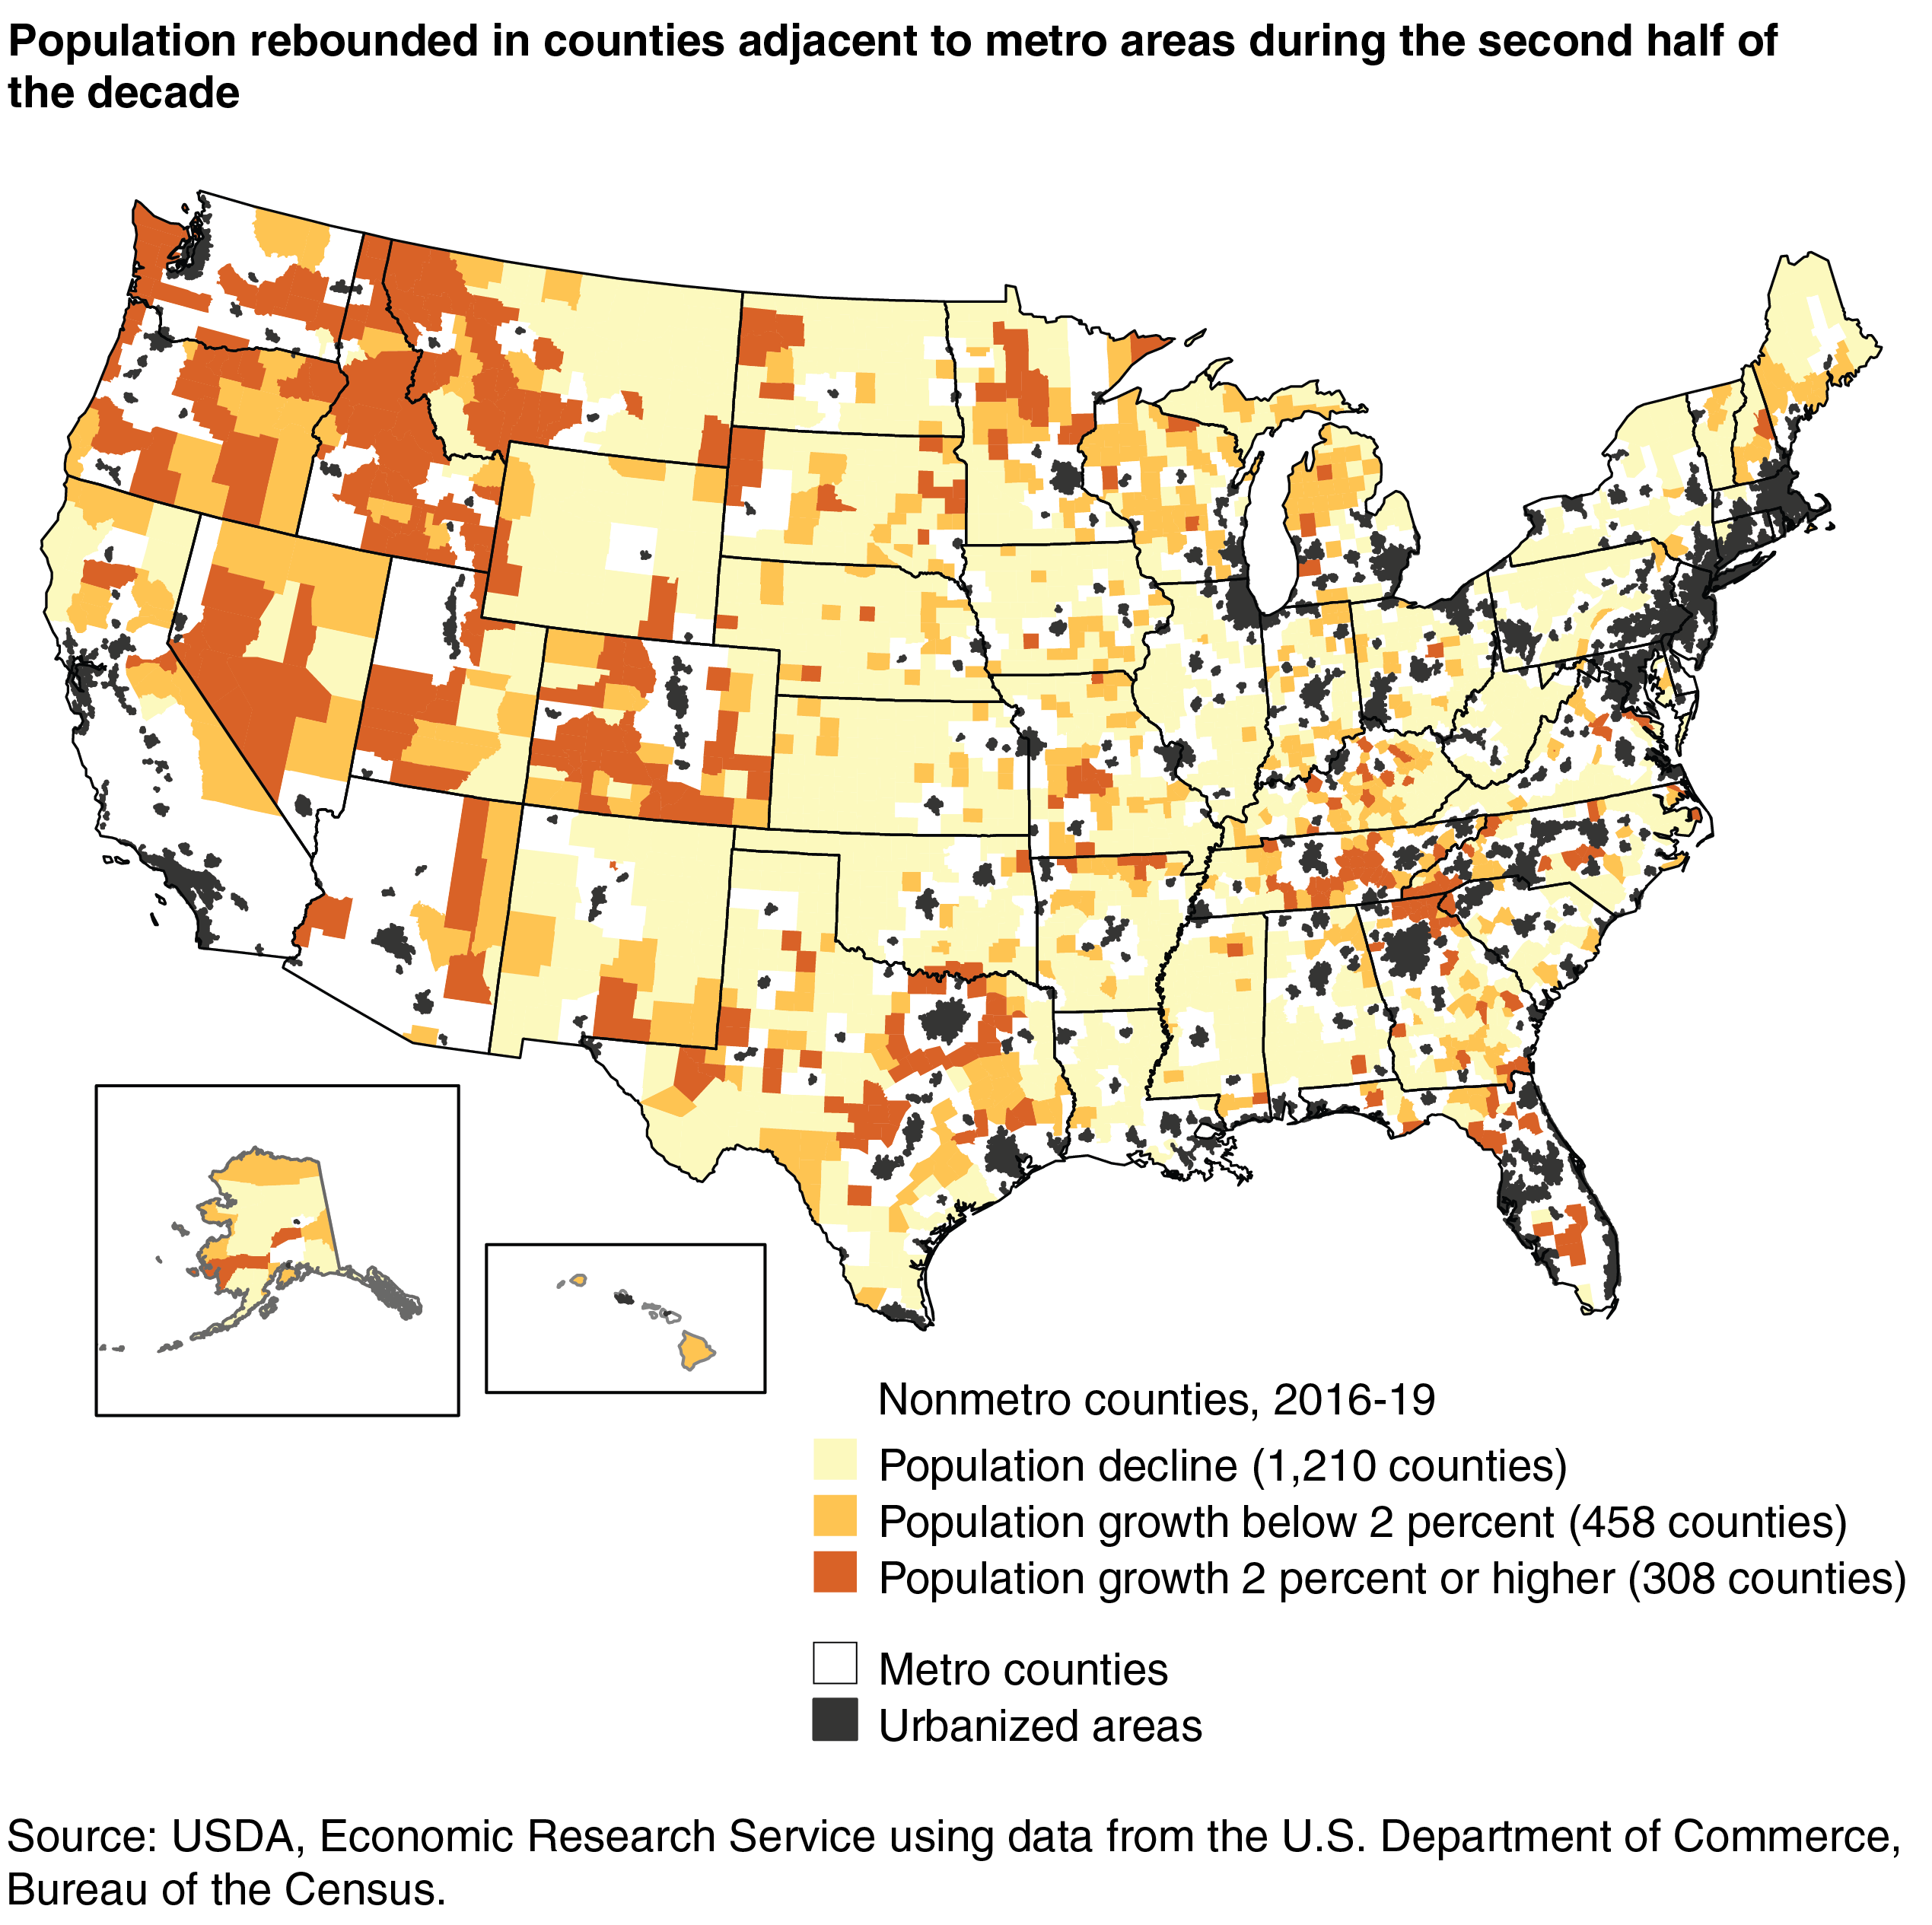
The next map shows that population decline continued in much of the eastern United States in the second half of the decade. However, notable rebounds are seen in some high-amenity areas, especially those close to large metro areas such as in Tennessee, Georgia, and Florida. Renewed population growth on the metro periphery is also noticeable in central Texas, Colorado, and the Pacific Northwest. As a result, the number of nonmetro counties losing population fell from 1,378 in 2011-14 to 1,210 in 2016-19. The number of counties growing above 2 percent increased from 211 to 308, despite significant population downturns in all oil and gas producing regions.
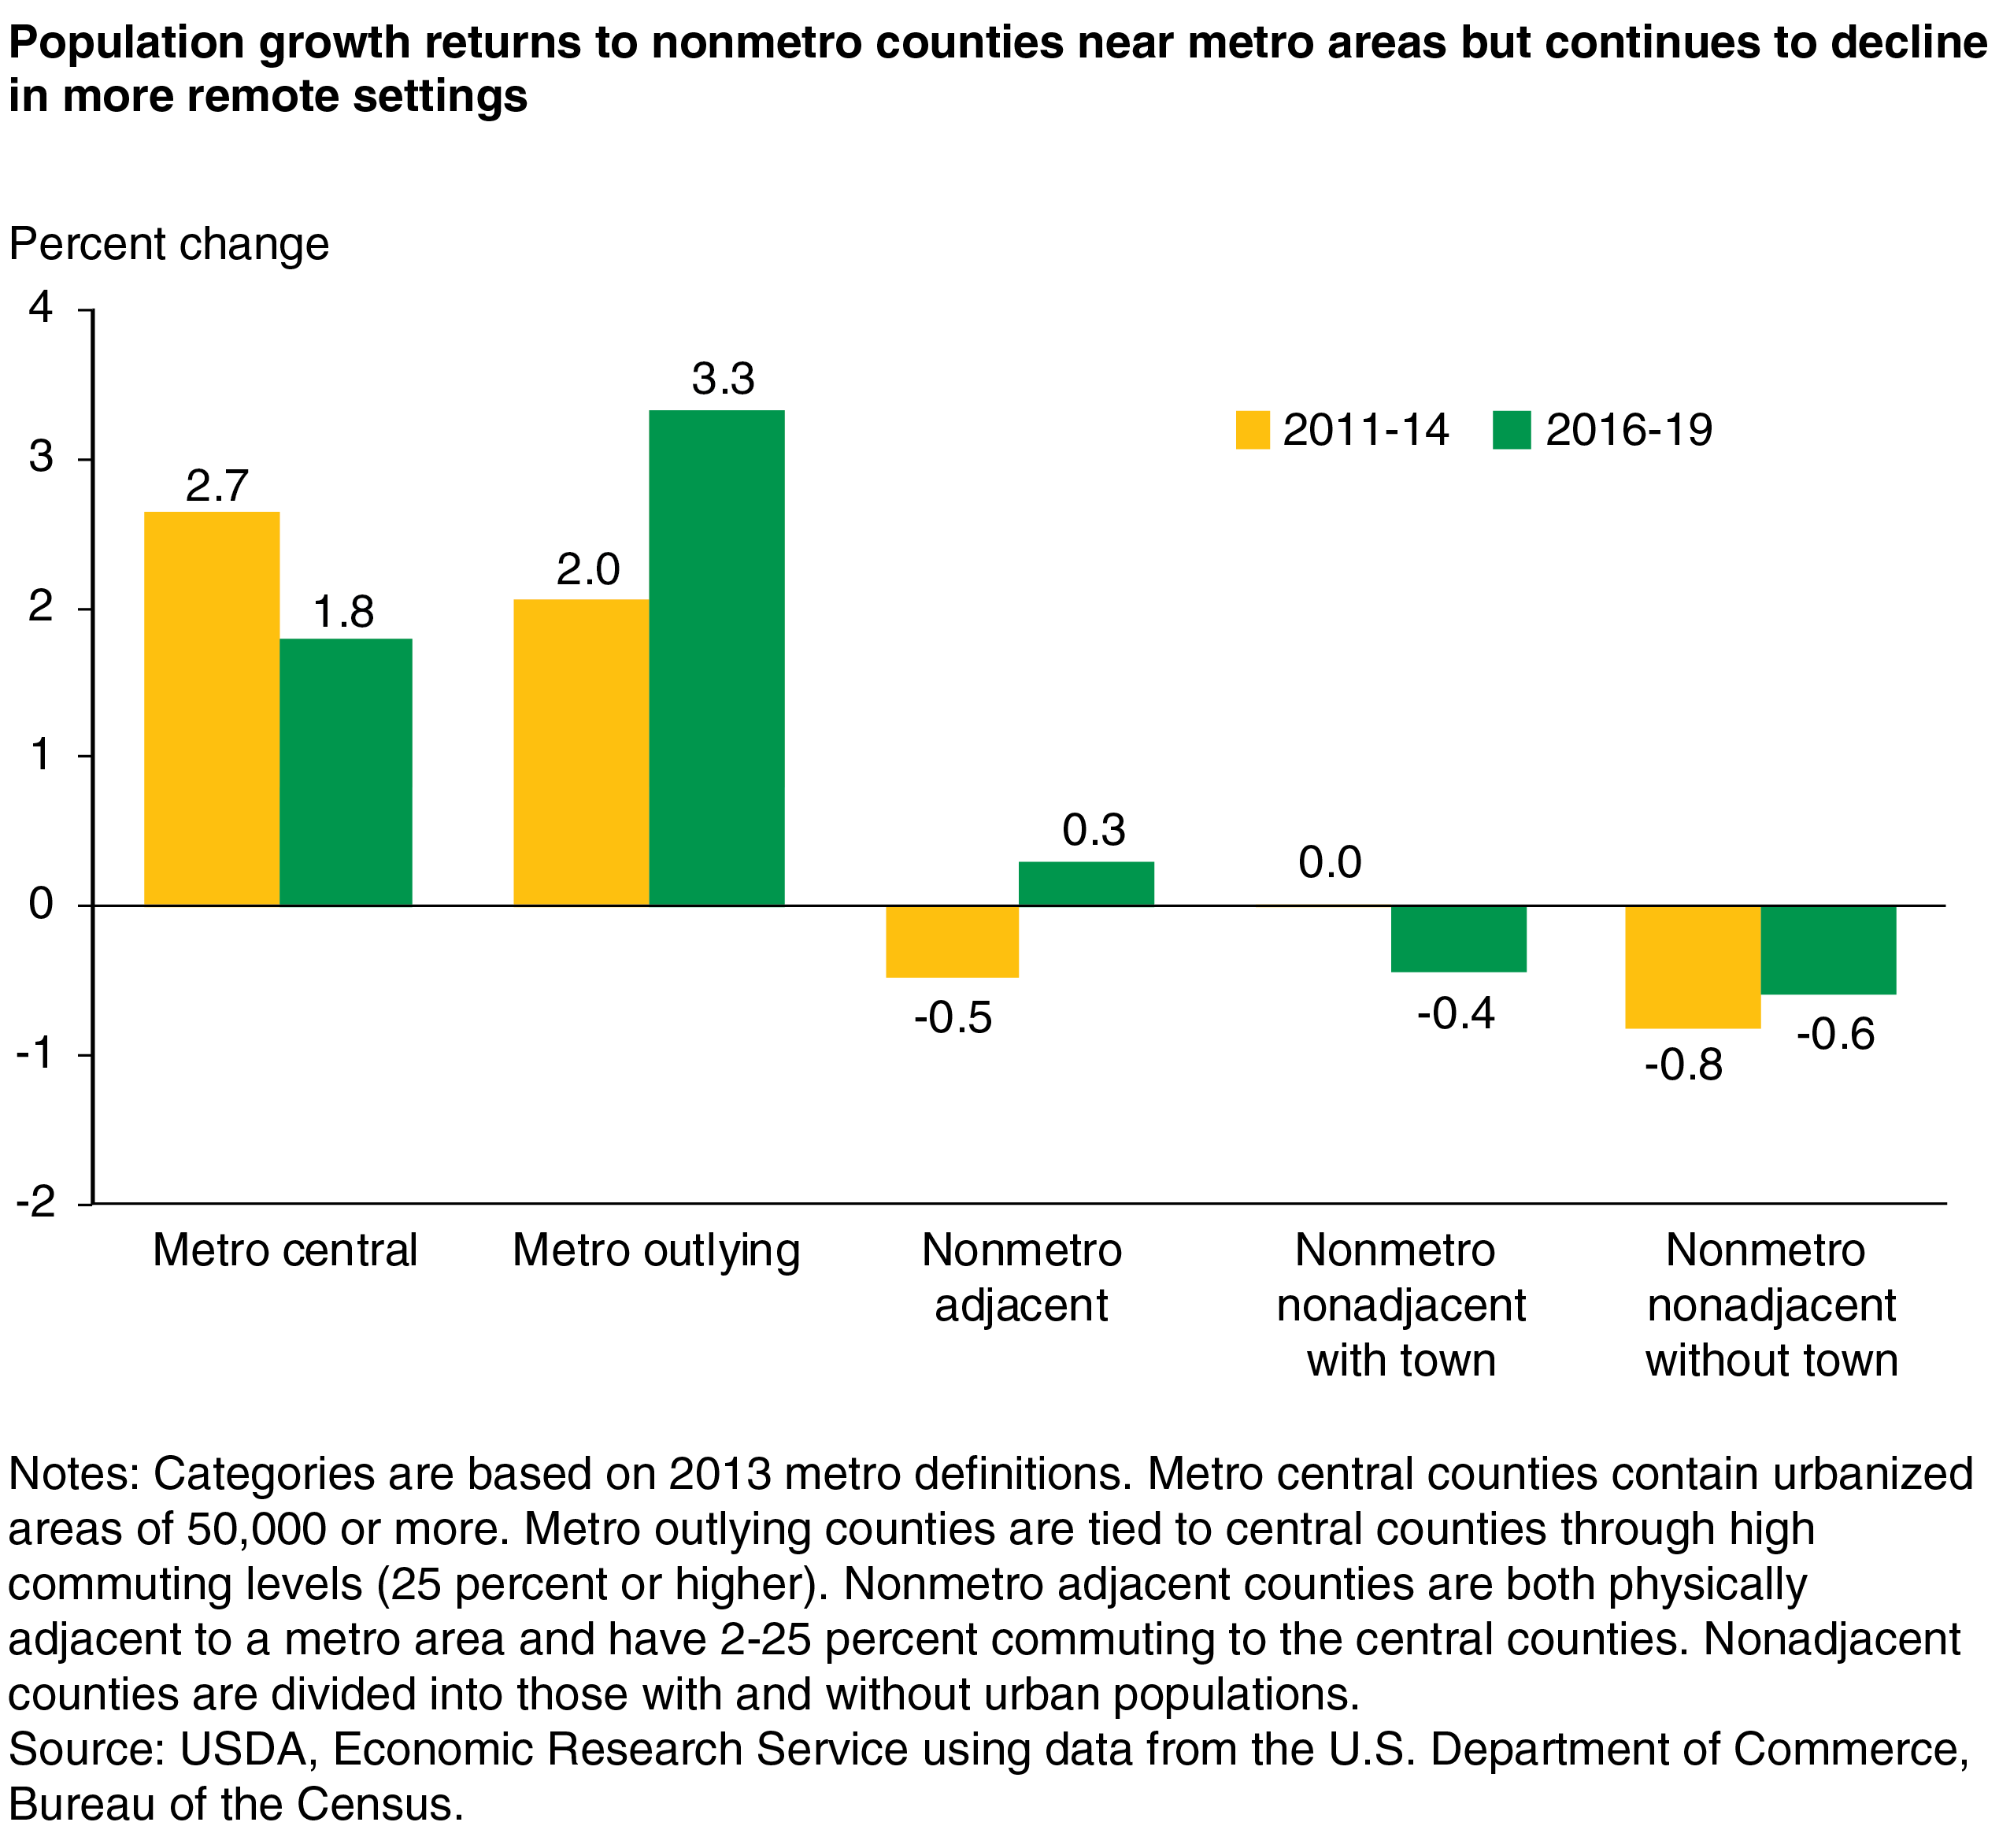
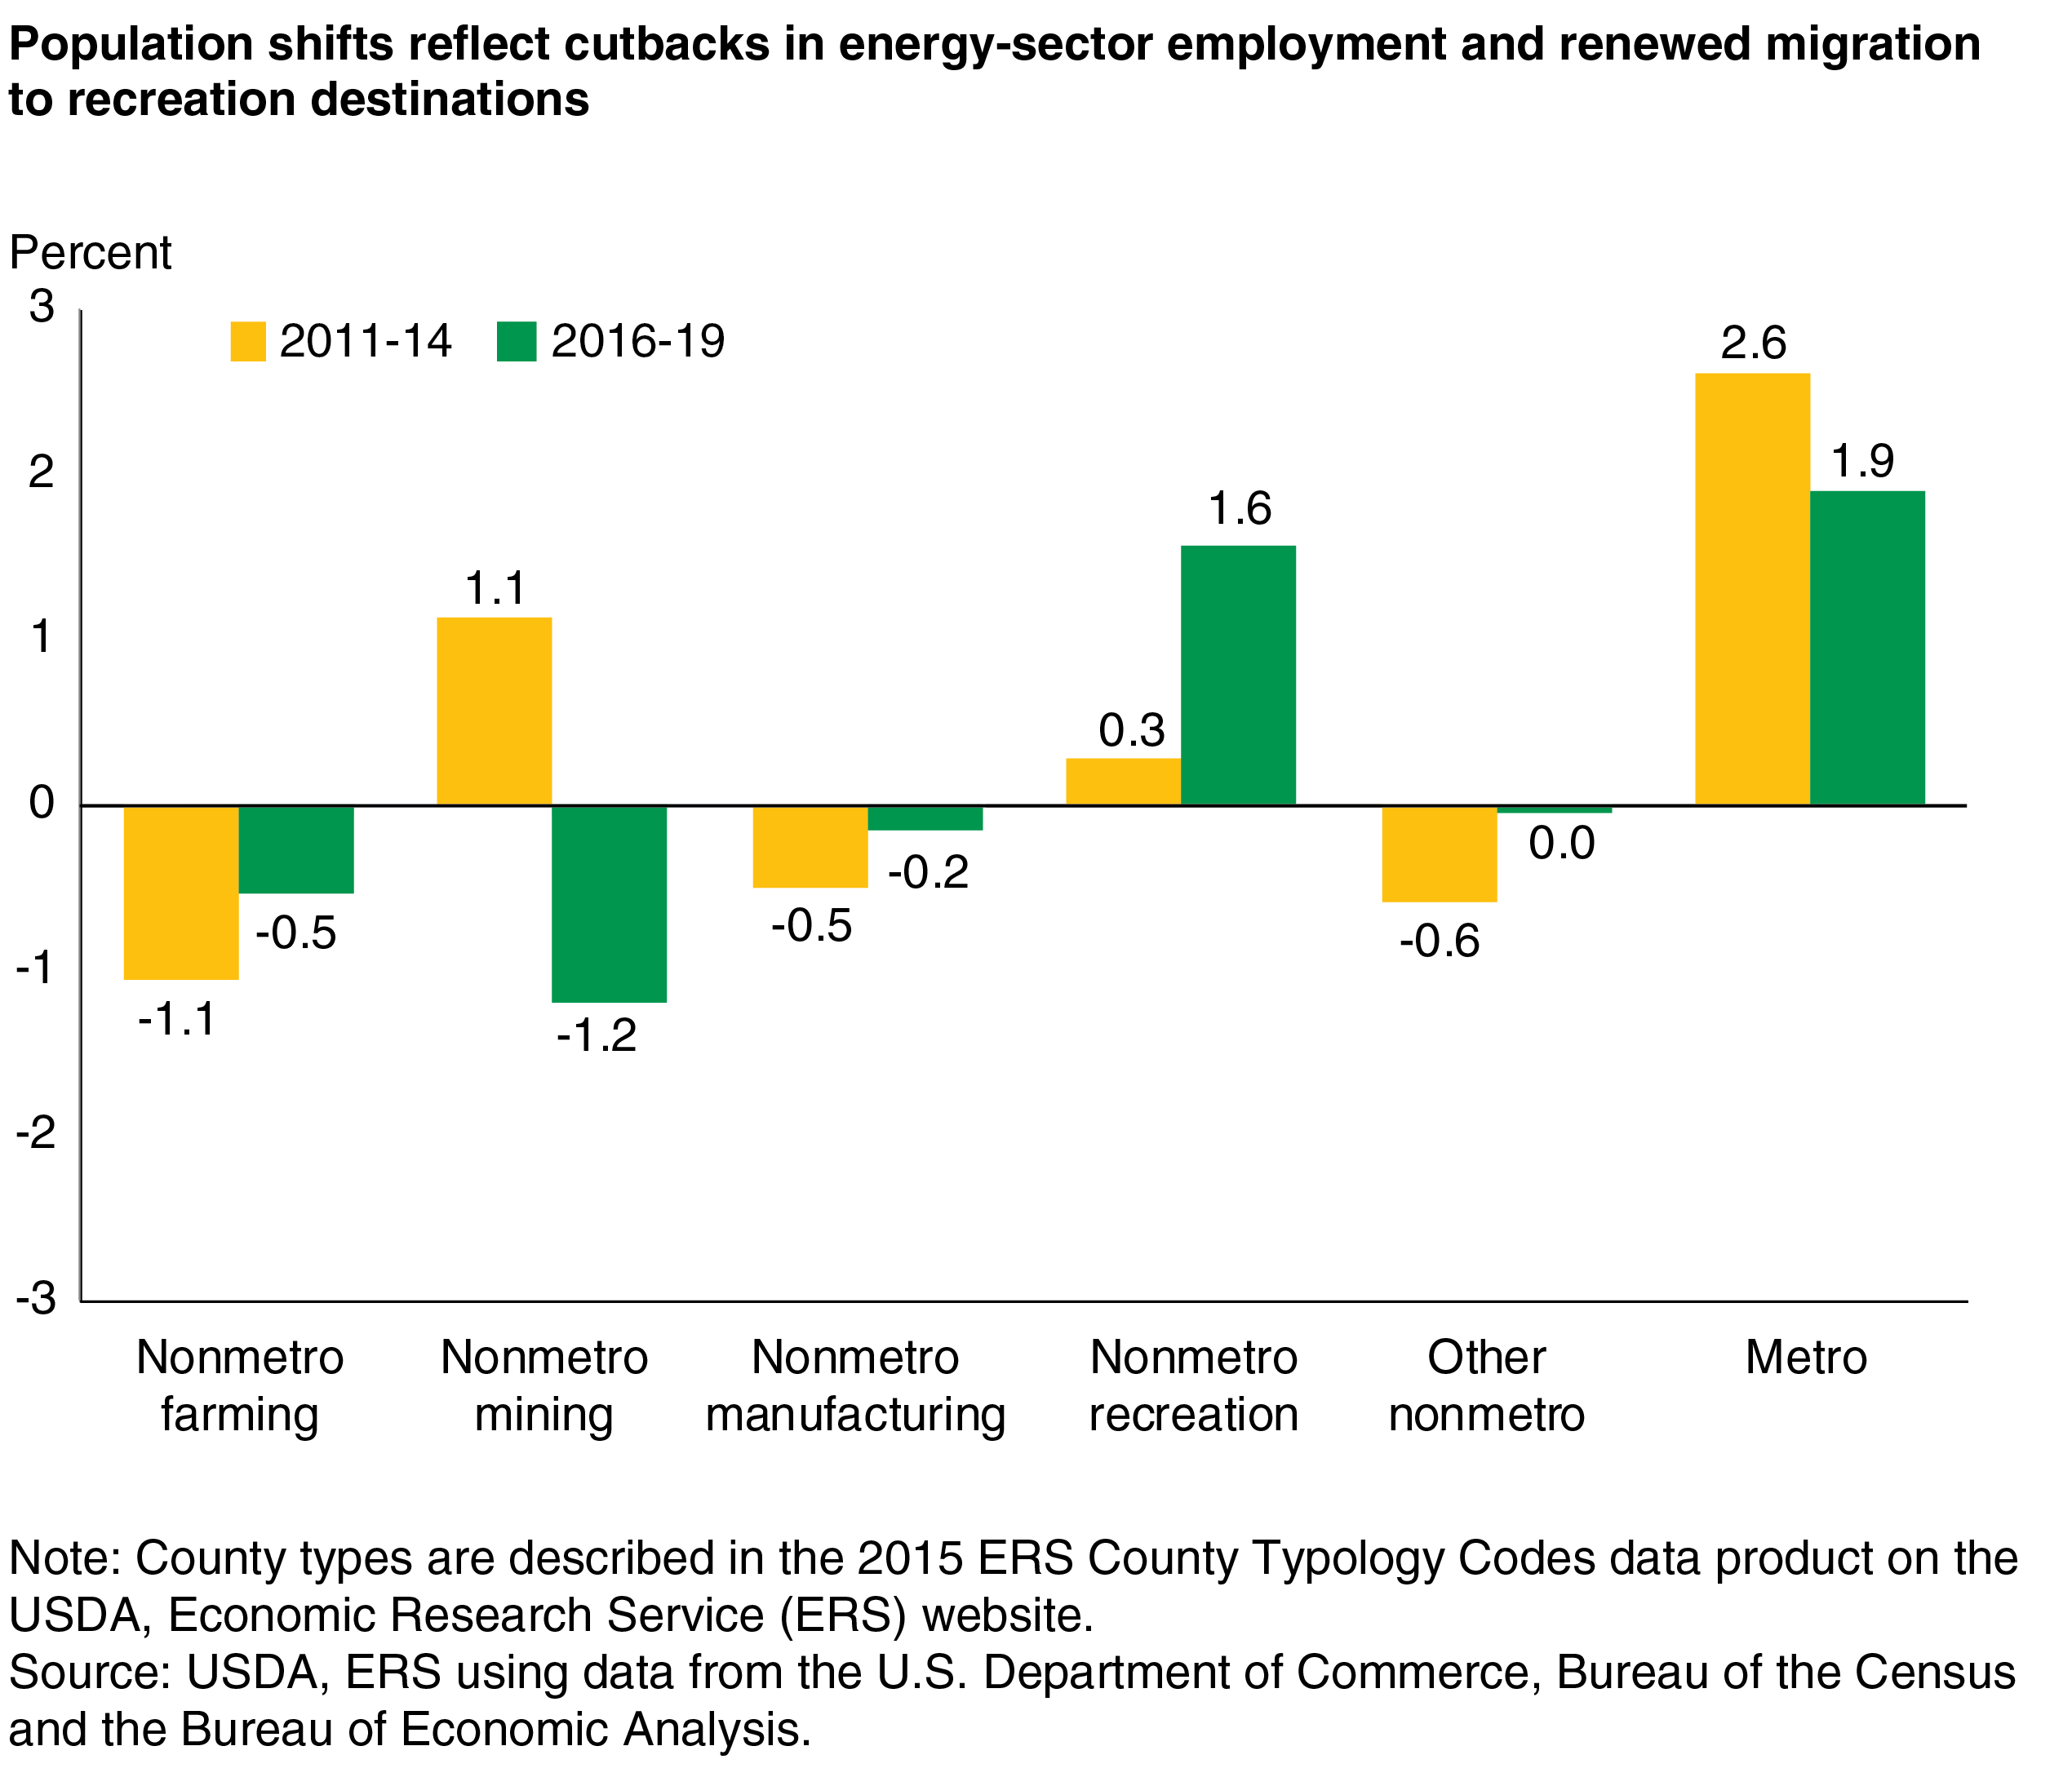
The return to high population growth primarily based on metro proximity, attractive scenery, and recreation potential, as well as the boom-and-bust trend in the energy sector, can be seen in the following two graphs that use different ERS county typologies, created in order to provide policy-relevant information about diverse county conditions. These county typology codes capture a range of economic and social characteristics. They show that suburban and exurban population growth contracted considerably in the wake of the Great Recession—for the first time since World War II—affecting not only metro outlying counties but nonmetro counties adjacent to metro areas as well. Both types of counties rebounded in the second half of the 2010s, with metro outlying counties once more growing faster than metro central counties (3.3 percent compared with 1.8 percent in 2016-19) and nonmetro adjacent areas switching from decline to growth. More remote nonmetro areas, regardless of urban size, continued to lose population.
Counties with recreation-based employment, which had been the among fastest-growing areas of nonmetro America before the Great Recession, dropped to just 0.3 percent growth during 2011-14. They strongly rebounded in recent years and once again lead among economic county types, growing by 1.6 percent during 2016-19. Along with farming-dependent counties that declined by 1.1 percent earlier in the decade, manufacturing counties continued to lose population in recent years but at a smaller rate of decline. Nonmetro mining counties grew by 1.1 percent during 2011-14, but more recently declined by 1.2 percent, in line with recent cutbacks in energy-sector employment.
County population estimates used in this article are based on the 2010 decennial census, projected forward. They are subject to revisions based on 2020 census results, more so for years closer to the end of the decade. The impact of this year’s shelter-in-place restrictions and mortality associated with COVID-19 is not reflected in the 2019 Census population estimates, the latest available, or this article. Increasing mortality has the potential to be the most painful and direct impact of the virus on rural communities, contributing to the ongoing decline in population growth from natural change.
This article is drawn from:
- Population & Migration. (n.d.). U.S. Department of Agriculture, Economic Research Service.
You may also like:
- Atlas of Rural and Small-Town America. (n.d.). U.S. Department of Agriculture, Economic Research Service.
- Pender, J., Hertz, T., Cromartie, J. & Farrigan, T. (2019). Rural America at a Glance, 2019 Edition. U.S. Department of Agriculture, Economic Research Service. EIB-212.


