ERS research in this topic area focuses on the economic, social, spatial, temporal, and demographic factors that affect the poverty status of rural residents. (Food and nutrition assistance topics are covered in depth elsewhere on the ERS website.)
Subtopics include:
- Poverty over time, including a look at metro/nonmetro poverty rates and deep poverty.
- The geography of poverty, including analysis of poverty in a regional context, maps of the incidence/severity of poverty, and the geographic persistence of poverty over decades.
- The demographics of poverty, including the breakdown of rural/urban poverty by race, family structure, and age.
- Background information and definitions (a note about data sources, region definitions, and how poverty is defined).
In addition to this topic page, ERS provides annual statistics in its County-level Datasets: Poverty, and State-level (rural/urban) summaries in its State Fact Sheets. A summary of rural issues is found in the Rural America at a Glance series, which is updated annually in the fall. See the latest report in the series:
- Rural America at a Glance: 2024 Edition (EIB-282, November 2024)
Poverty Over Time
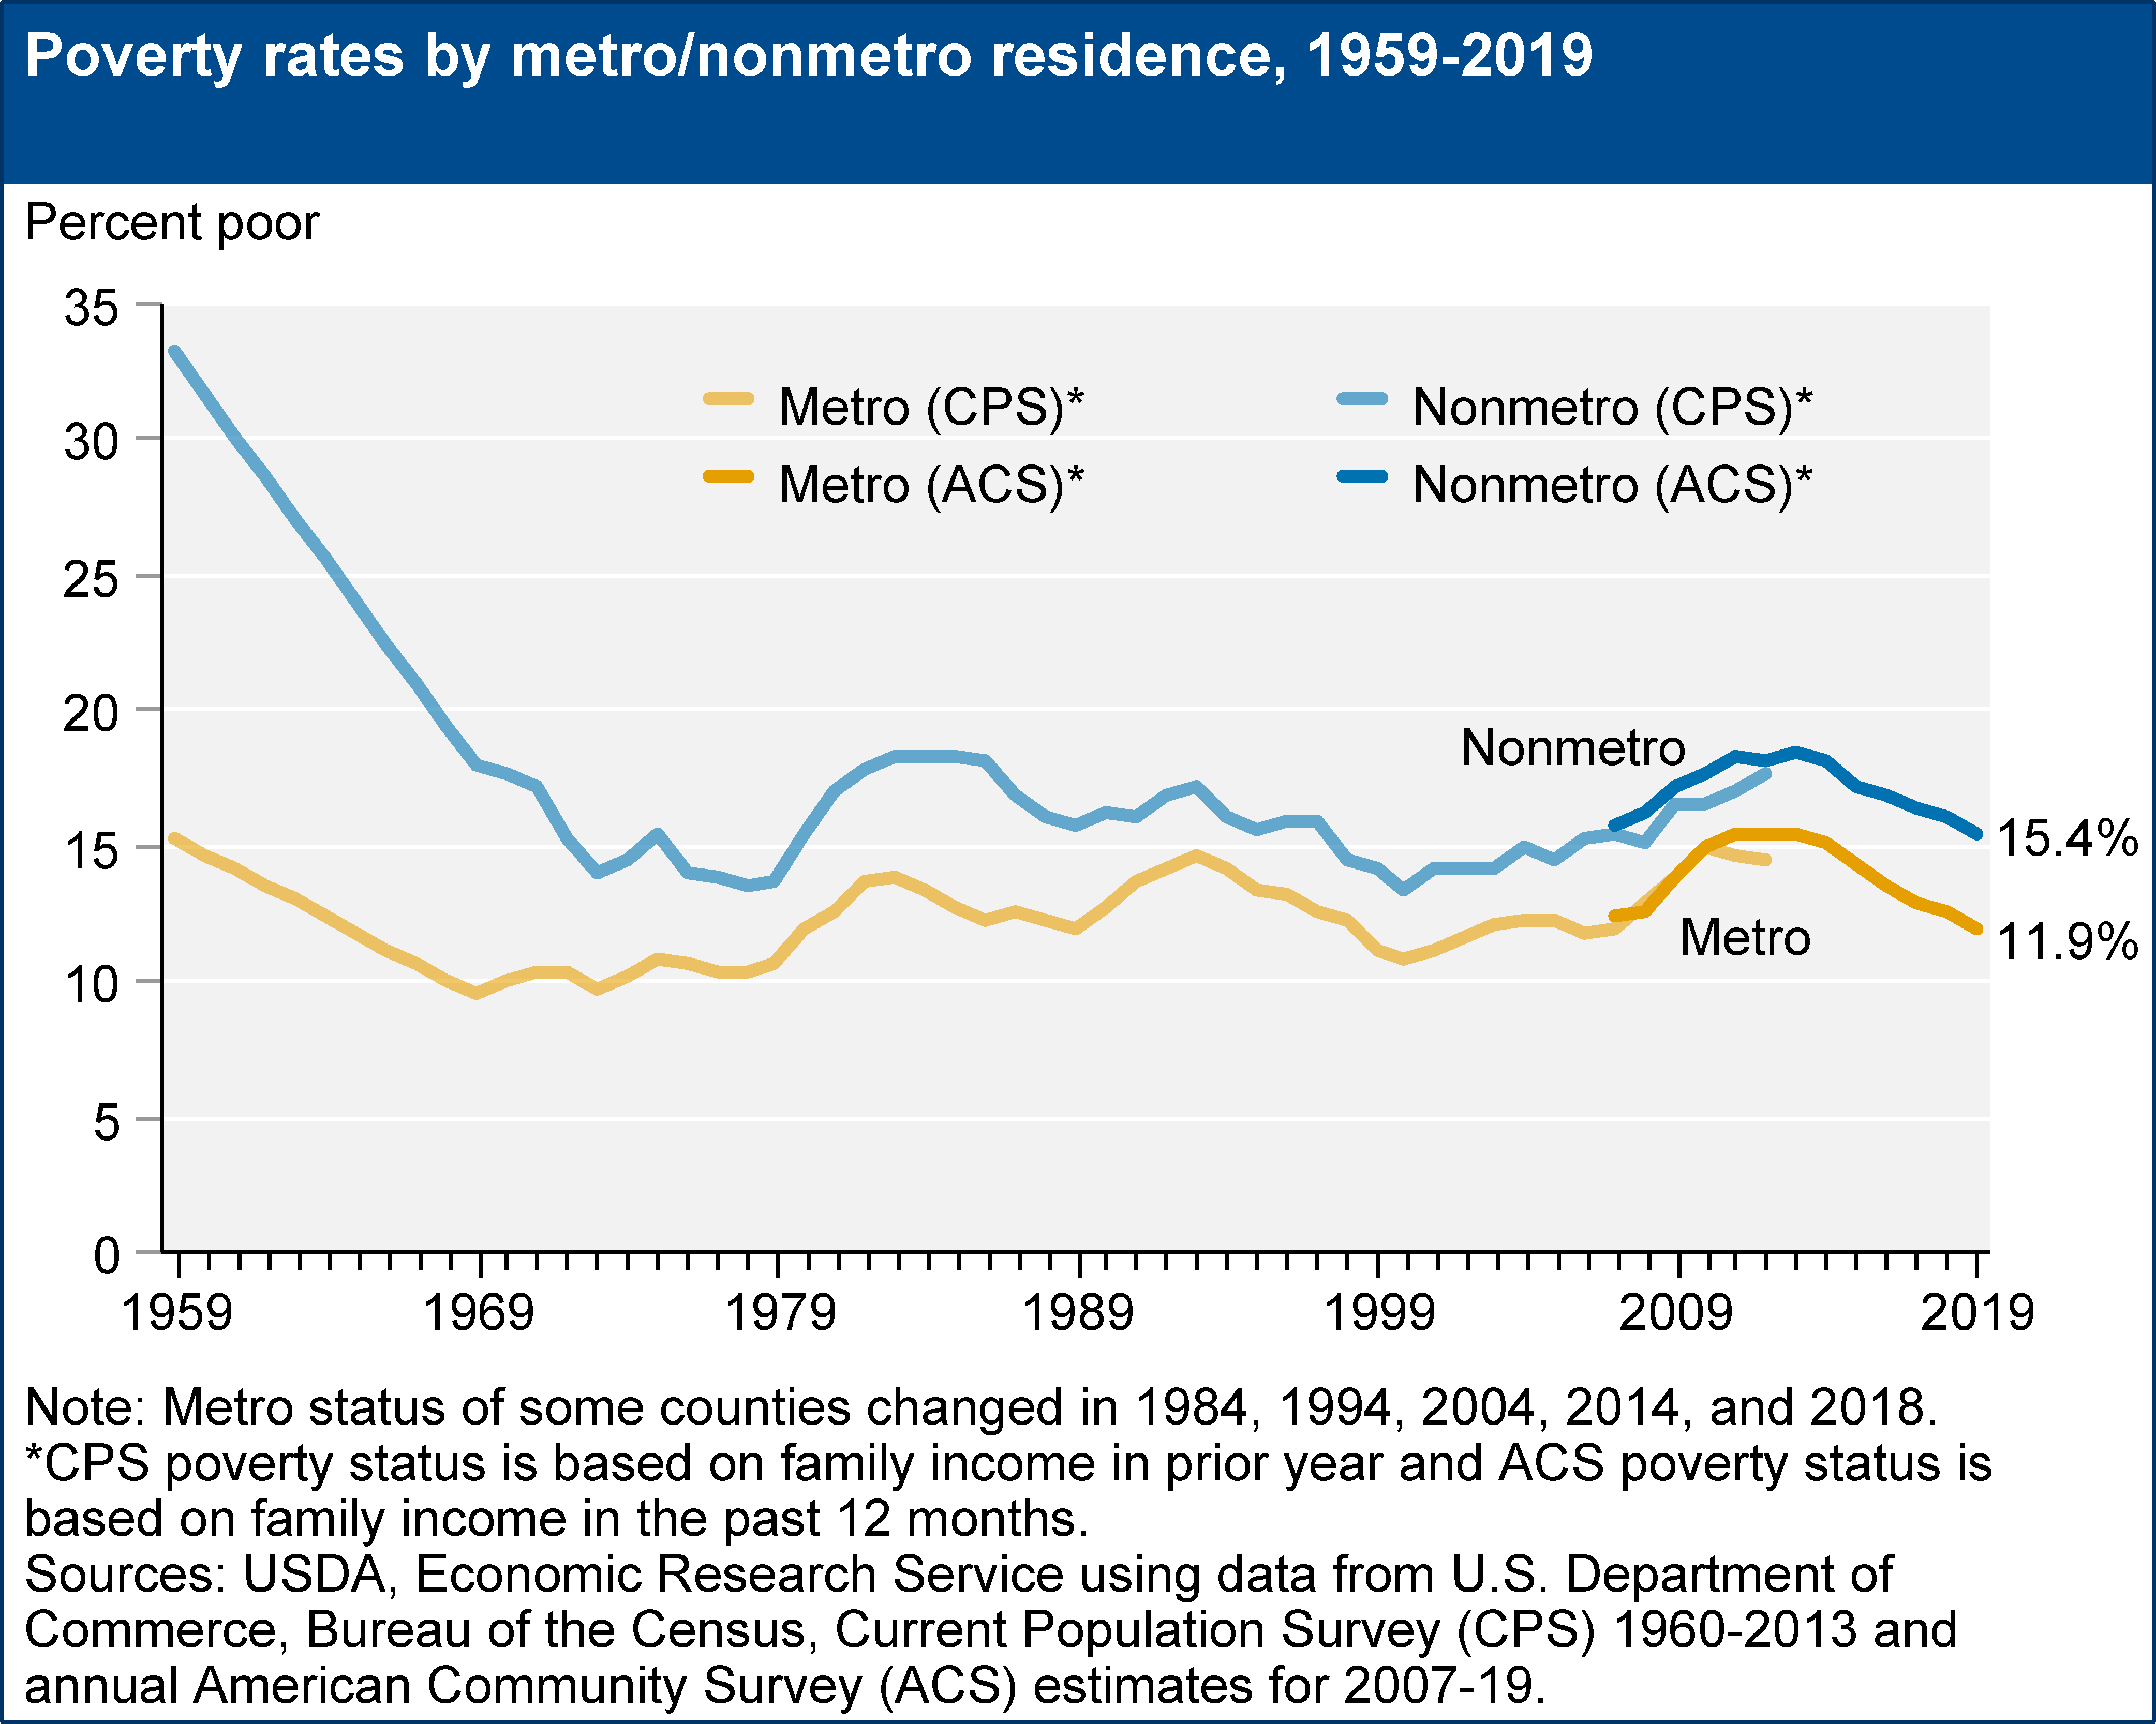
According to the U.S. Census Bureau's Annual Social and Economic Supplement to the Current Population Survey (CPS) data estimates, the higher incidence of nonmetro poverty relative to metro poverty has existed since the 1960s when poverty rates were first officially recorded. Over time, the difference between nonmetro and metro poverty rates has generally narrowed, falling from an average difference of 4.5 percentage points in the 1980s to an average gap of about 3.1 percentage points over the last 10 years.
According to the most recent estimates from the 2019 American Community Survey (ACS), the nonmetro poverty rate was 15.4 percent in 2019, compared with 11.9 percent for metro areas. Nonmetro poverty fell 3.0 percentage points from 2013, when it reached its 30-year peak of 18.4 percent. Metro poverty rates declined at a higher rate between 2013 and 2019, causing an increase in the metro-nonmetro poverty rate gap, which was 3.5 percentage points in 2019. See A Note About Data Sources and What is the Impact of Methodology? for further explanation of ACS and CPS poverty estimate differences.
Note: Due to the impact of the COVID-19 pandemic on the American Community Survey, the Census Bureau did not release official ACS 1-year estimates for 2020, which were anticipated in September 2021. The Census Bureau has indicated it will provide 2020 ACS 1-year experimental estimates for a limited number of tables and geographies likely in November 2021. The impact of the pandemic on the ACS 5-year estimates for 2016-20—tentatively to be released in December 2021—is still being evaluated by the Census Bureau. Since the data source for the rest of this topic page is the ACS (1-year and 5-year estimates), ERS is unable to update the content to include 2020 poverty rates at this time. The next update will be determined following review of the ACS 1-year experimental estimates (2020) and the Census Bureau’s ACS 5-year estimates (2016-20) pandemic impact analysis.
The Current Population Survey (CPS) serves as an alternative source for aggregate nonmetro and metro poverty rates, but CPS and ACS estimates are not directly comparable (see differences between ACS and CPS Fact Sheet). We provide the following reference to the latest published CPS poverty rates.
According to the U.S. Census report, Income and Poverty in the United States, 2020:
"Inside MSAs ["metro" areas], the poverty rate in 2020 was 11.0 percent, up from 10.0 percent in 2019. The number of people in poverty inside MSAs also increased from 28.4 million in 2019 to 31.3 million in 2020. Among those living outside MSAs ["nonmetro" areas], 14.1 percent, or 5.9 million, were in poverty in 2020. Both the rate and number of individuals in poverty among those living outside MSAs were not statistically different from 2019." (The poverty rate in nonmetro areas in 2019 was reported as 13.3 percent (5.6 million people).) The difference between the nonmetro and metro poverty rates in 2020 (14.1—11.0 = 3.1 percentage points) was statistically different.
Download chart image | Chart data
Geography of Poverty
In the United States, people living in poverty tend to be clustered in certain regions, counties, and neighborhoods rather than being spread evenly across the Nation. Research has shown that the poor living in areas where poverty is prevalent face impediments beyond those of their individual circumstances. Concentrated poverty contributes to poor housing and health conditions, higher crime and school dropout rates, and employment dislocations. As a result, economic conditions in very poor areas can create limited opportunities for poor residents that become self-perpetuating. The 2015-19 ACS is used here to examine poverty at the regional and county levels; see A Note About Data Sources for more information.
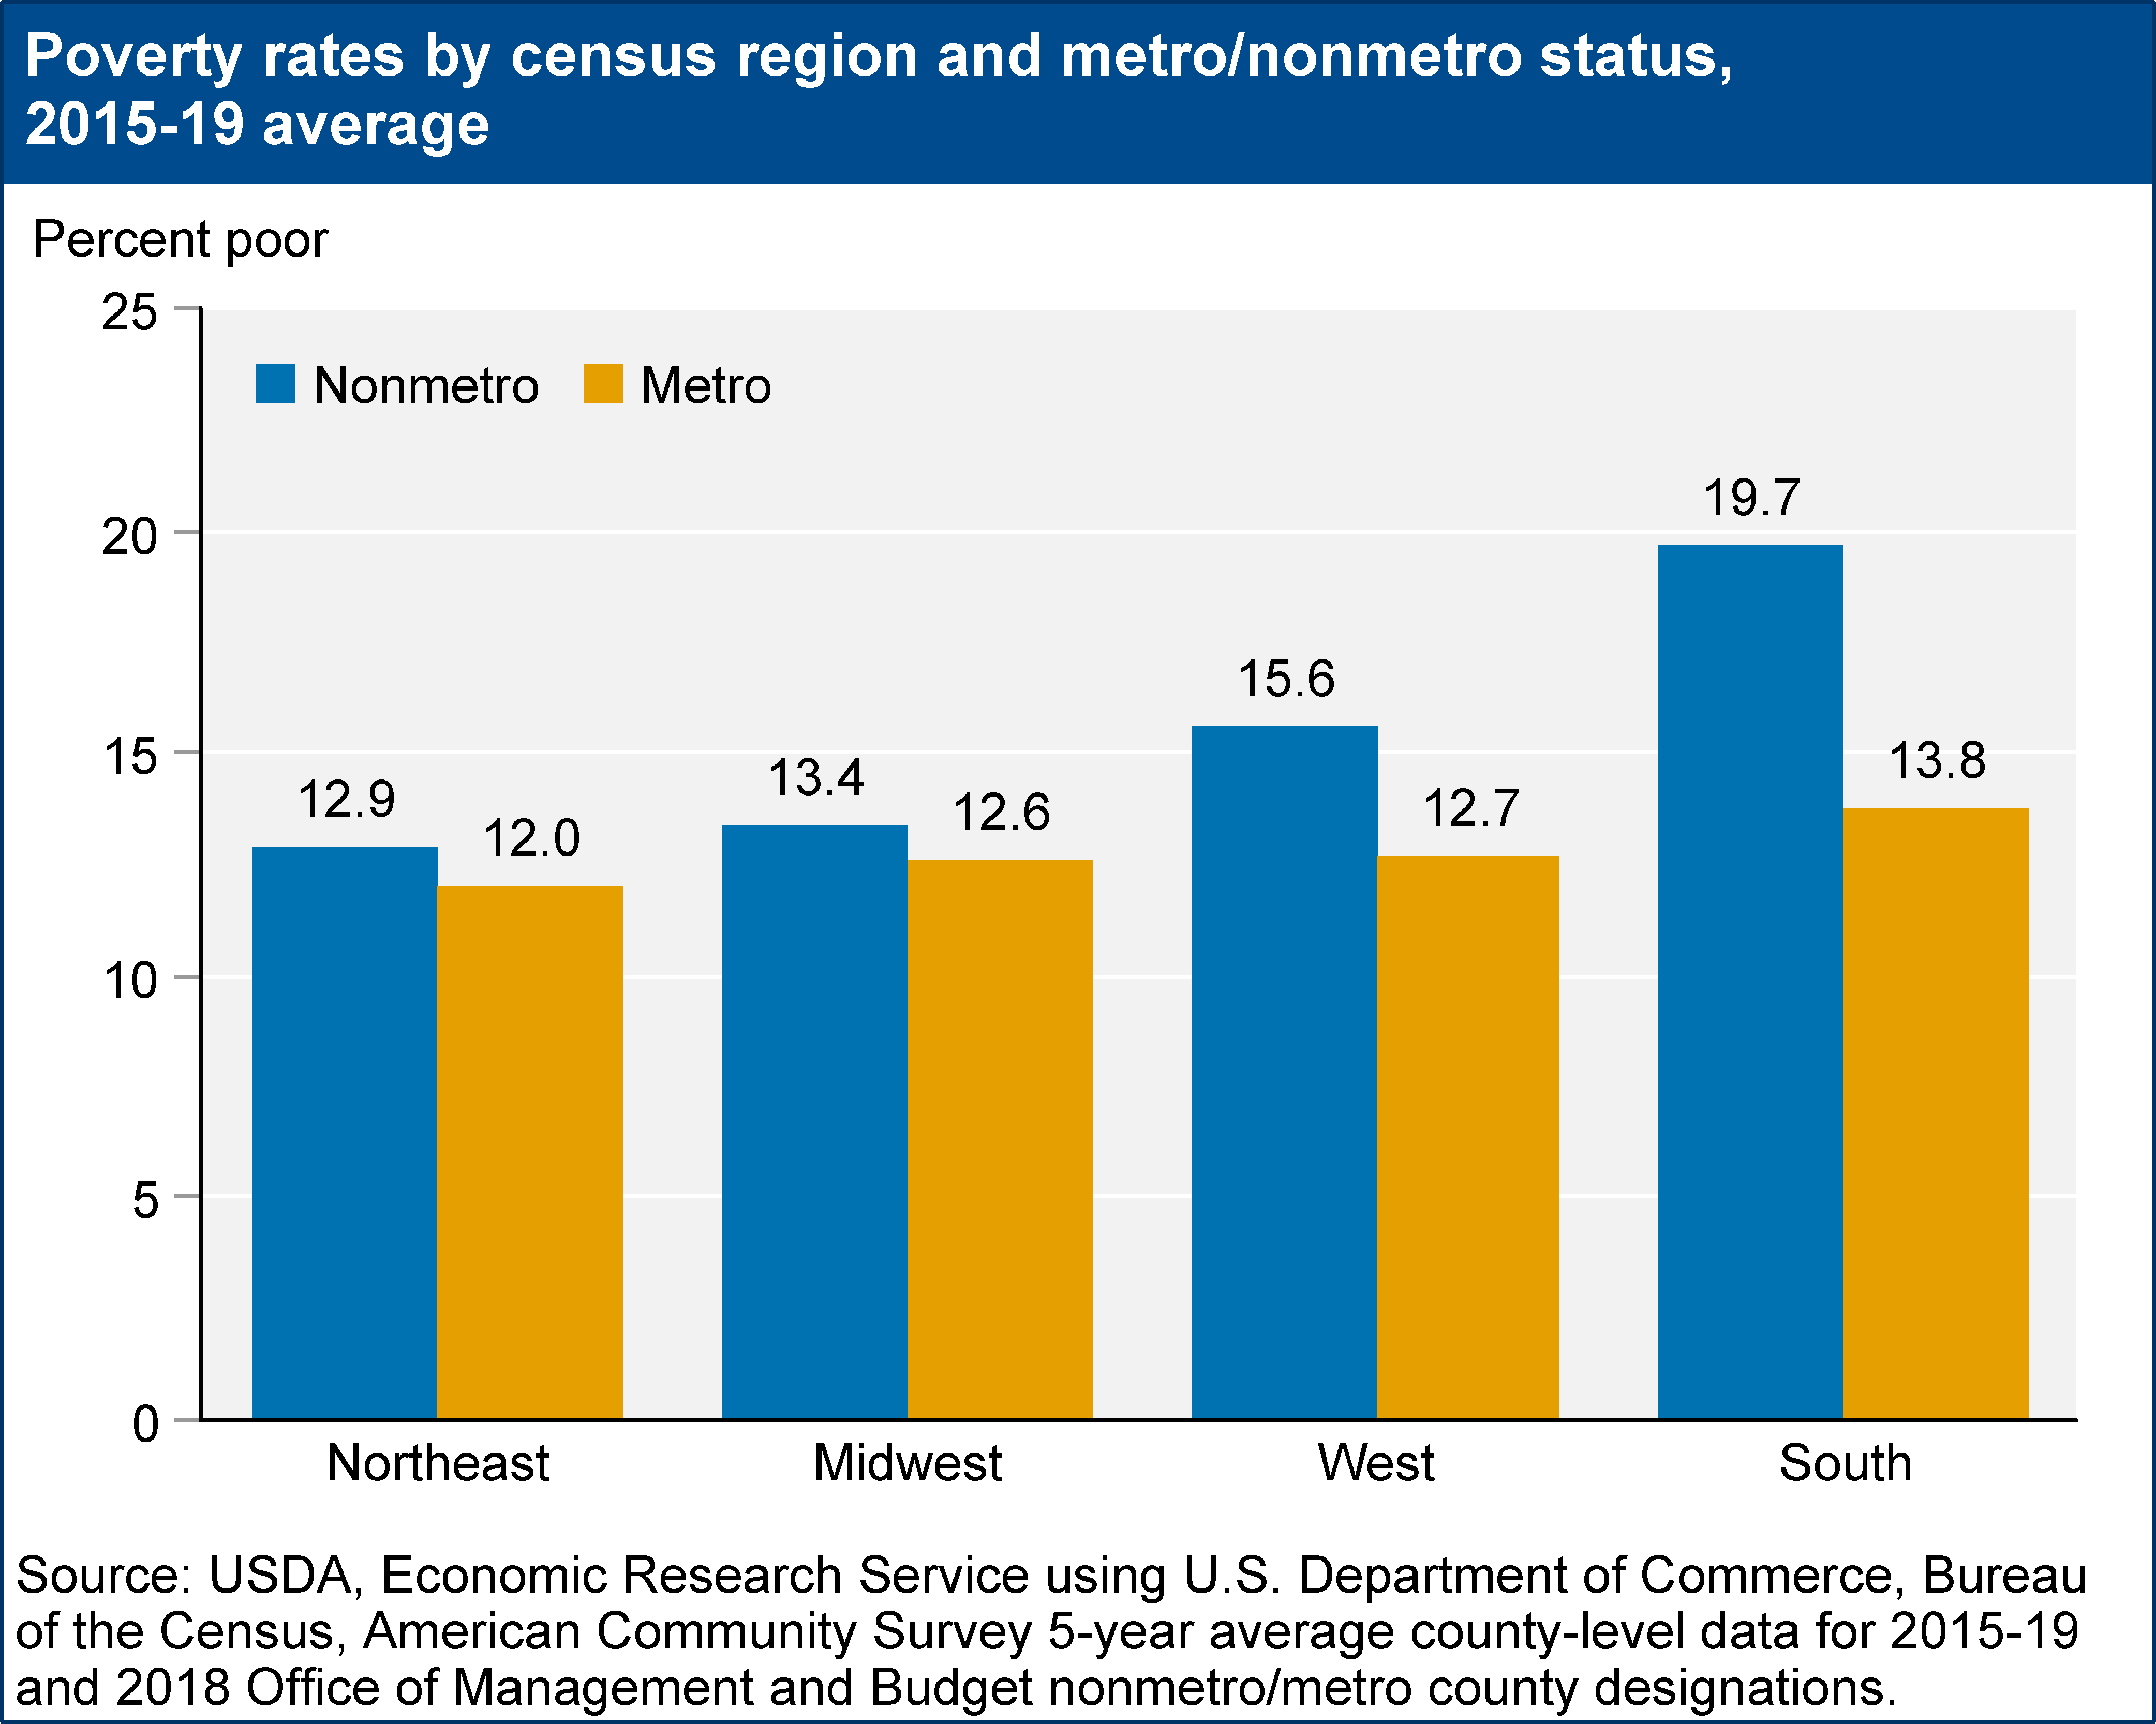
While the overall rate of poverty is higher in nonmetro counties than in metro, the difference between nonmetro/metro poverty rates varies significantly across Census regions (see more on the Region Definitions discussed here below). The nonmetro/metro poverty rate gap for the South has historically been the largest. In 2015-19, the South had a nonmetro poverty rate of 19.7 percent—nearly 6 percentage points higher than in the region's metro areas. Regional poverty rates for nonmetro and metro areas were most alike in the Midwest and the Northeast in 2015-19.
Download chart image | Chart data
Nonmetro counties with a high incidence of poverty are mainly concentrated in the South. Those with the most severe poverty are found in poor areas of the Southeast, including the Mississippi Delta and Appalachia, as well as on Native American lands. Pockets of high poverty are increasingly found in other regions, such as nonmetro areas of the Southwest and northern sections of the Midwest. Deindustrialization since the 1980s contributed to the spread of poverty in the Midwest and the Northeast. Another factor was rapid growth in Hispanic populations over the 1990s and 2000s, particularly in California, Nevada, Arizona, Colorado, North Carolina, and Georgia. This group tends to be poorer than non-Hispanic Whites.
In 2019, 21.1 percent of nonmetro children in the United States were poor, compared to 16.1 percent of metro children. At the county level, on average over 2015-19, there were 138 counties in the United States with child poverty rates of 40 percent or higher. Only eleven of them were metro counties. The remaining 127 were nonmetro counties, primarily in the South (84.3 percent) with concentrations in Mississippi, Georgia, Kentucky, and Texas—where child poverty rates have been persistently high, particularly among the Black or African American population. However, many of the nonmetro counties with extreme child poverty (38 counties with a child poverty rate of 50 percent or higher) were in the Midwest, all in South Dakota where native Americans make up the majority of the poverty population. The nonmetro counties with the highest child poverty rates were Claiborne County, MS (72.0 percent), East Carroll Parish, LA (66.4 percent), Mellette County, SD (65.7 percent), Todd County, SD (64.0 percent), and Jackson County, SD (62.3 percent).
An important dimension of poverty is its persistence over time. An area that has a high level of poverty this year, but not next year, is likely better off than an area that has a high level of poverty in both years. To shed light on this aspect of poverty, ERS has defined counties as being persistently poor if 20 percent or more of their populations were living in poverty based on the 1980, 1990, and 2000 decennial censuses and 2007-11 ACS 5-year estimates (see the ERS County Typology Codes, 2015 Edition). Using this definition, there are 353 persistently poor counties in the United States (comprising 11.2 percent of all U.S. counties). The large majority (301 or 85.3 percent) of the persistent-poverty counties are nonmetro, accounting for 15.2 percent of all nonmetro counties. Persistent poverty also demonstrates a strong regional pattern, with nearly 84 percent of persistent-poverty counties in the South, comprising more than 20 percent of all counties in the region. Most of the 301 nonmetro persistent poverty counties (267 or 88.7 percent) also had high poverty (a rate of 20 percent or higher) on average for 2015-19, suggesting that the geography of nonmetro persistent poverty changed little over the last decade.
ERS has also defined persistent child poverty counties using a similar methodology; see the ERS typology section on Persistent Child Poverty. ERS provides a file listing the persistent-poverty/persistent-child-poverty counties as part of the County Typology Codes data product.
Poverty Demographics
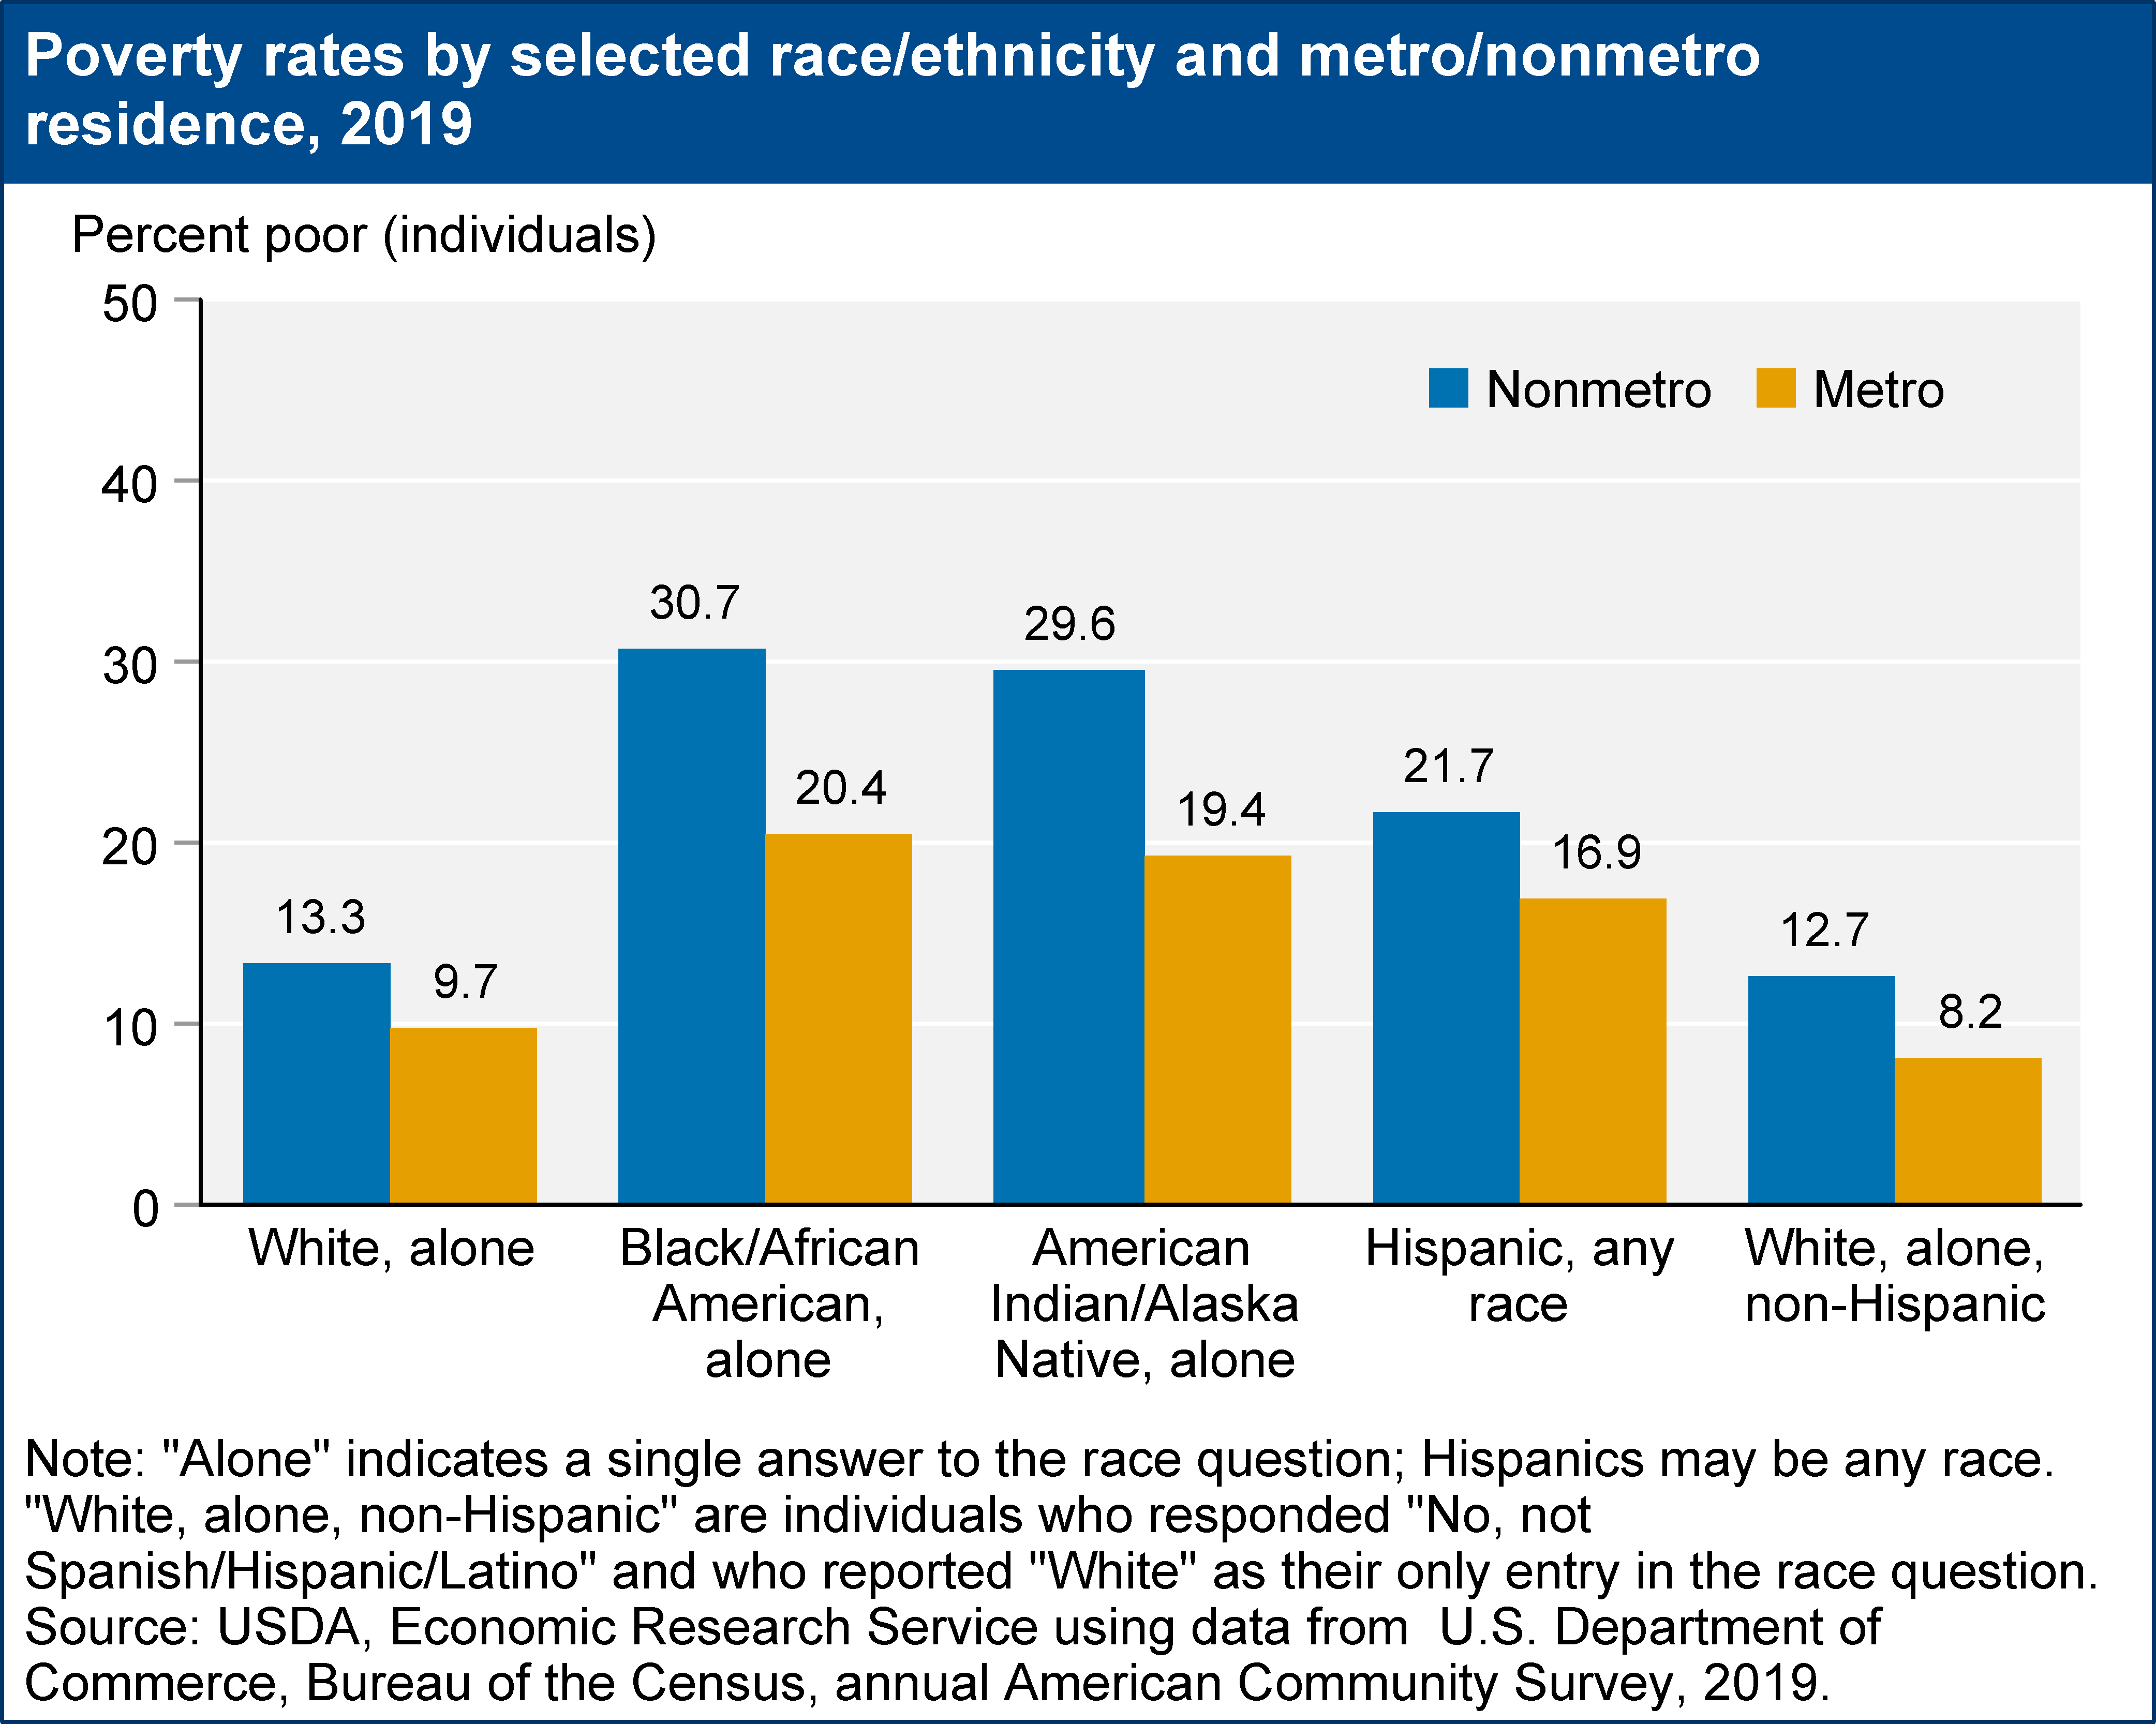
Areas with a high incidence of poverty often reflect the low income of their racial/ethnic minorities. Nonmetro Blacks/African Americans had the highest incidence of poverty in 2019 (30.7 percent), while nonmetro American Indians/Alaska Natives had the second highest rate (29.6 percent). The poverty rate for nonmetro Whites in 2019 was less than half as much (13.3 percent) of both of those other groups. Nonmetro Hispanics had the third highest poverty rate of any individual race or ethnicity—21.7 percent.
Download chart image | Chart data
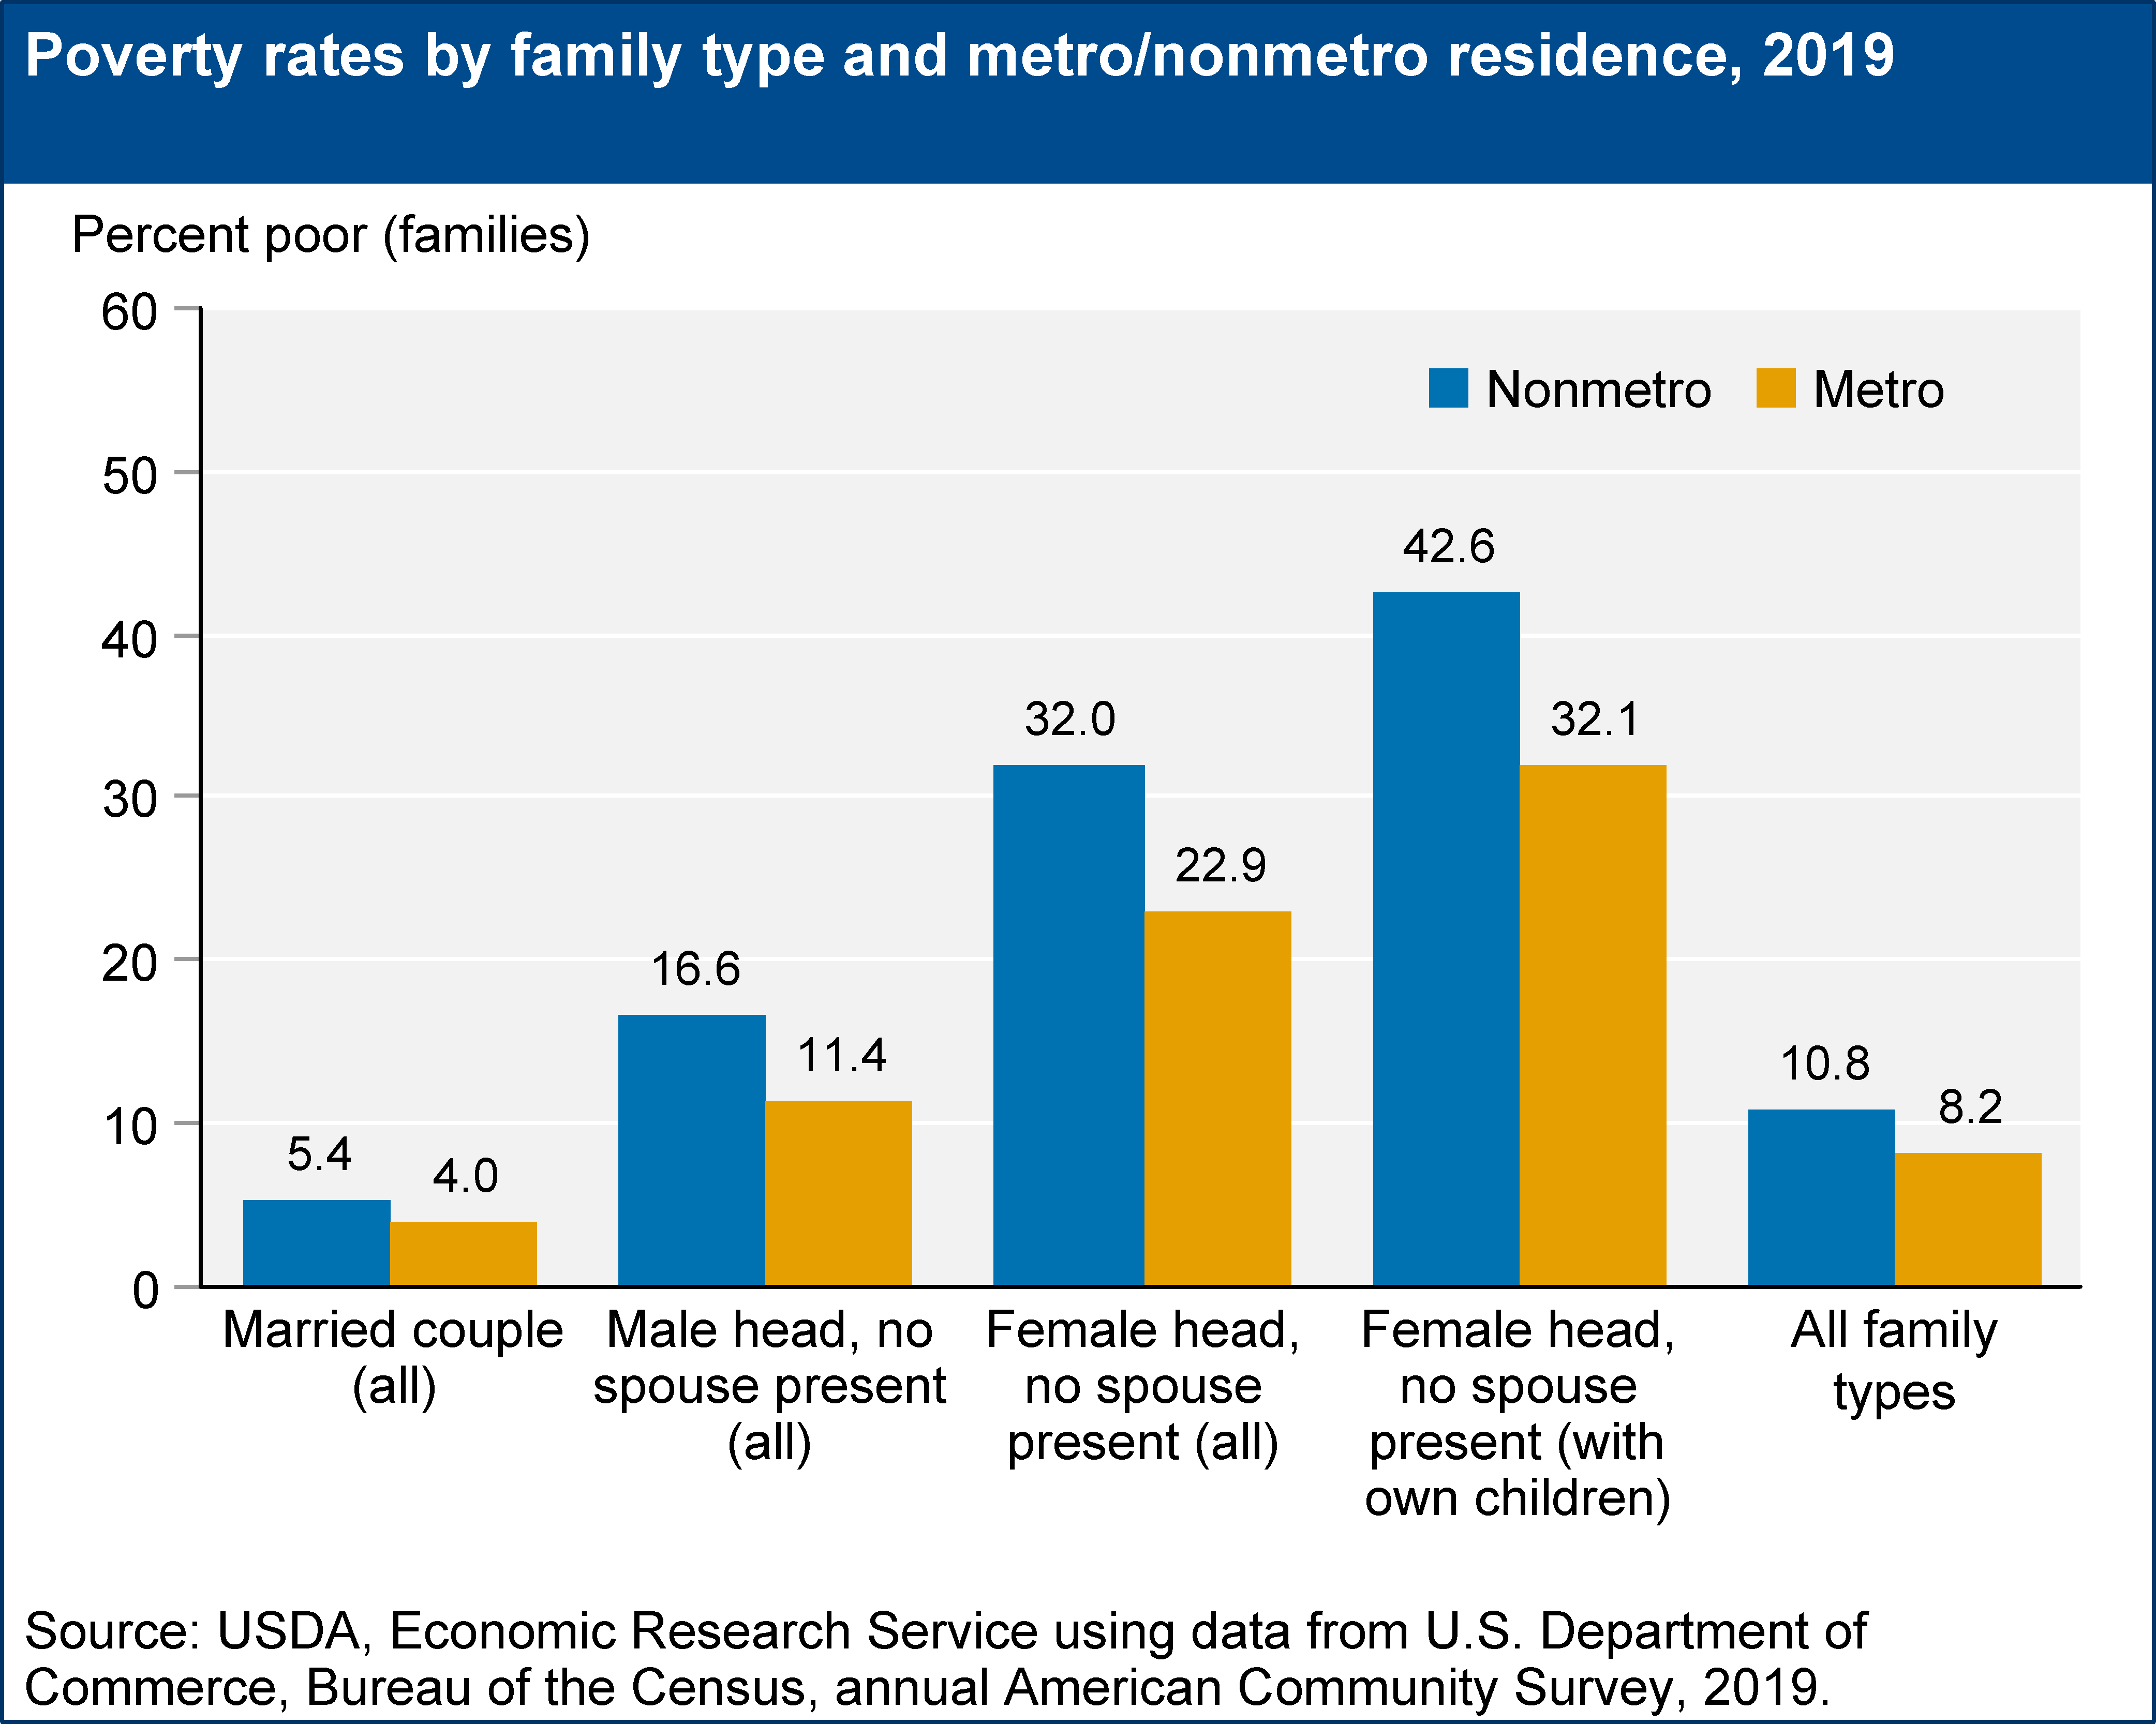
Family type has a significant bearing on poverty. Families headed by two adults are likely to have more sources of income than single-adult families with children and are therefore less likely to be poor. In 2019, nearly one-third of all nonmetro families headed by a female with no spouse present were poor (32.0 percent) and the poverty rate for those among that group with related children was 10 percentage points higher than the total (42.6 percent). In contrast, 5.4 percent of nonmetro married couple families were poor in 2019. Poverty rates by family type also reveal large metro-nonmetro differences for single-adult families. In 2019, the poverty rate was more than 9 percentage points higher for nonmetro families headed by females (no spouse present) in general, and more than 10 percentage points higher for those with related children than for the same types of metro families.
Download chart image | Chart data
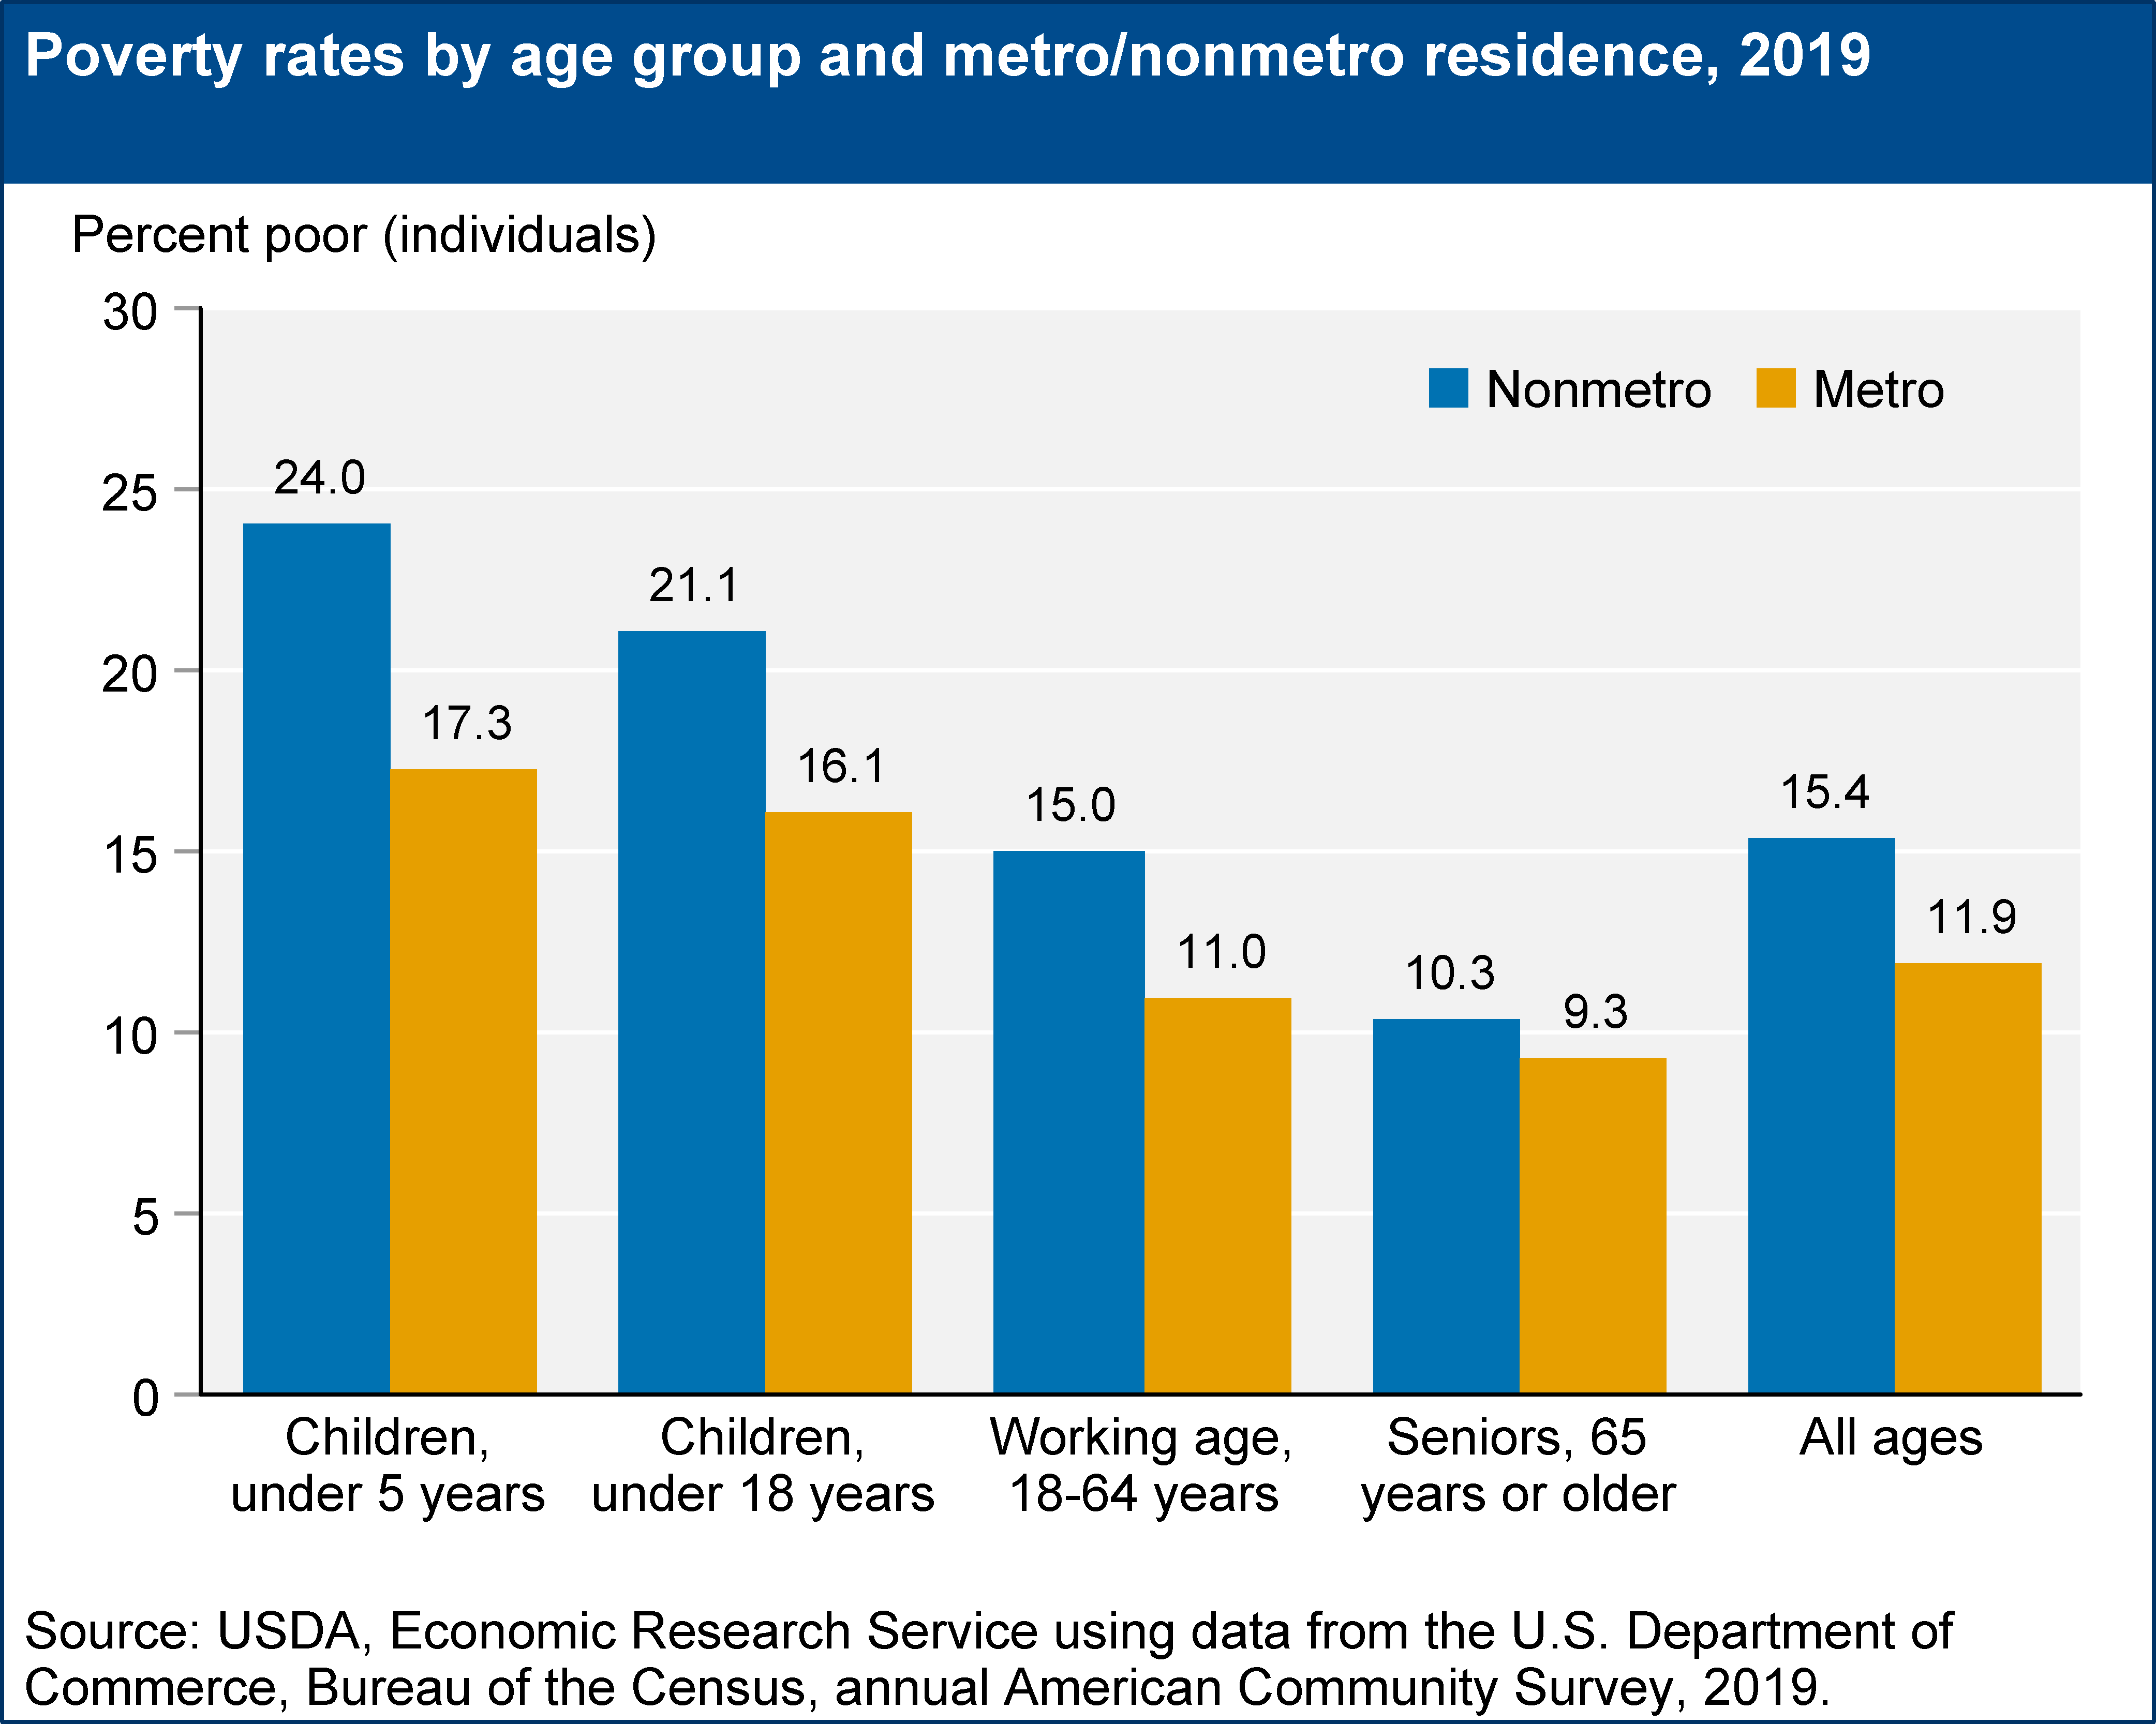
Poverty rates also differ by age group. In 2019, the nonmetro/metro difference was greatest for children under the age of 5 (24.0 percent nonmetro and 17.3 percent metro). Overall child poverty rates (under age 18) were 21.1 percent in nonmetro areas and 16.1 percent in metro areas. In contrast, the poverty rates for senior adults (age 65 and older) were more similar at 10.3 percent in nonmetro areas and 9.3 percent in metro areas. Similarly, working age adults (age 18-64) had much lower poverty rates (15.0 percent) than did children in nonmetro areas, but higher rates than did working age adults in metro areas (11.0 percent) in 2019.
Download chart image | Chart data
These rates do not indicate how long individuals live in poverty. Some families cycle in and out of poverty over time, while others are persistently poor. Persistent poverty among children is of concern as the cumulative effect of being poor may lead to poor health, limited education, and other negative outcomes. Also, research suggests that the more time a child spends in poverty or living in a high-poverty area, particularly those with concentrations of racial and ethnic minorities, the greater the chance of being poor as an adult. See these ERS publications for more on this topic: Rural America At A Glance, 2009 Edition ("Child Poverty Persistent and Widespread") and Rural Children At A Glance.
A Note About Data Sources
Official Federal poverty statistics come from the U.S. Census Bureau’s Annual Social and Economic Supplement (ASEC) to the Current Population Survey (CPS). Individuals or families are defined as poor if their annual pretax cash income falls below a dollar amount, or poverty threshold, that is determined by the Census Bureau each year. For example, an unrelated individual with an annual cash income below $13,011 was defined as poor in 2019. That same person would have been considered poor in 2018 with an annual cash income below $12,784. Note that poverty thresholds are determined for the Nation as a whole, and do not vary by geographic region, metropolitan area, or metro/nonmetro location. That is, poverty thresholds do not attempt to account for spatial differences in the cost of living. (See How Is Poverty Defined? for more about definitions and income thresholds used in determining poverty rates.)
To produce subnational and subpopulation poverty estimates, the Census Bureau now recommends using the American Community Survey (ACS), which has a much larger sample size than the CPS. The ACS, however, does not allow for the same historical perspective as the CPS. Therefore, we begin the ACS series in 2007 and continue to provide annual CPS poverty rates up to 2012. The two surveys are not directly comparable, though, given that the ACS design differs from the CPS in a variety of ways and may produce different poverty estimates. For example, in 2012 the U.S. poverty rate was estimated to be 15.9 percent based on the ACS, compared to 15.0 percent based on the CPS. Poverty estimates for the population living in nonmetropolitan (nonmetro) areas in 2012 were 18.2 percent for the ACS and 17.7 percent for the CPS. The metropolitan (metro) area poverty rates were 15.5 percent (ACS) and 14.5 percent (CPS). The ACS poverty rates for the most recent year (2018) were 13.1 percent for the United States, 16.1 percent nonmetro, and 12.6 percent metro. See the Census Bureau's Fact Sheet: Differences Between the American Community Survey (ACS) and the Annual Social and Economic Supplement to the Current Population Survey (CPS ASEC) and "Poverty and Deep Poverty Increasing in Rural America" (Amber Waves, March 2014) for more information.
For regional and county-level analysis, we use a 5-year average of data. The ACS uses a rolling sample of U.S. housing units (250,000 monthly) to provide basic population characteristics annually for areas with populations of at least 65,000 people. ACS currently accumulates samples over 5-year intervals to produce estimates for areas with smaller populations; only the 5-year average ACS provides coverage for all counties in the United States. The 2015-19 ACS is used here to examine poverty at the regional and county levels.
Region Definitions
Definitions of the 4 broad Census regions (Northeast, Midwest, West, and South) are available from the Census website. Other economic/cultural regions discussed in the text are officially defined by other Federal entities. The Southeast is a Bureau of Economic Analysis economic region. The Mississippi Delta is defined by the Delta Regional Authority. Appalachia is defined by the Appalachian Regional Commission. "Native American lands" refer to areas defined by the Native American Reservation System, also called Indian Lands of Federally Recognized Tribes, and are identified by the Bureau of Indian Affairs.
How Is Poverty Defined?
In the United States, being in poverty is officially defined as having an income below a federally determined poverty threshold. Poverty thresholds were developed in the 1960s and are adjusted annually to account for inflation. They represent the Federal Government’s estimate of the point below which a family of a given size has cash income insufficient to meet basic needs. Any family/individual with total income less than an amount deemed to be sufficient to purchase food, shelter, clothing, and other essential goods and services is classified as poor. For details, see "How the Census Bureau Measures Poverty." The amount of income necessary to purchase these basic needs is set by the Office of Management and Budget (OMB). The 2019 poverty line was $13,300 for an individual under age 65 and $12,261 for those 65 or older. The poverty line for a three-person family with one child and two adults was $20,578 in 2019; for a five-person family with two adults and three children the poverty line was $30,510. For a complete list of poverty lines by size of family and number of children, see the U.S. Census Bureau's tables of Poverty Thresholds.) Income includes cash income (pretax income and cash welfare assistance), but excludes in-kind welfare assistance, such as Supplemental Nutrition Assistance Program (SNAP) benefits and Medicaid.
Although metro-nonmetro comparisons of poverty rates are useful for determining areas where poverty is concentrated, some measurement issues are worth bearing in mind. As one example, U.S. poverty rates do not make any adjustments for differences in cost of living across areas. If the cost of purchasing basic needs is lower in nonmetro areas, then the nonmetro poverty rate would overstate the actual level of poverty experienced by nonmetro residents. The effect of these differences can go in either direction. For example, transportation to work in nonmetro areas may be much more expensive than in metro areas where access to public transit is greater. Housing may be less expensive in nonmetro areas than in metro areas, but the quality of housing may also be lower with a higher rate of substandard housing units. Similarly, the measure of poverty does not account for access to other "public goods" such as health care, schooling, or communication networks, or "public bads" such as noise and air pollution, which also differ systematically across metro and nonmetro areas.
An alternative to the official poverty measure, which account for some of the metro-nonmetro comparison issues, is the Supplemental Poverty Measure (SPM). The SPM is a more complex statistic incorporating additional items such as tax payments and work expenses in its family resource estimates. SPM thresholds are derived from Consumer Expenditure Survey expenditure data on necessities (food, shelter, clothing, and utilities) and are adjusted for geographic differences in the cost of housing (there are no adjustments for transportation or other costs that may vary by geographic location). See Supplemental Poverty Measure for more technical information on SPM. Also, see Final Report of the Interagency Technical Working Group on Evaluating Alternative Measures of Povertyfor historical and comparative discussion of the OPM, SPM, and other alternative poverty measures.


