This page provides interactive charts on various aspects of food security:
- Trends in U.S. Food Security
- Trends in Food Insecurity in U.S. Households with Children
- Food Insecurity and Very Low Food Security by Education, Employment, and Disability Status
- Food Security in the United States: How do States Compare?
Food security definitions:
Food secure households had access, at all times, to enough food for an active, healthy life for all household members: 86.5 percent (114.6 million) of U.S. households were food secure throughout 2023.
Food-insecure households are uncertain of having, or unable to acquire, at some time during the year, enough food to meet the needs of all their members because they had insufficient money or other resources for food: 13.5 percent (18.0 million) of U.S. households were food insecure at some time during 2023. Food-insecure households include those with low food security and very low food security.
- 8.4 percent (11.2 million) of U.S. households had low food security in 2023.
- 5.1 percent (6.8 million) of U.S. households had very low food security at some time during 2023.
Households with very low food security are food insecure to the extent that normal eating patterns of some household members are disrupted at times during the year, with self-reported food intake below levels considered adequate.
Food security database:
The statistics shown in these interactive charts are available for download in Excel or CSV format. Download the complete Food Security Data file. XLSX or CSV

Food-insecure households: At times during the year, these households were uncertain of having, or unable to acquire, enough food to meet the needs of all their members because they had insufficient money or other resources for food. Food-insecure households include those with low food security and very low food security.
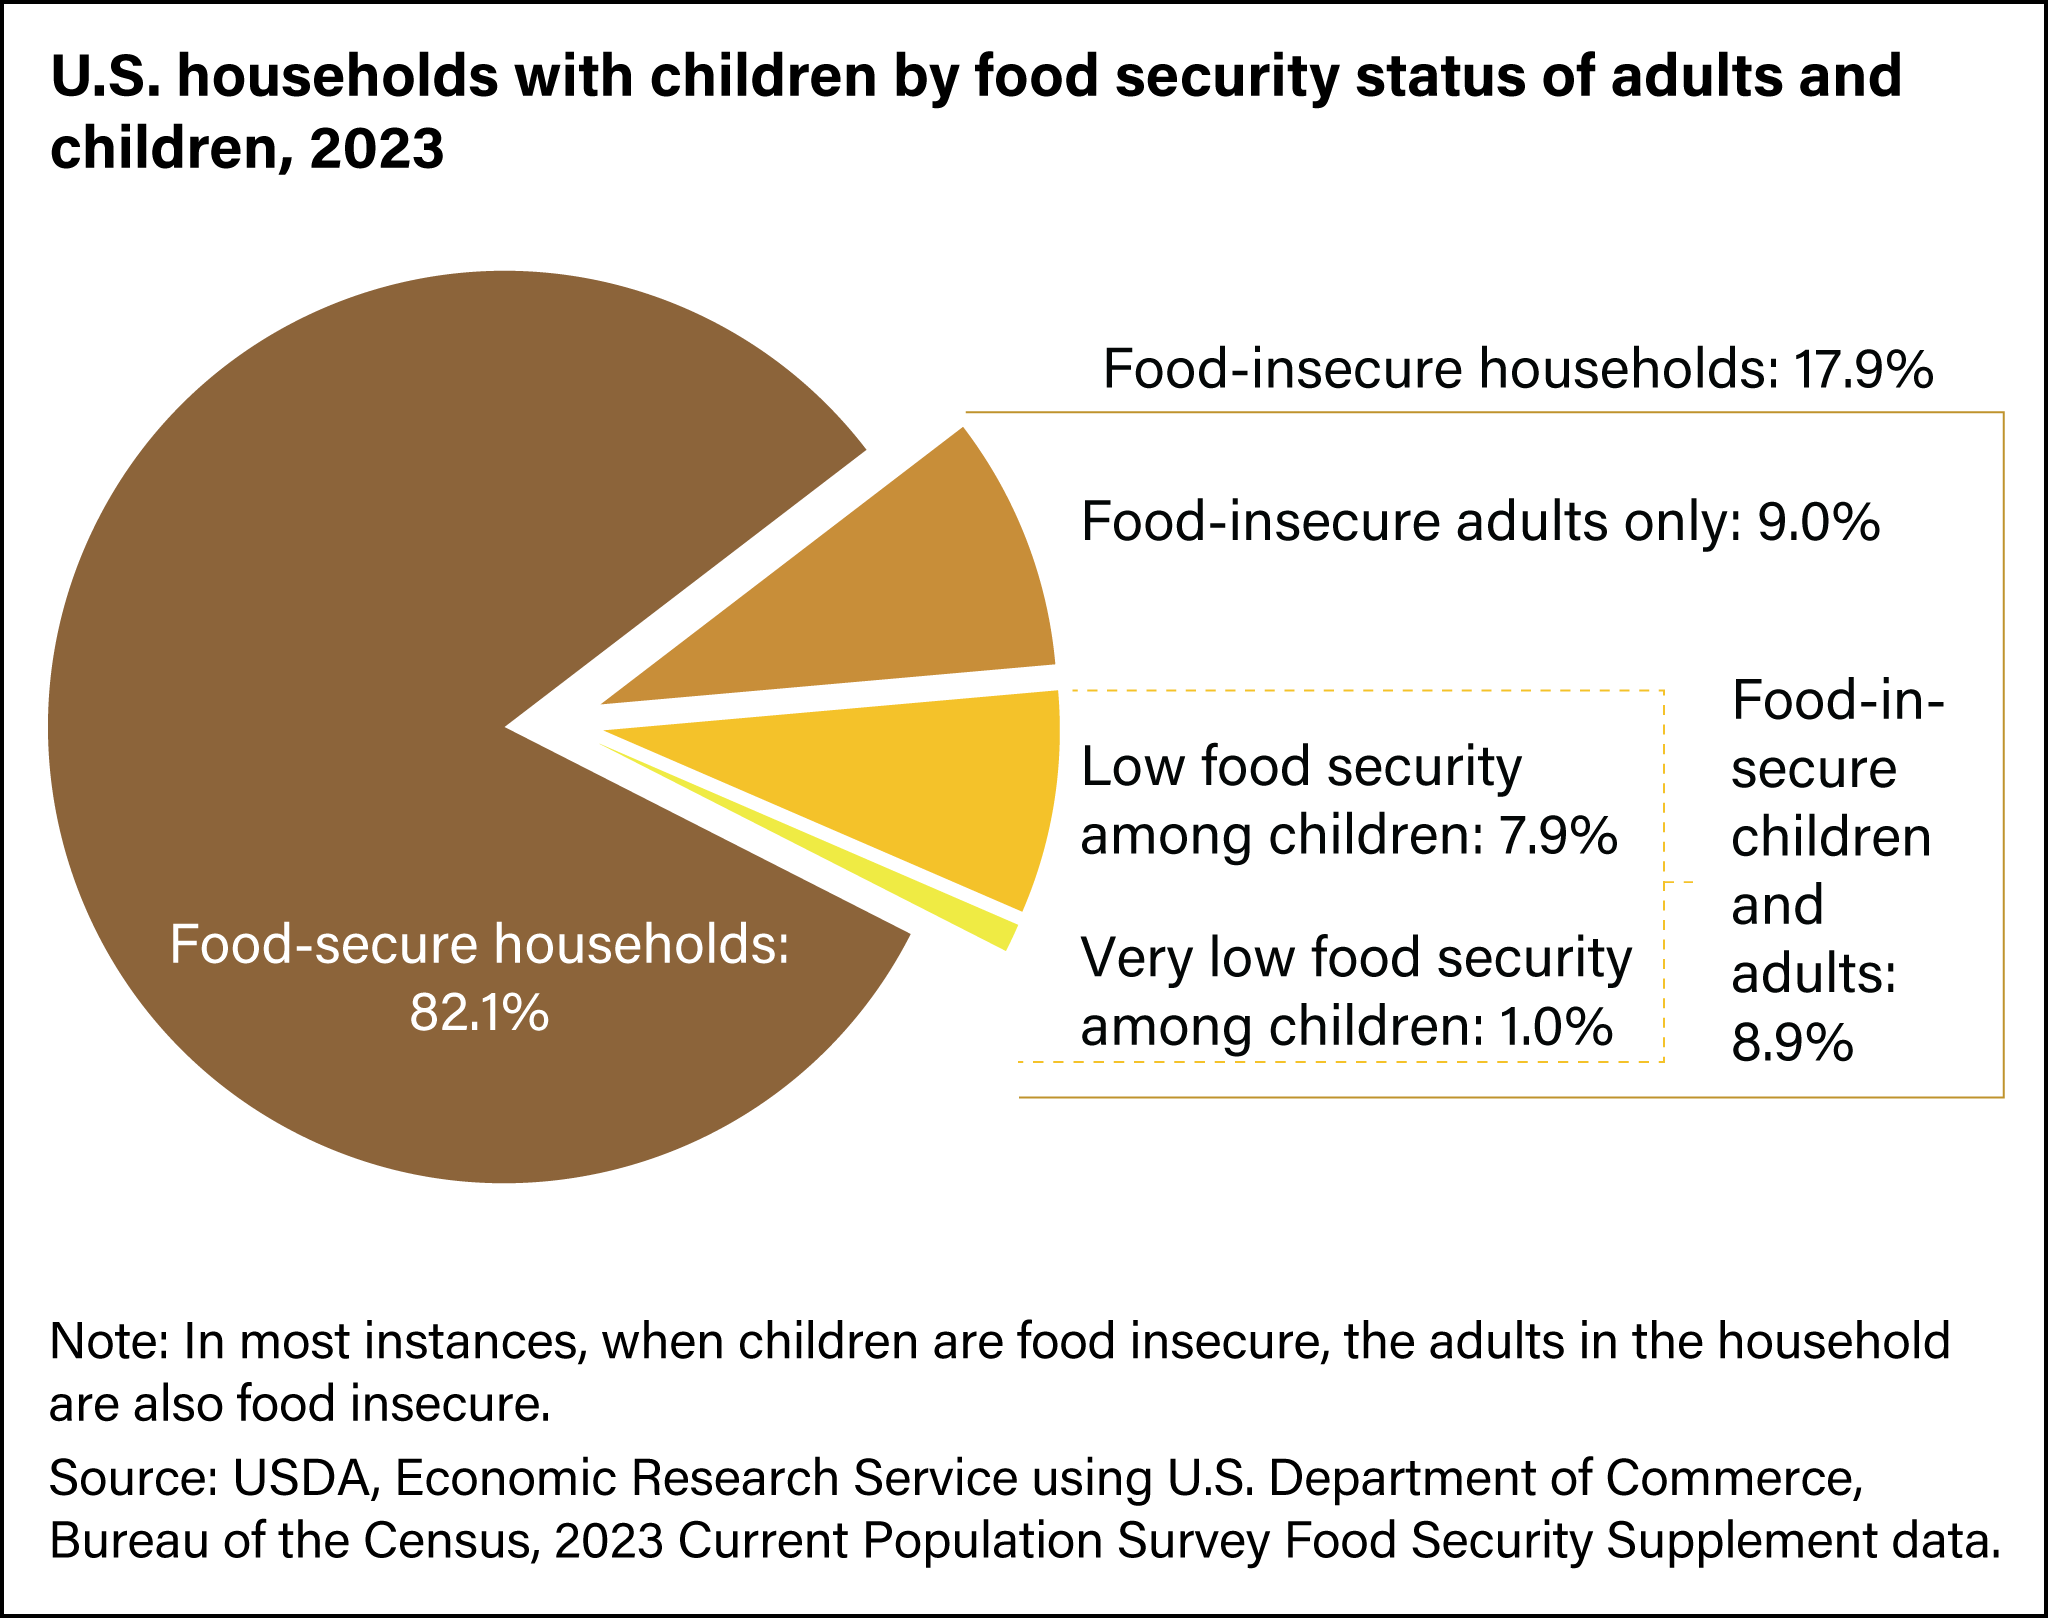
Parents often protect their children from food insecurity even when the parents themselves experience reduced dietary quality and intake. In some food-insecure households, only the adults are food insecure.
Households with food-insecure children: These households were unable, at some time during the year, to provide adequate, nutritious food for their children due to a lack of money for food.
Households with very low food security among children: Caregivers reported that children were hungry, skipped a meal, or did not eat for a whole day because there was not enough money for food.
Prevalence of food insecurity and very low food security by education, employment, and disability status:
The social and economic circumstances of households determine their food security status to a great extent. This data visualization looks at three socioeconomic characteristics—education, employment, and disability status—that previous research has shown to be associated with food insecurity. The distribution of food insecurity is based on the frequency of a subgroup’s occurrence among the food-insecure population.
