
Suggested citation for linking to this discussion:
U.S. Department of Agriculture, Economic Research Service. (2025, September 3). Farm sector income & finances: Highlights from the farm income forecast.
Farm Sector Profits Forecast To Increase in 2025
Net farm income, a broad measure of profits, is forecast at $179.8 billion for calendar year 2025, an increase of $52.0 billion (40.7 percent) relative to 2024 in nominal (not adjusted for inflation) dollars. After adjusting for inflation, net farm income is forecast to increase by $48.8 billion (37.2 percent) in 2025 relative to 2024. With this expected increase, 2025 net farm income would remain above its 20-year average (2005–24) in inflation-adjusted dollars.
Net cash farm income is forecast at $180.7 billion for 2025, an increase of $40.1 billion (28.5 percent) relative to 2024 (not adjusted for inflation). When adjusted for inflation, 2025 net cash farm income is forecast to increase by $36.5 billion (25.3 percent) from 2024. If the forecast is realized, net cash farm income in 2025 would rise above its 2005–24 average. Net cash farm income encompasses cash receipts from farming, as well as cash farm-related income (including Federal Government payments) minus cash expenses. It does not include noncash items (including changes in inventories, economic depreciation, and gross imputed rental income of operator dwellings) reflected in the net farm income measure.
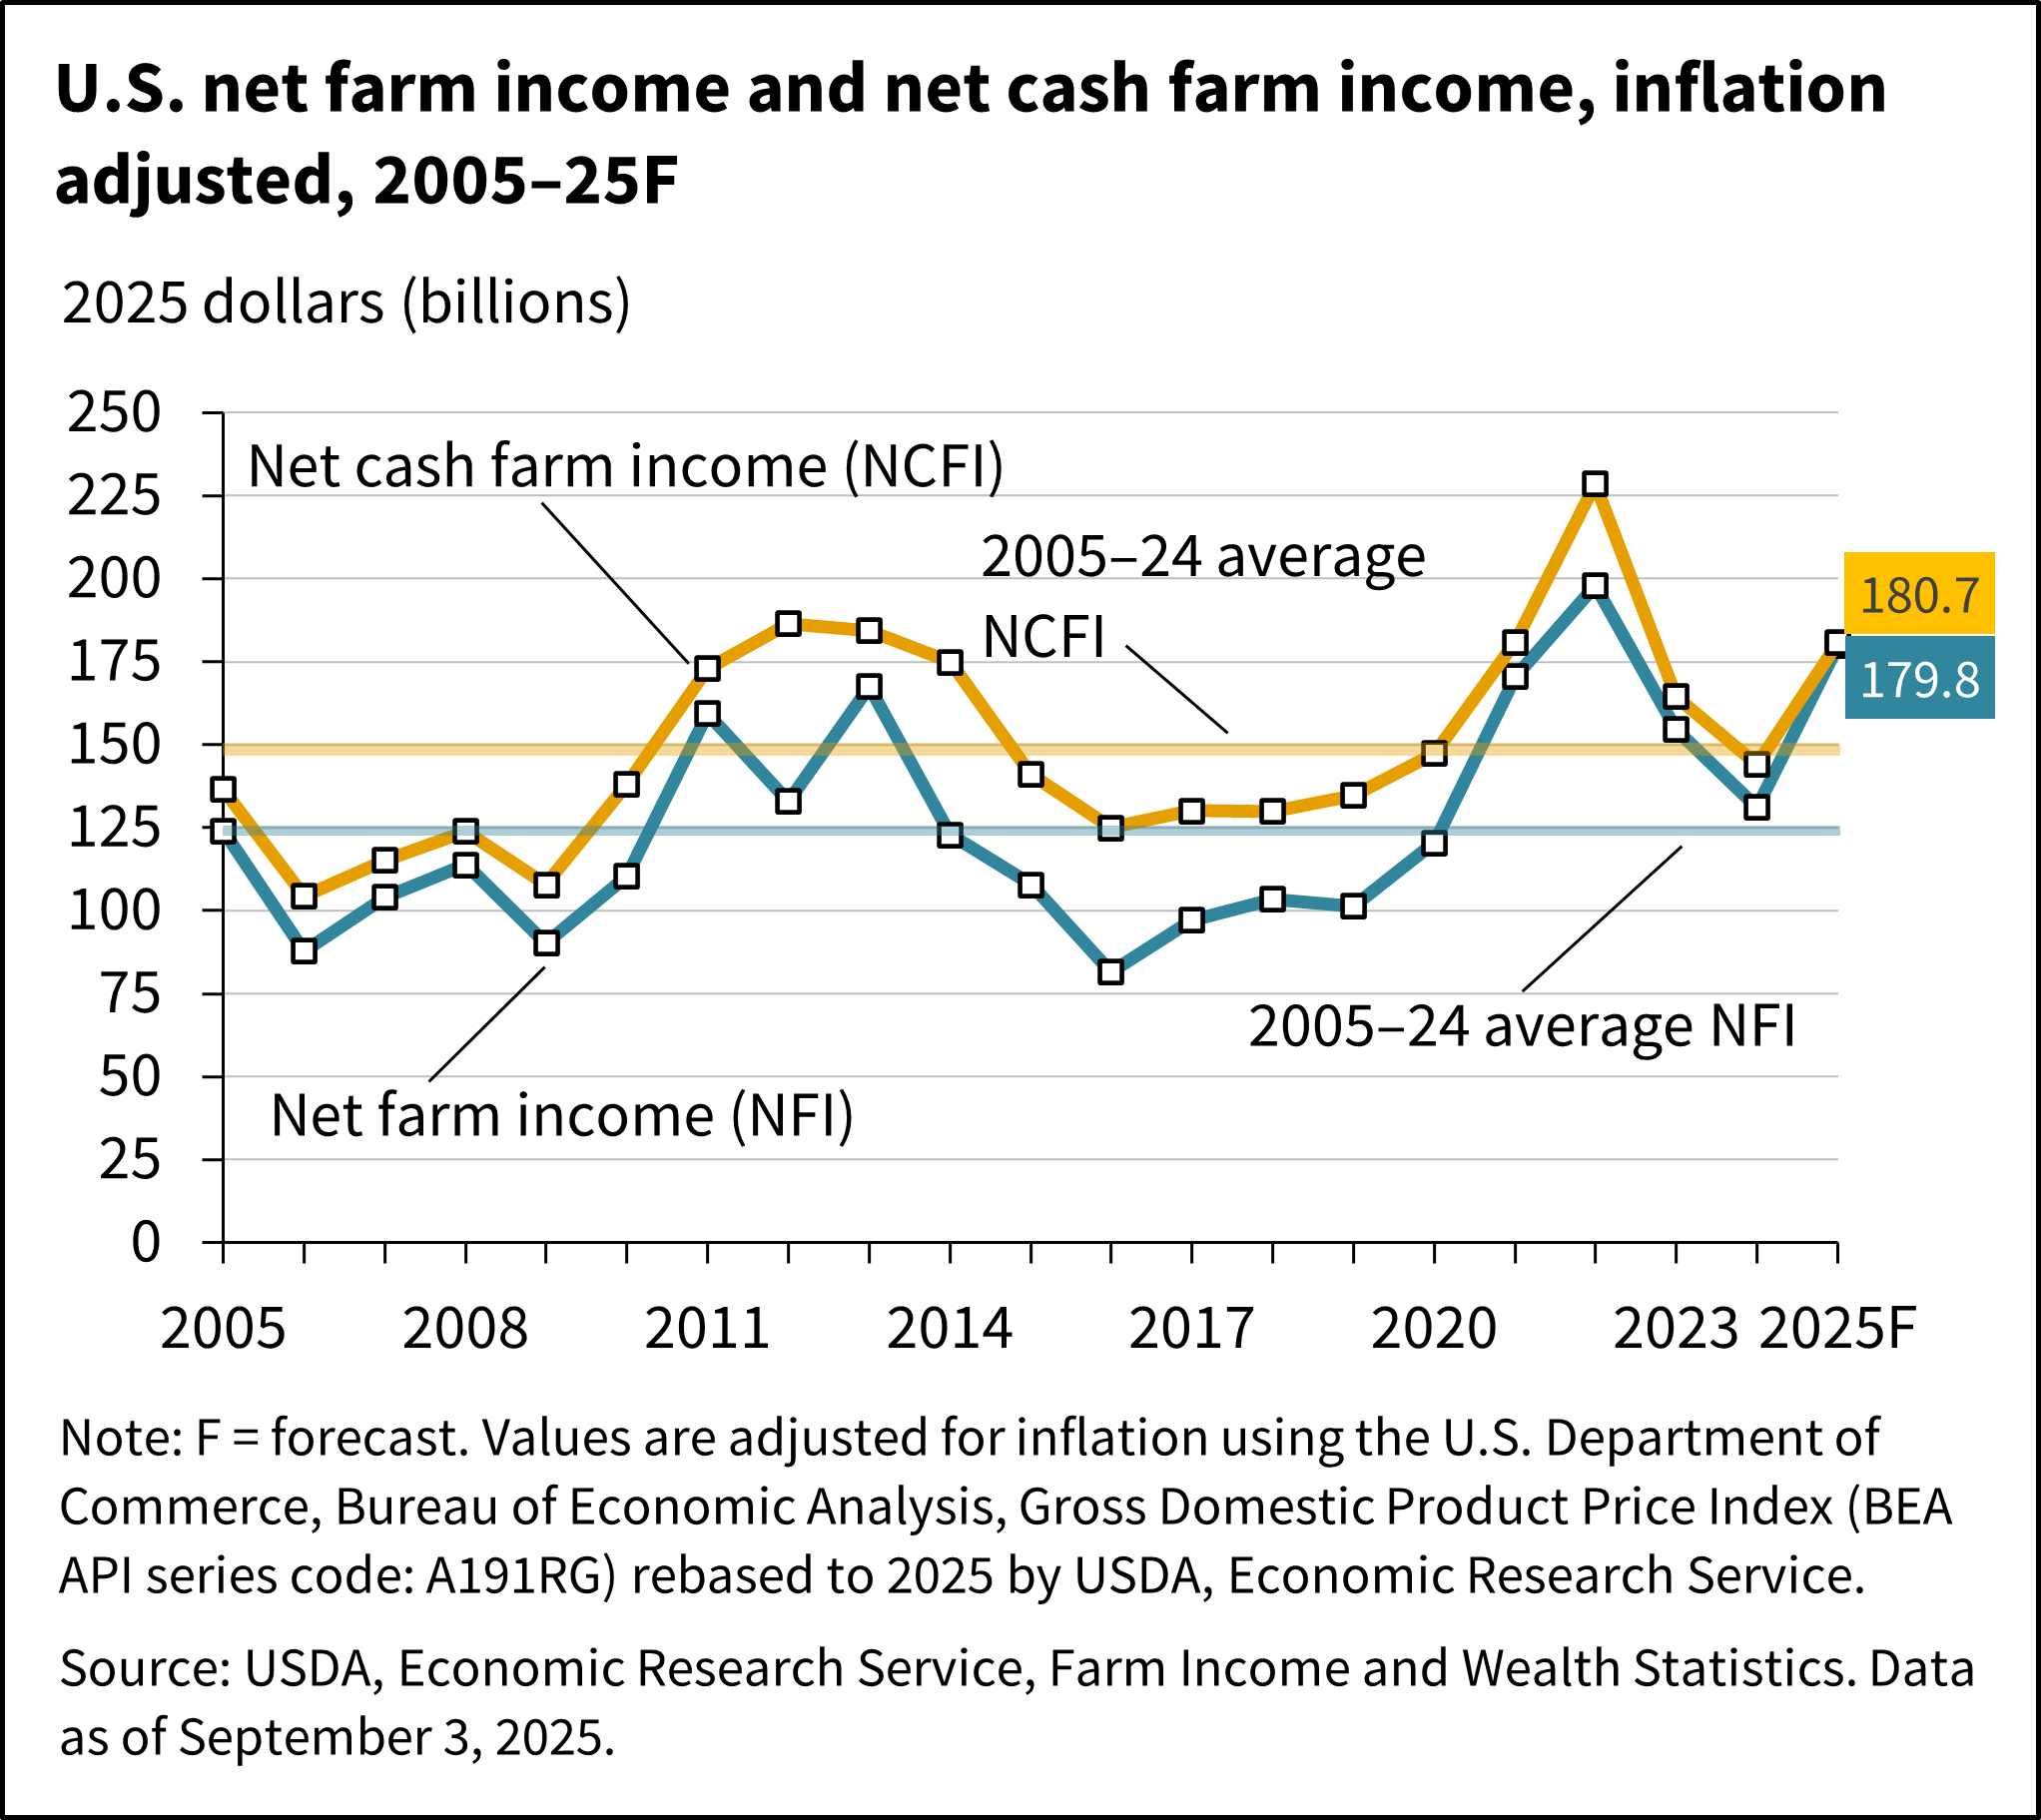
Read the full 2025 forecast for farm sector income or see data only at tables on farm income indicators.
The average net cash farm income for farm businesses is forecast to increase 12.0 percent from 2024 to $127,000 per farm in 2025 in nominal terms. Farm businesses are farms with annual gross cash farm income (GCFI)—annual income before expenses—of at least $350,000 or operations with less than $350,000 in annual GCFI but that report farming as the operator's primary occupation. Eight out of the nine USDA, Economic Research Service (ERS) Farm Resource Regions are expected to see average net cash farm income rise in 2025 relative to 2024. Farm businesses located in the Mississippi Portal region are projected to see the largest dollar increase while those in the Heartland region are projected to see average net cash income decline. When grouped by commodity specialization, farm businesses specializing in animal/animal products are generally forecast to see higher average net cash farm income in 2025 while the outlook for those specializing in crops is mixed.
Read the full 2025 forecast for farm business income or see data on Average (Farm-level) Net Cash Income.
On the farm sector balance sheet, equity is expected to increase by $170.8 billion (4.7 percent) from 2024 to $3.83 trillion in 2025 in nominal terms. Farm sector assets are forecast to increase by $199.1 billion (4.7 percent) to $4.42 trillion in 2025 following an expected increase in the value of farm real estate assets. Farm sector debt is forecast to increase by $28.3 billion (5.0 percent) to $591.8 billion in 2025. Debt-to-asset levels for the sector are forecast to remain stable at 13.4 percent in 2025. Working capital is forecast to increase 15.2 percent in 2025 compared to 2024.
Read the full 2025 forecast for farm assets, debt and wealth or see data on the farm balance sheet.
Median Income of Farm Operator Households Forecast to Increase in 2025
Median total farm household income increased to $102,748 in 2024, a 4.9 percent (2.3 percent after inflation) increase from 2023. It is forecast to reach $109,515 in 2025 with an increase of 6.6 percent (3.7 percent after inflation) relative to 2024.
Farm households typically receive income from farm and off-farm sources. Median farm income earned by farm households was -$1,830 in 2024 and is forecast to increase to -$1,189 in 2025. Many farm households primarily rely on off-farm income. Median off-farm income was $86,900 in 2024, an increase of 8.8 percent (6.1 percent after inflation) from 2023. In 2025, median off-farm income is forecast to increase by a further 3.4 percent (0.6 percent after inflation) to $89,881. Since farm and off-farm income are not distributed identically for every farm, median total income will generally not equal the sum of median off-farm and median farm income.
See the Farm Household Income and Characteristics data product tables for financial statistics of farm operator households.
