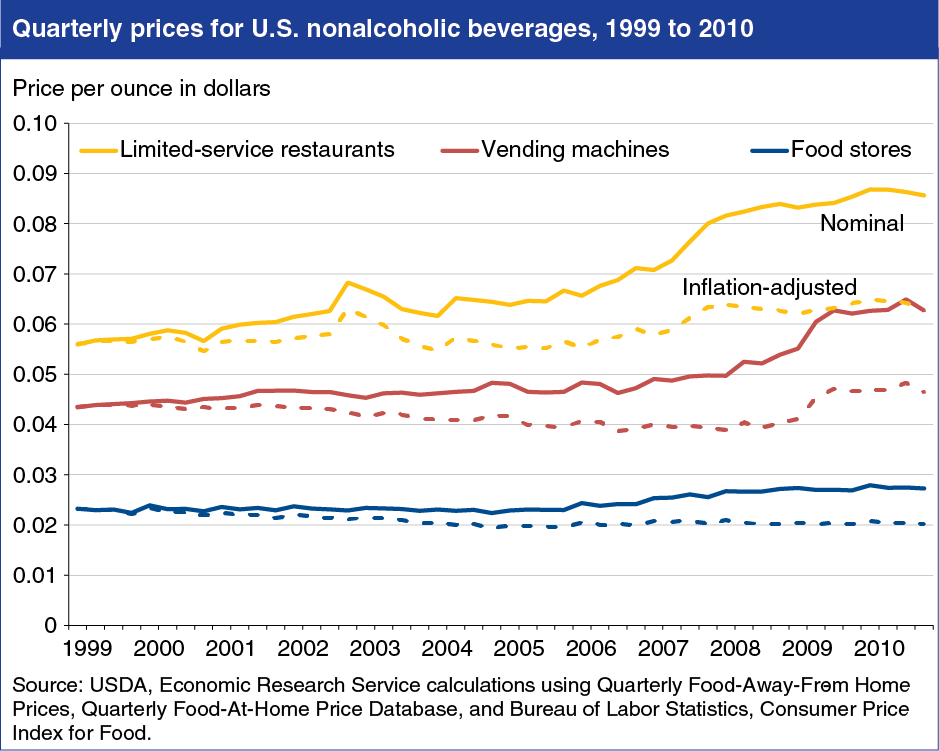
Inflation-adjusted beverage prices little changed between 1999 and 2010
- by Aylin Kumcu and Abigail Okrent
- 10/7/2014

ERS’s Quarterly Food-Away-From-Home Prices (QFAFHP) data product provides quarterly average prices for products at away-from-home eating places (full- and limited-service restaurants, vending machines, and schools) across geographic areas and over time, and can be combined with the Quarterly Food-At-Home Price Database to make comparisons between at-home and away-from-home markets. Using these data, ERS researchers observed that beverages away from home are generally more expensive than at-home versions. In the last quarter of 2010, nonalcoholic beverages purchased at limited-service restaurants cost $1.37 for a 16-ounce serving, while beverages purchased at vending machines cost $1.00 for 16 ounces. Beverages purchased in food stores cost even less—$0.44 for 16 ounces. From 1999 to 2010, inflation-adjusted beverage prices at limited-service restaurants and vending machines grew only 1 percent per year on average, while they declined 1 percent at food stores. This chart appears in “New Data on U.S. Food-Away-From-Home Prices Show Geographic and Time Variation” in ERS’s September 2014 Amber Waves magazine.

