
Compared to family farms, nonfamily farms are more likely to be midsize or large-scale
- by Katherine Lacy and Katherine Lim
- 5/29/2025
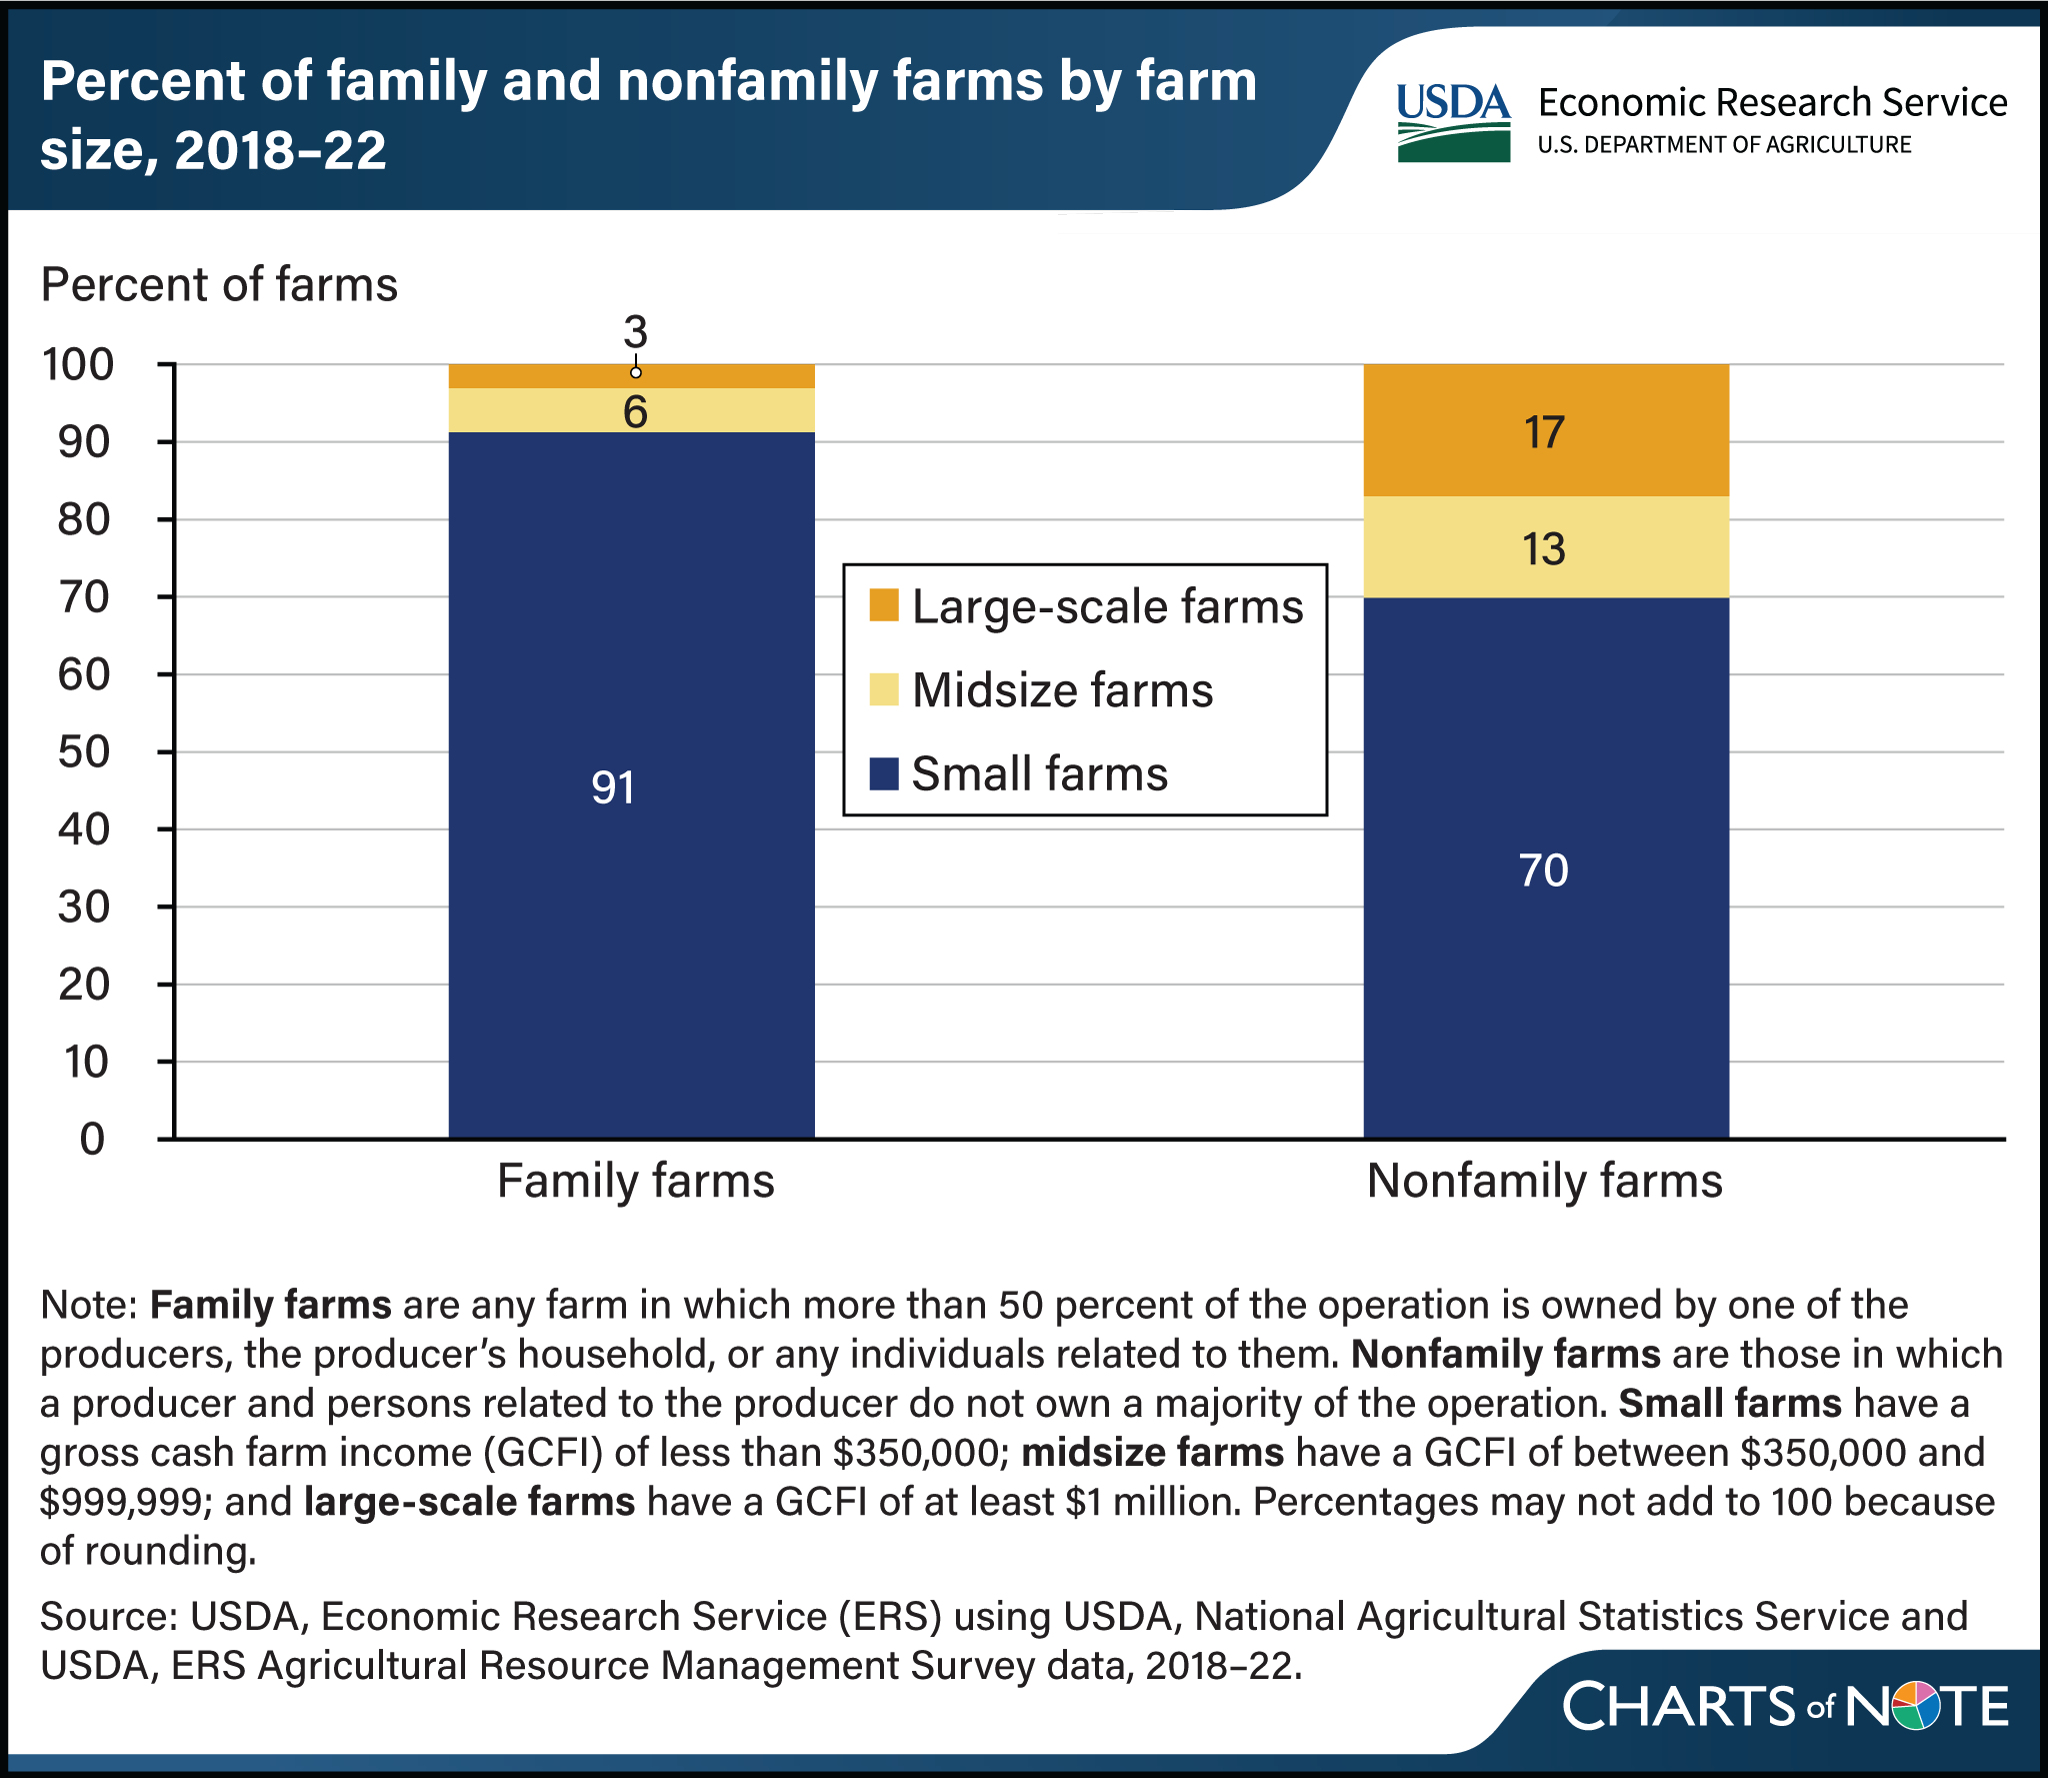
Nonfamily farm operations represent a small share of all U.S. farms, yet they contribute disproportionally to agricultural production in the United States. Defined as farms in which the majority of the operation is not owned by one of the producers, their household, or any individuals related to them, nonfamily farms accounted for 2 percent of farm operations on average between 2018 and 2022. Despite this, they generated 13.4 percent of the value of production. In contrast, family farms accounted for 98 percent of farm operations and 86.6 percent of the value of production during the same period. When categorized by farm size, 70 percent of nonfamily farms were classified as small farms (defined as operations with gross cash farm income of less than $350,000), while 17 percent were large-scale farms (gross cash farm income of at least $1 million). In contrast, 91 percent of family farms were classified as small farms and 3 percent were classified as large farms. This chart appears in the USDA, Economic Research Service’s report Nonfamily Farm Operations and the Households That Operate Them, published in March 2025.