
Imports accounted for less than 20 percent of U.S. food and beverage spending in 2023
- by Quinton Baker and James Chandler Zachary
- 5/15/2025
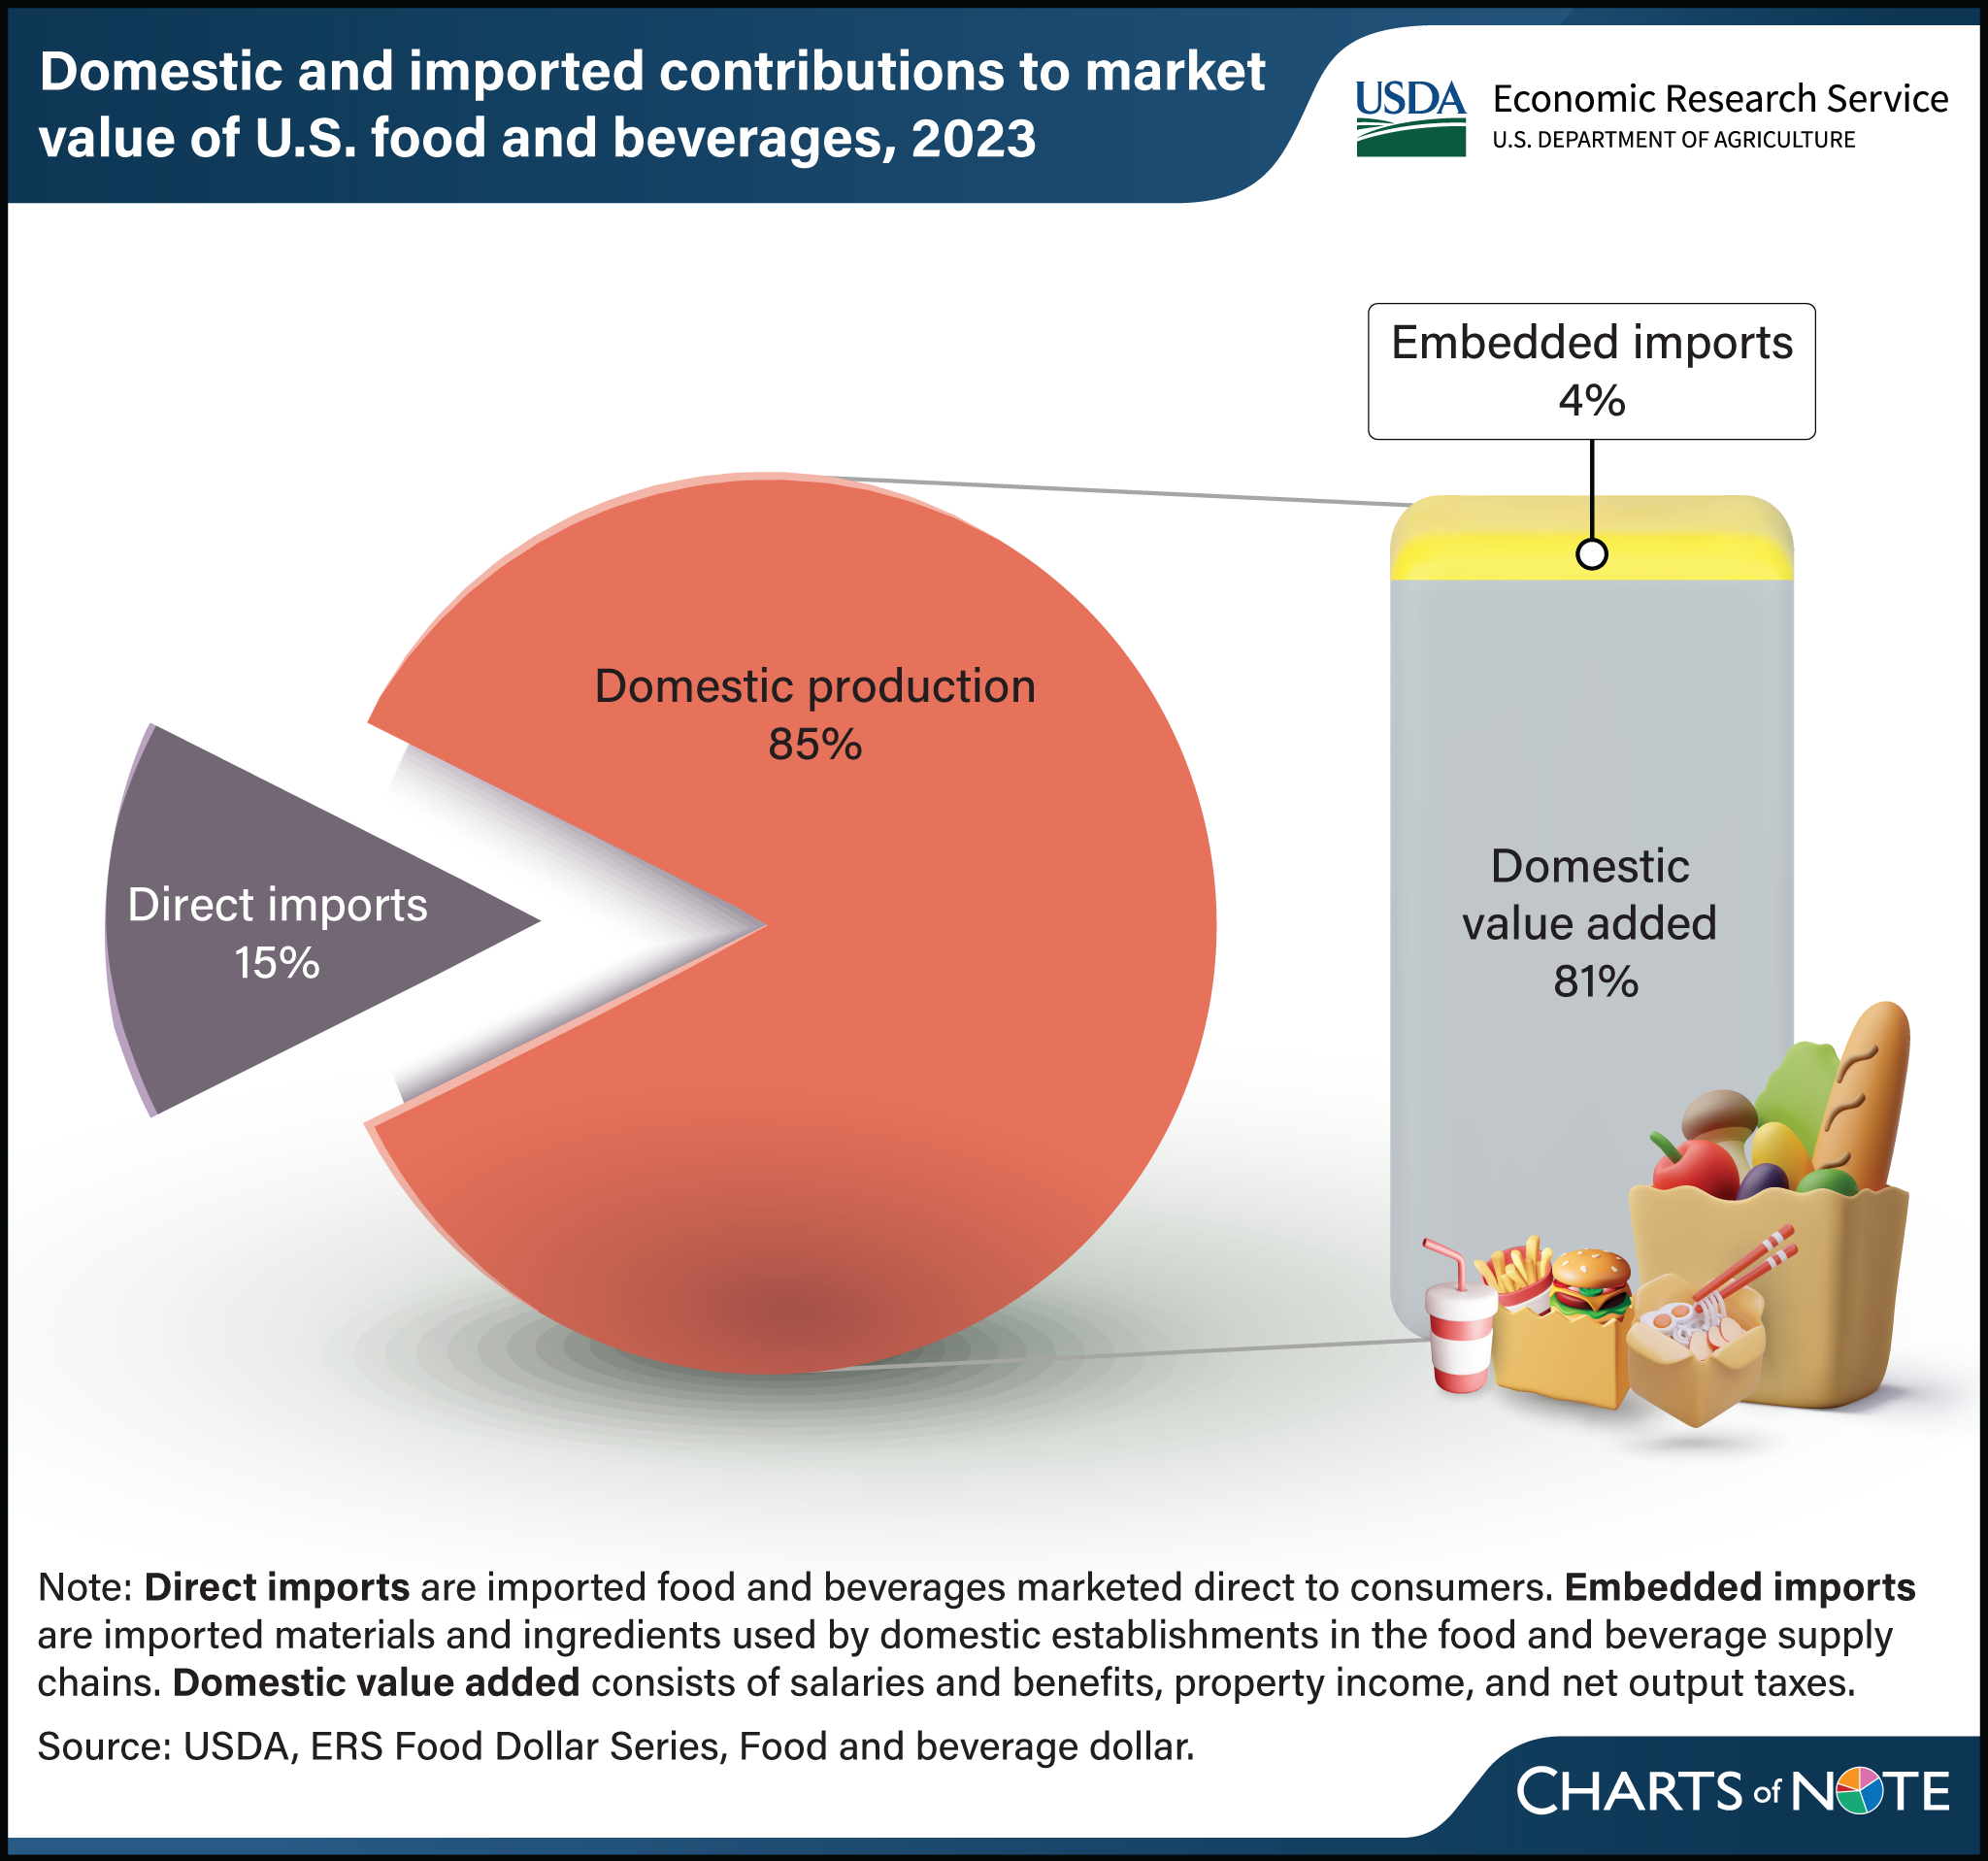
In 2023, U.S. consumers spent $2.92 trillion on food and beverages. The USDA, Economic Research Service (ERS) Food Dollar Series uses input–output accounting techniques to describe how much of consumer spending is attributed to domestic production versus direct imports. Direct imports are finished products that are imported as ready for sale to the consumer, such as wine from Europe or berries from Mexico. Direct imports accounted for 15 percent of total U.S. food and beverage purchases in 2023, and the remaining 85 percent was produced by the domestic supply chain. Of the domestically produced portion, 4 percent covered the cost of embedded imports. Embedded imports are ingredients and non-food inputs imported from other countries and used in domestic food production. For example, cranberries imported from Canada are used in domestic juice production, and cookware produced in France is used in domestic restaurant kitchens. This chart updates information in the Amber Waves article Accounting for Direct and Embedded Imports in the U.S. Food and Beverage Dollar, published in July 2015.