Accounting for Direct and Embedded Imports in the U.S. Food and Beverage Dollar
- by Sarah Rehkamp and Patrick Canning
- 7/6/2015
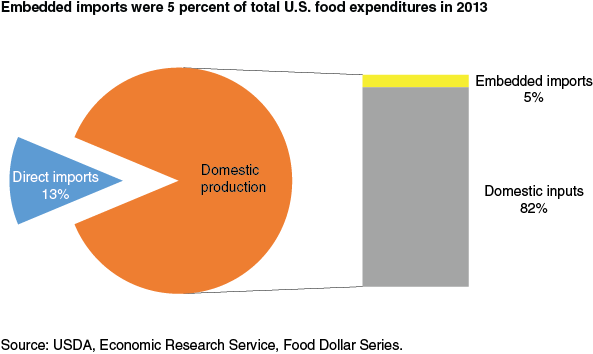
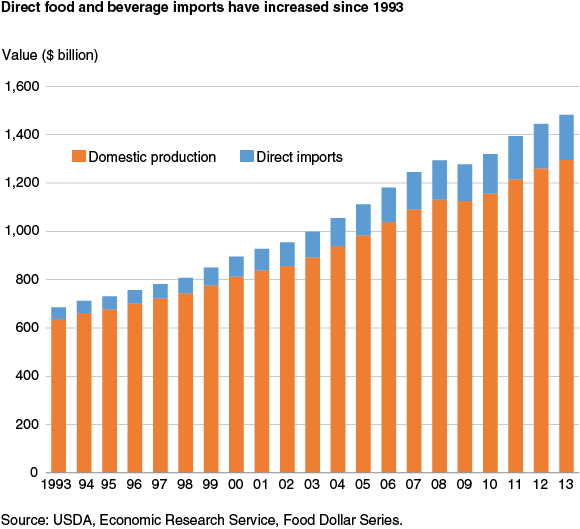
In 2013, U.S. consumers spent $1.48 trillion on food and beverages, including both grocery store and eating-out purchases. Of this total, $1.29 trillion was spent on domestically produced food and beverages.
Food and beverages produced in the United States rely not only on domestic inputs, but also on embedded imports. Embedded imports are food ingredients and non-food inputs that are imported and used throughout the U.S. food system. For example, cranberries are imported from Canada and then used as an ingredient in U.S. fruit juice production. Likewise, U.S. restaurant owners purchase cooking pots from France or foreign-made refrigerators that are embedded in the meals they serve.
ERS’s food dollar series measures U.S. consumers’ annual expenditures on food and beverages. The industry group series of the food dollar breaks down the U.S. food system into 12 industry groups and identifies the value added, or cost contributions, of each group. This series also allows ERS researchers to identify how much and where embedded imports are used in the U.S. food system. In 2013, $76.6 billion of embedded imports were used, accounting for 5 percent of total U.S. food spending.
Imported Energy Used in U.S. Food System Valued at $20 Billion
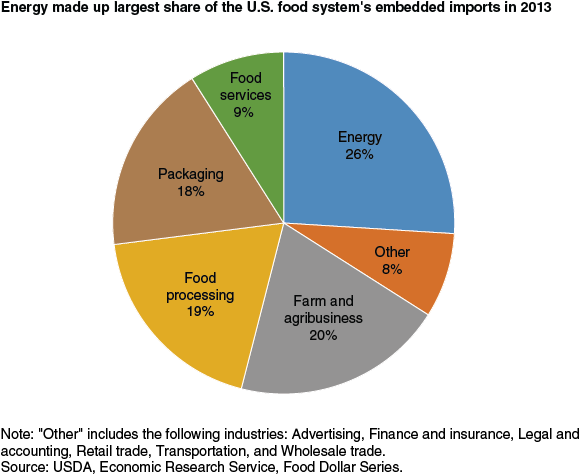
Imported energy such as crude oil or natural gas from Canada made up 26 percent of the embedded imports used by the U.S. food system in 2013 and was valued at $20 billion. The next highest share is attributed to the farm and agribusiness industries. Farm and agribusiness embedded imports, such as the Canadian cranberries or Saudi Arabian fertilizer, were valued at $15.1 billion in 2013. Similarly, $14.5 billion of embedded imports were attributed to the food processing industry. The U.S. food and beverage packaging industry and foodservice establishments together used $20.5 billion of foreign inputs.
Direct Food and Beverage Imports Account for 13 Percent of Purchases
In addition to domestically produced food and beverages that may contain embedded imports, U.S. consumers also directly purchase food and beverages imported from around the world. Examples of direct imports include farm-raised shrimp from Thailand, fresh avocados from Mexico, and wines from Spain. In 2013, U.S. consumers spent $186.9 billion on imported food and beverages. Direct imports’ share of total U.S. food and beverage purchases has grown from 7 percent in 1993 to 13 percent in 2013.
U.S. consumer expenditures on direct food and beverage imports in the ERS food dollar series include domestic marketing costs such as food retailing and transportation that are added to the cost of direct imports. This differs from another annual ERS data product, U.S. Food Imports, which reports the customs value of U.S. food imports, excluding the domestic marketing costs. Another difference is that the U.S. Food Imports data include all food and beverage imports entering the country, whether purchased by a U.S. consumer directly or embedded in U.S.-produced food.
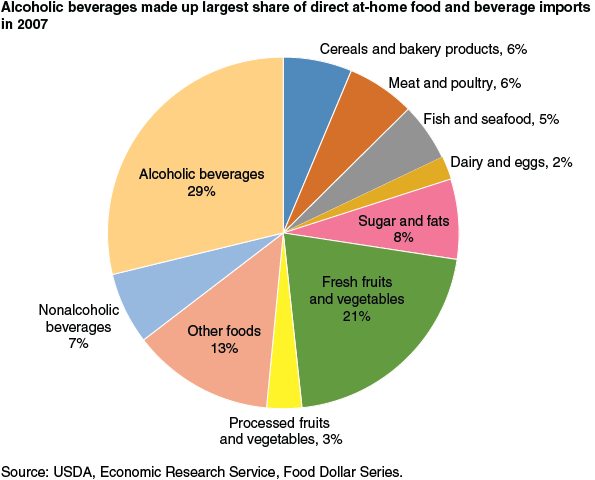
Still focusing on direct imports, ERS researchers used 2007 detailed data from the ERS food dollar series to look at which types of imported food and beverages are purchased by U.S. consumers. These 2007 data are specifically for food and beverages purchased in grocery stores, supermarkets, or other food retailers, rather than purchases in foodservice establishments. Alcoholic beverages such as German beers or Spanish wines accounted for 29 percent of the $81.7 billion of at-home food and beverage imports in 2007; nonalcoholic beverages accounted for an additional 7 percent of these imports. Fresh fruits and vegetables, valued at $17.1 billion, had a 21-percent share. Both the meat and poultry category and the cereals and bakery products category each made up 6 percent of the value of at-home food and beverage imports in 2007.
This article is drawn from:
- Food Dollar Series. (n.d.). U.S. Department of Agriculture, Economic Research Service.


