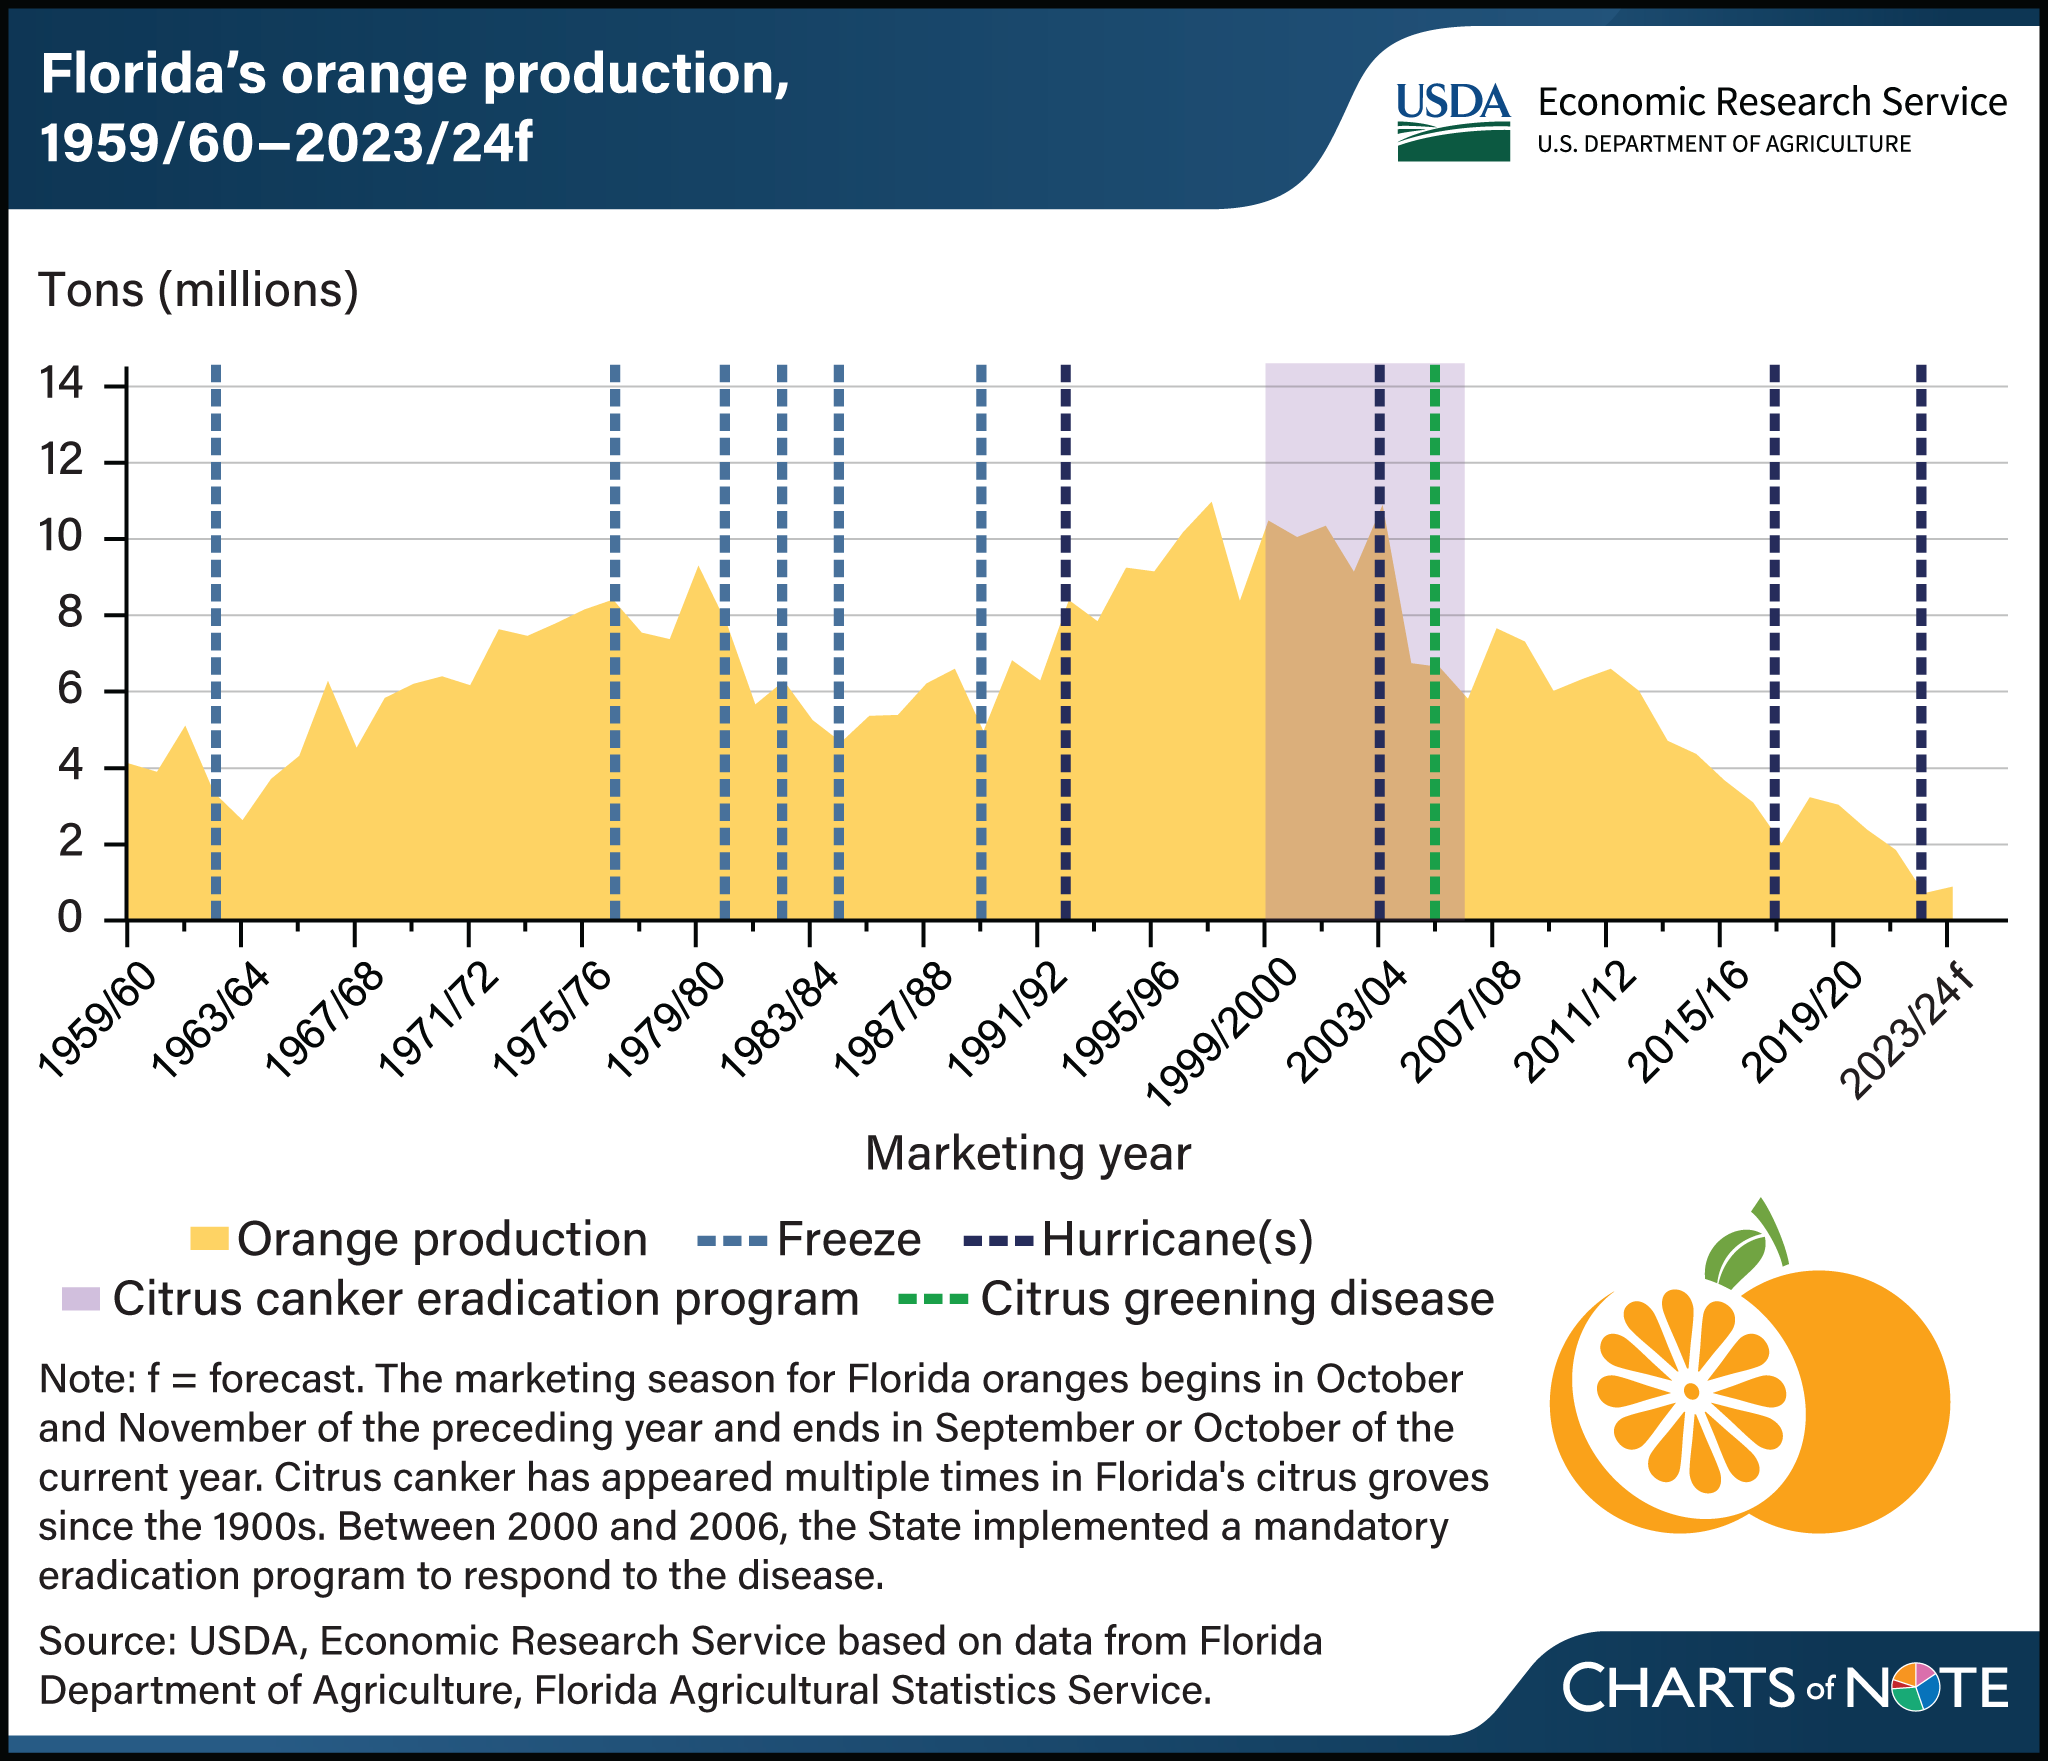
Natural disasters, disease cut Florida orange production an estimated 92 percent since 2003/04
- by Skyler Simnitt
- 4/25/2024

Florida’s citrus industry has long been susceptible to freezes, hurricanes, and disease. A series of devastating freezes in the 1970s and 1980s caused production to shift to more southern regions of the State. Then after near-record output in the 2003/04 season, subsequent events decreased Florida’s orange output at an average rate of 6 percent a year. Between 2004 and 2005, 4 hurricanes reduced the size of the orange crop and further spread citrus canker, a bacterial disease damaging to tree health and fruit quality, to previously unaffected areas. The Florida citrus industry faced an additional challenge in 2005, when citrus greening disease, a bacterial disease deadly to citrus trees, was first detected in its commercial groves. Citrus greening disease leads to premature fruit drop, unripe fruit, and eventual tree death. With no known cure, citrus growers use a variety of management strategies to protect young trees, increase tree immune response, sustain grove health, and improve fruit marketability. While these management strategies can partially offset yield losses, they increase the costs of production. Hurricanes in 2017 and 2022 dealt further damage to Florida’s citrus industry. Since 2003/04, bearing acreage of Florida’s orange trees has declined at an average rate of 3 percent per year. In April 2024, USDA forecast Florida’s orange 2023/24 production at 846,000 tons, 19 percent higher than the previous year but the second-lowest harvest in nearly 90 years. This chart updates information in the USDA, Economic Research Service Fruit and Tree Nuts Outlook, published in March 2023.

