U.S. Obesity Rate Changes Differ for Rural and Urban Areas, as Well as Across Regions
- by Mariah Ehmke and Brandon J. Restrepo
- 8/5/2025
Highlights
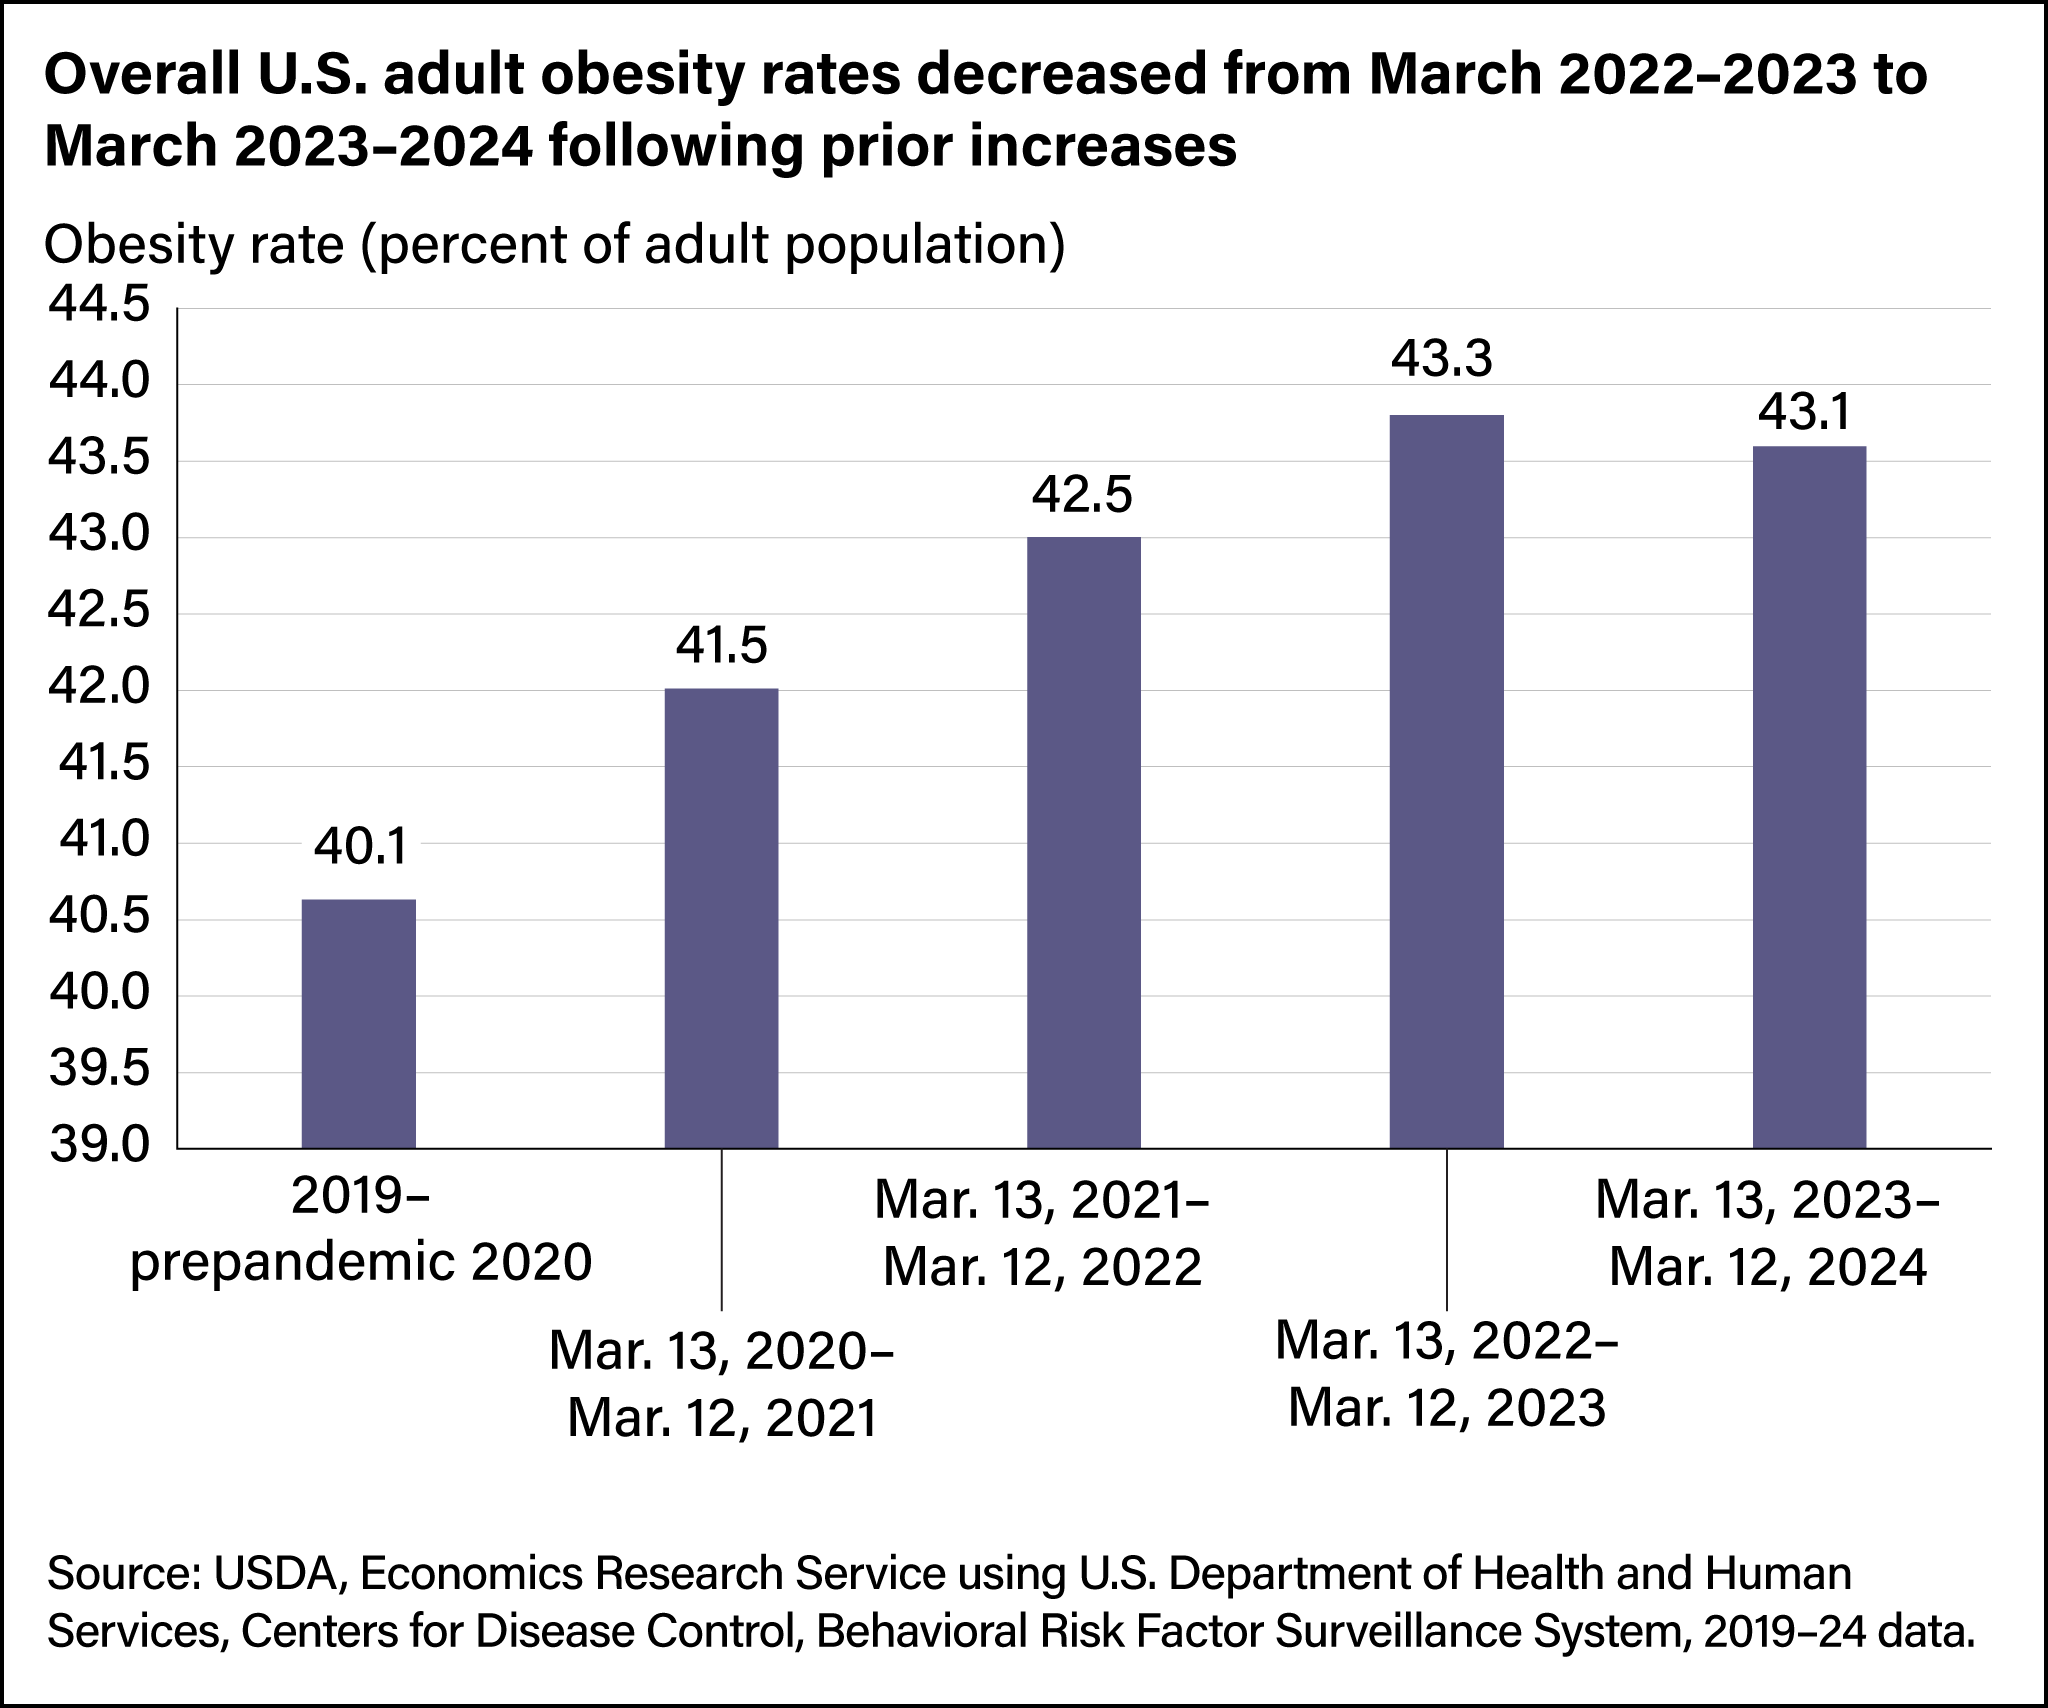
- Despite a slight decline in the U.S. overall obesity rate from March 2022–2023 to March 2023–2024, rural obesity rates rose 0.5 percentage points during the same time.
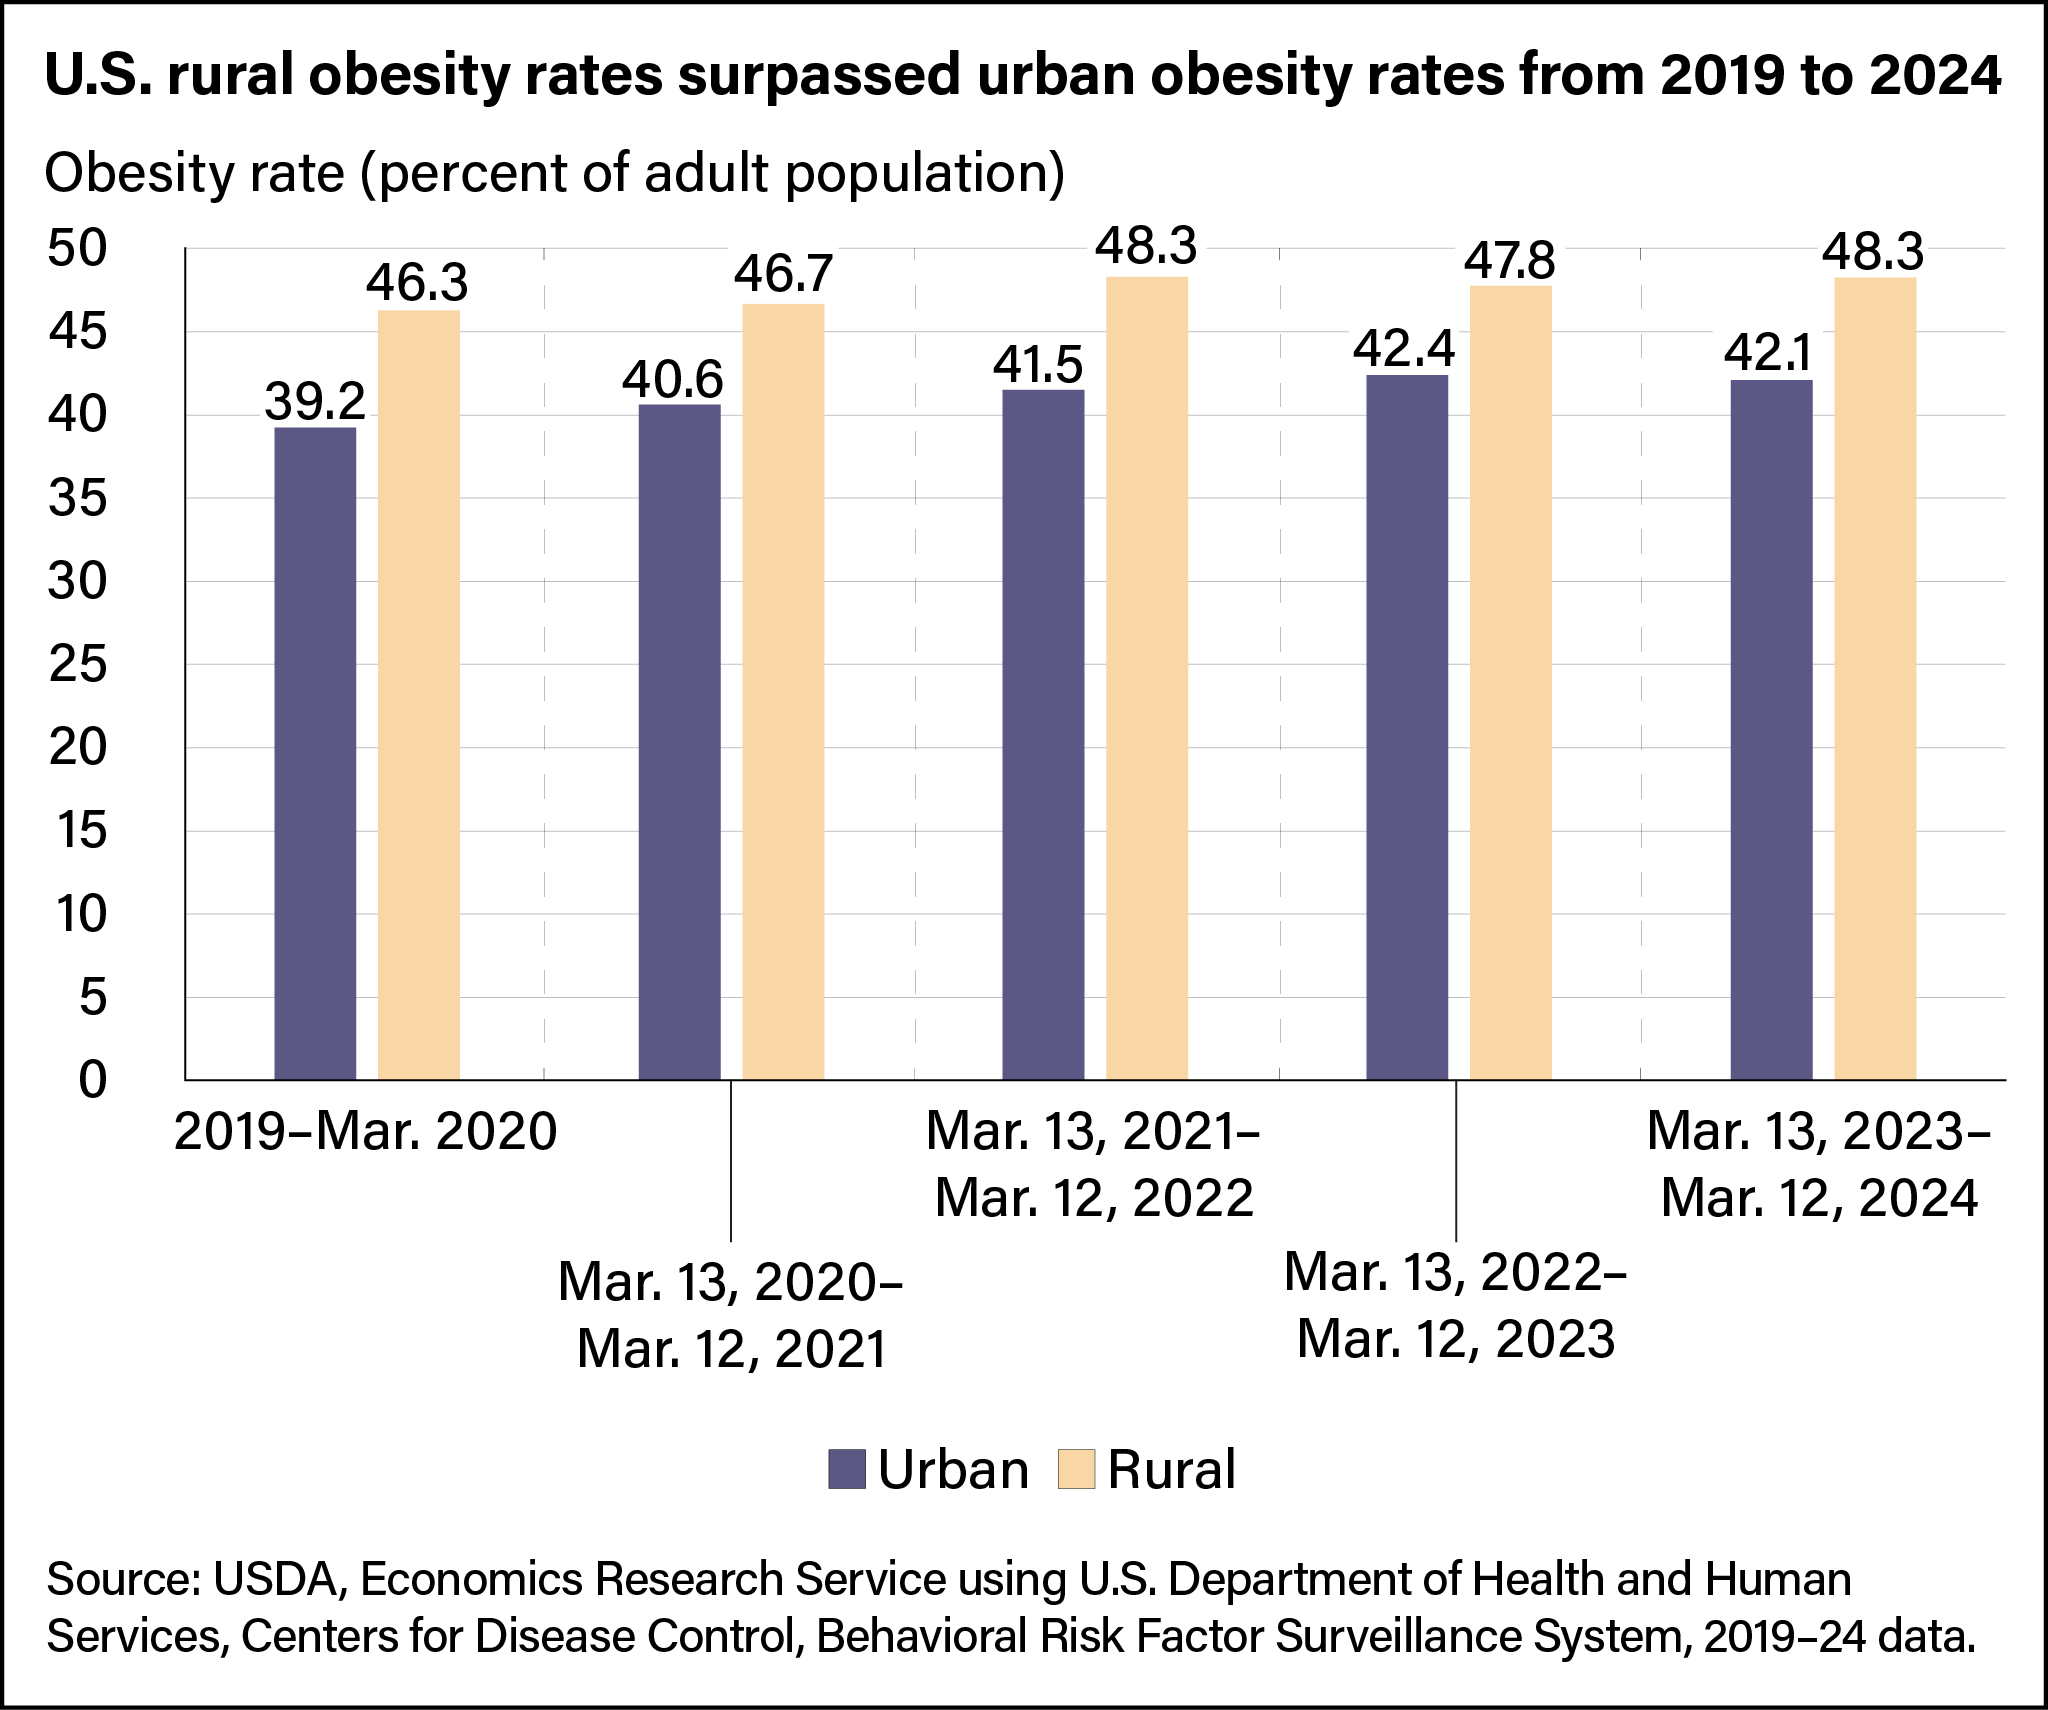
- The U.S. obesity rates in rural areas were higher than urban rates, which declined 0.3 percentage point from March 2022–2023 to March 2023–2024.
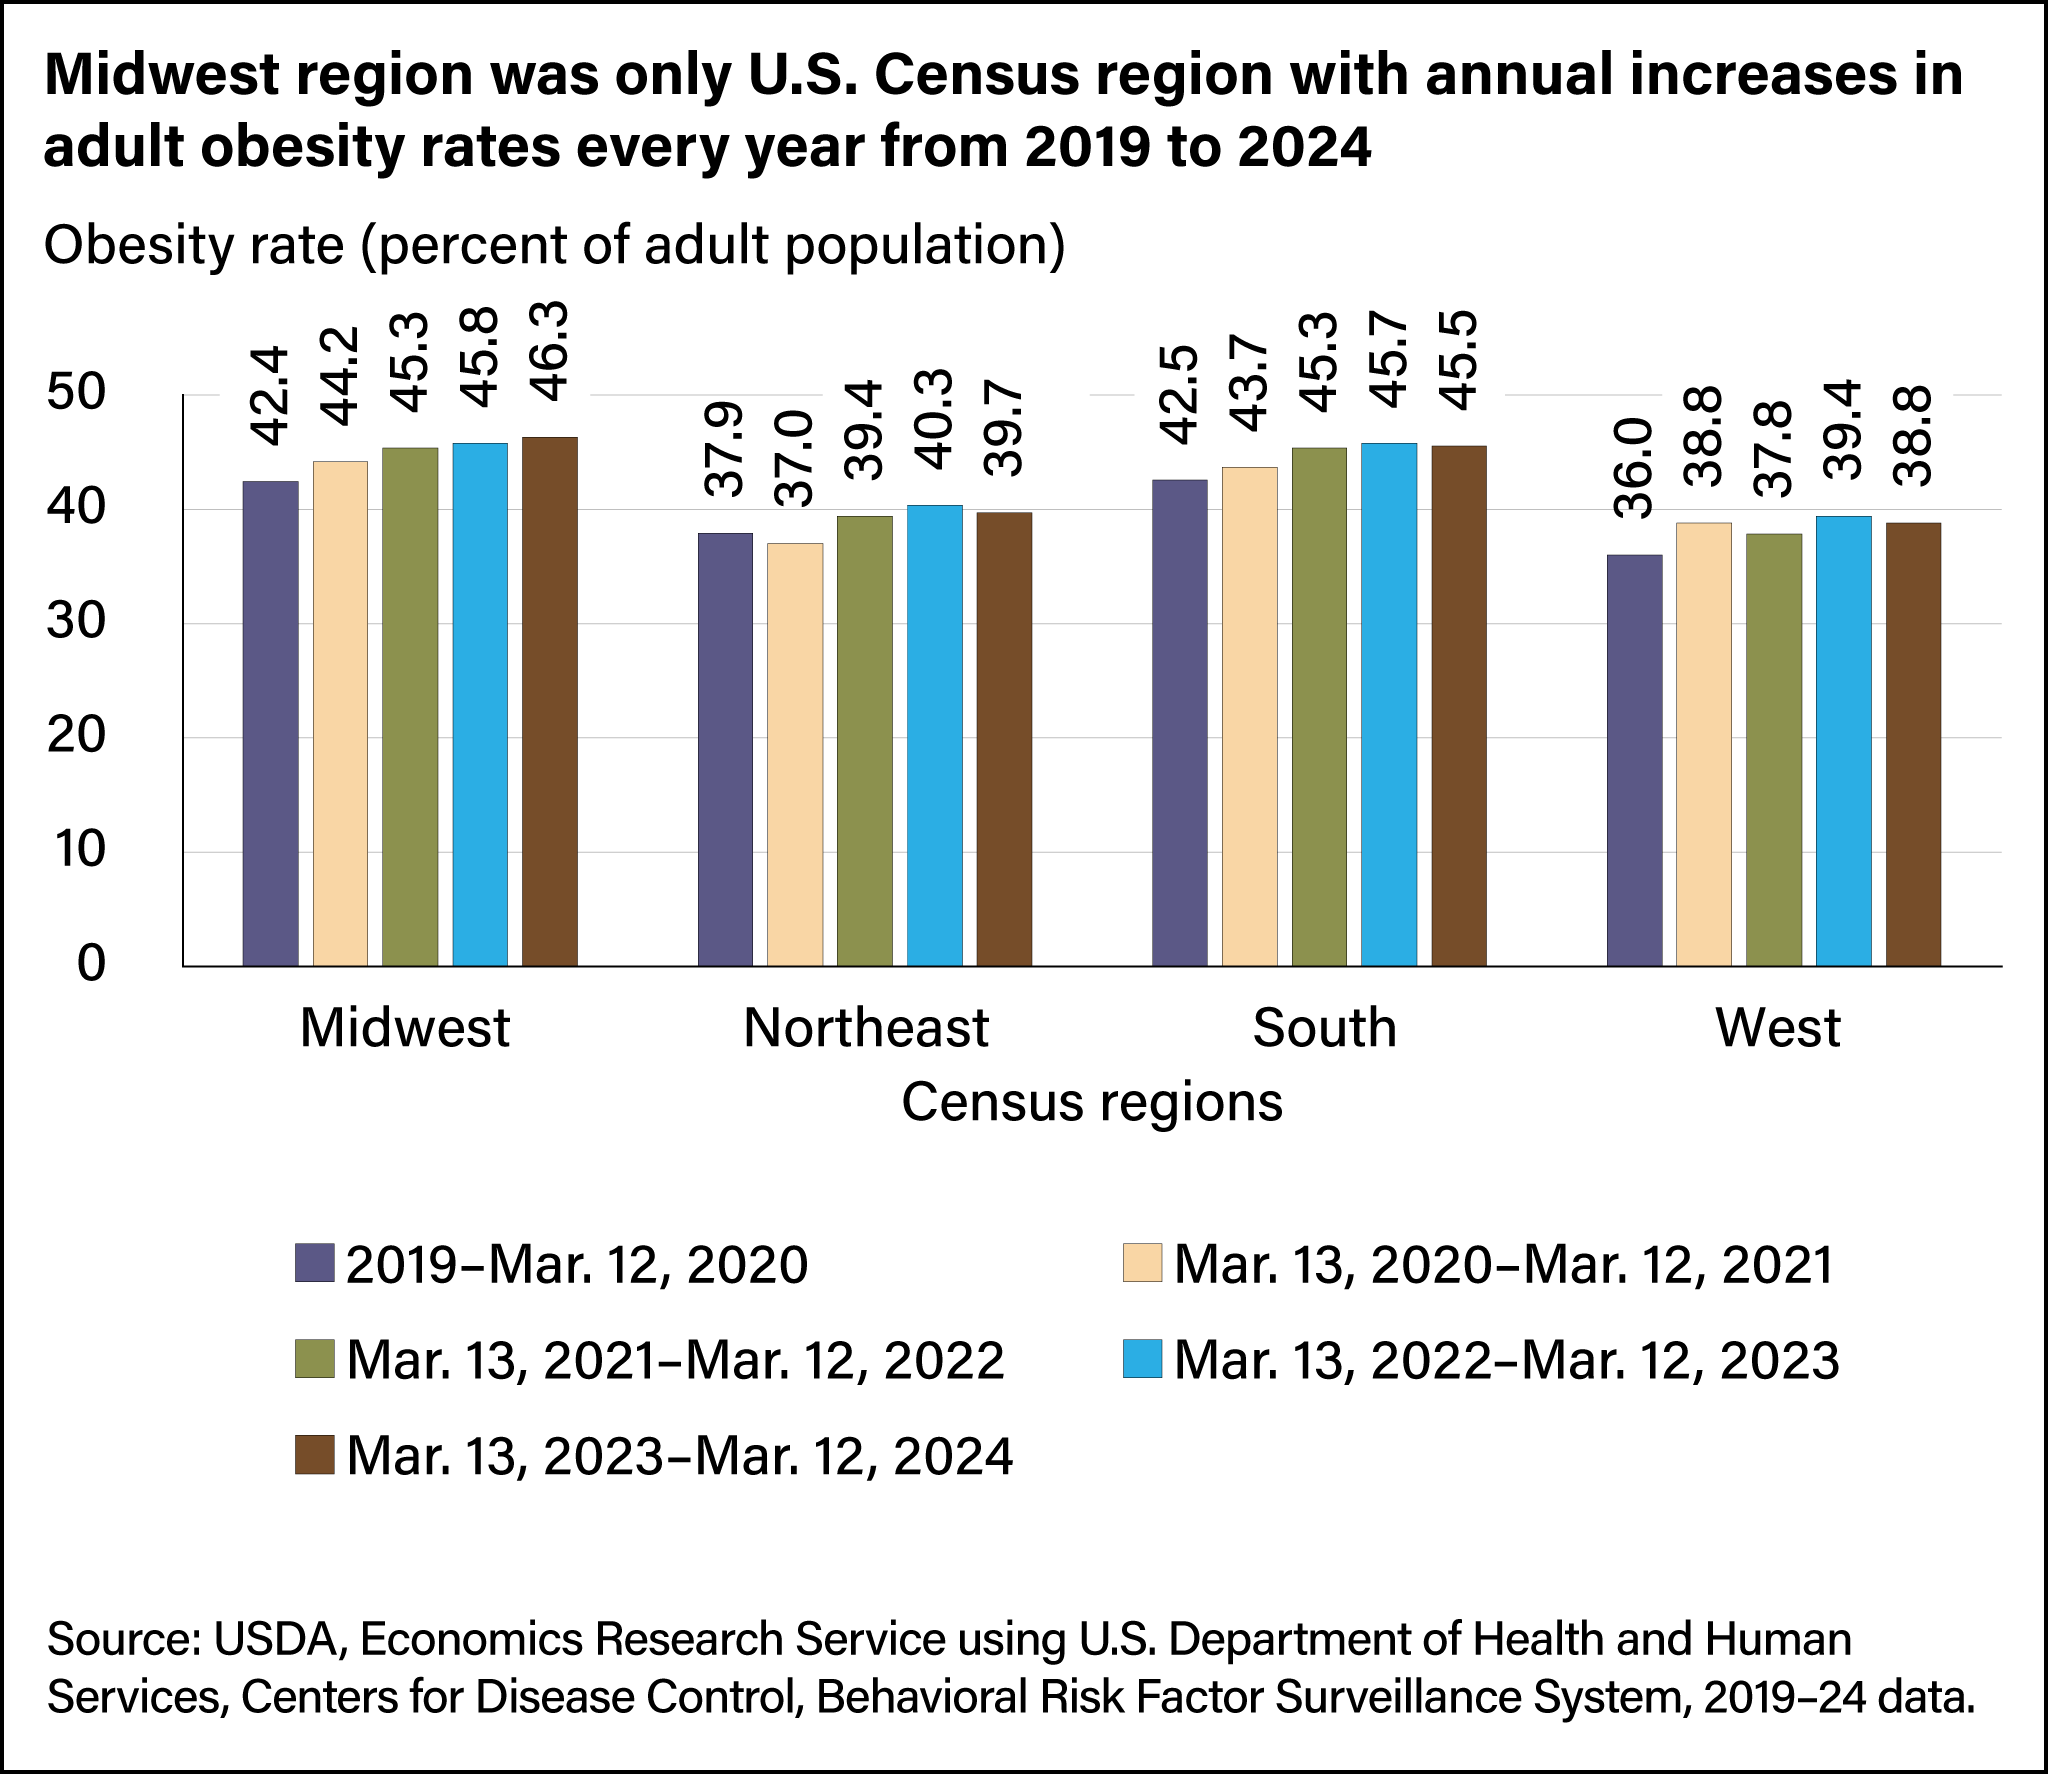
- Regional obesity rates also declined from March 2022–2023 to March 2023–2024 in all U.S. Census regions except the Midwest.
Adult obesity rates vary across U.S. geographic regions and rural/urban areas, suggesting the exposure to obesity-related diseases can differ from one location to the next. According to the National Institutes of Health, adults with obesity are more likely to develop heart disease, type II diabetes, some cancers, and other long-term health conditions. In addition to diminishing quality of life and life expectancy, these diseases increase medical costs and decrease labor force productivity, reducing economic growth potential for communities.
In the years leading up to the Coronavirus (COVID-19) pandemic, U.S. adult obesity rates generally rose, with an average year-over-year increase of 0.6 percentage point from 2011 to 2019, USDA, Economic Research Service (ERS) researchers found. Several years later, the national trend had reversed. In the year from March 2023 to March 2024, the average adult obesity rate was 43.1 percent, a 0.2-percentage-point decrease from the 43.3-percent average in the year earlier, from March 2022 to March 2023. However, an examination of obesity trends by location found adults living in rural areas had higher obesity rates than their urban counterparts in 2016, a trend that continued through 2024 even though urban and overall U.S. adult obesity rates declined.

Rural and Urban Obesity Rates Diverge
According to the U.S. Department of Health and Human Services, Centers for Disease Control and Prevention, obesity is classified for adults with a body mass index (BMI) of 30 or higher. During the COVID-19 pandemic, obesity rates changed among rural, urban, and overall populations. Before the pandemic, rural obesity rates grew faster than urban rates. By 2016, an adult living in a rural area was more than five percentage points more likely to be obese than one living in an urban area. During the first year of the pandemic (March 2020 to March 2021), the U.S. rural adult obesity rate increased by 0.4 percentage point, while the urban obesity rate rose about 3.5 times faster, by 1.4 percentage points. More recently, from March 2022–March 2023 to March 2023–March 2024, the urban adult obesity rate declined from 42.4 percent to 42.1 percent, and the rural obesity rate rose from 47.8 percent to 48.3 percent. More than 80 percent of the U.S. adult population lives in urban areas, according to the 2020 Census, so the overall adult obesity rate often reflects the urban rate more closely than the rural rate.
Variation across rural communities in health care, food retail, and physical wellness infrastructure may create a more challenging environment for adults to maintain a healthy weight. Rural adults are less likely than urban adults to have contact with and access to health care professionals and facilities. The availability of affordable healthy foods varies across urban and rural communities because of differences in distances between homes and grocery stores. Rural communities are likely to have more convenience stores, with fewer healthy food options, than grocery stores. Rural residents, especially low-income residents, live further away from and frequent grocery stores less than urban residents according to prior USDA, ERS reporting. Physical wellness activities may be limited in some rural communities because of a lack of fitness infrastructure (like a bike trail or swimming pool). Inconsistent access to spaces for regular health care, healthy food, and physical wellness may increase rural adults’ challenges to maintain a healthy weight.

Obesity Prevalence Varies Across U.S. Regions
ERS researchers also studied changes in obesity rates across the four U.S. Census regions, which consist of:
- West: Alaska, Arizona, California, Colorado, Hawaii, Idaho, Montana, Nevada, New Mexico, Oregon, Utah, Washington, and Wyoming.
- Midwest: Illinois, Indiana, Iowa, Kansas, Michigan, Minnesota, Missouri, Nebraska, North Dakota, Ohio, South Dakota, and Wisconsin.
- South: Alabama, Arkansas, Delaware, District of Columbia, Florida, Georgia, Kentucky, Louisiana, Maryland, Mississippi, North Carolina, Oklahoma, South Carolina, Tennessee, Texas, Virginia, and West Virginia.
- Northeast: Connecticut, Maine, Massachusetts, New Hampshire, New Jersey, New York, Pennsylvania, Rhode Island, and Vermont.
In early 2019, the West census region had the lowest rate of adult obesity, 36.0 percent, and the South had the highest at 42.5 percent. In the first year of the pandemic (March 2020 to March 2021), the West saw the greatest increase in adult obesity rates, rising from 36.0 percent to 38.8 percent, a 2.8-percentage-point increase. At the same time, adult obesity rates decreased in the Northeast from 37.9 percent to 37.0 percent. Obesity rates grew more slowly across all regions from March 2021 to March 2023. By March 2024, obesity rates had declined in all regions except the Midwest, where the rate grew to 46.3 percent from 45.8 percent.

National Obesity Trends Are Not Uniformly Reflected across Geography
After decades of increasing, U.S. changes in adult obesity rates have been less predictable in recent years. Obesity rate trends also vary by geography, and the reasons why are not well understood. Population responses to unexpected societal shocks, such as the COVID-19 pandemic, vary by location. Reduced healthcare, grocery store, and fitness facility access are factors that may differ for adults in rural areas versus those in urban areas or in different regions of the country and are potential factors for future research. Differences in U.S. adult obesity rates may continue to shift at different rates across geographic areas, which may contribute to greater differences in disease and healthcare needs between the areas.
This article is drawn from:
- Ehmke, M. & Restrepo, B.J. (2023). COVID-19 Working Paper: Obesity Prevalence Among U.S. Adult Subpopulations During the First Year of the COVID-19 Pandemic. U.S. Department of Agriculture, Economic Research Service. AP-115.
You may also like:
- Obesity. (n.d.). U.S. Department of Agriculture, Economic Research Service.
- Food Choices & Health. (n.d.). U.S. Department of Agriculture, Economic Research Service.
- Rhone, A., Ver Ploeg, M., Williams, R. & Breneman, V. (2019). Understanding Low-Income and Low-Access Census Tracts Across the Nation: Subnational and Subpopulation Estimates of Access to Healthy Food. U.S. Department of Agriculture, Economic Research Service. EIB-209.
- Restrepo, B.J. (2022). Obesity Prevalence Among U.S. Adults During the COVID-19 Pandemic. American Journal of Preventive Medicine.

