Global Changes in Agricultural Production, Productivity, and Resource Use Over Six Decades
- by Keith Fuglie, Stephen Morgan and Jeremy Jelliffe
- 9/30/2024
Highlights
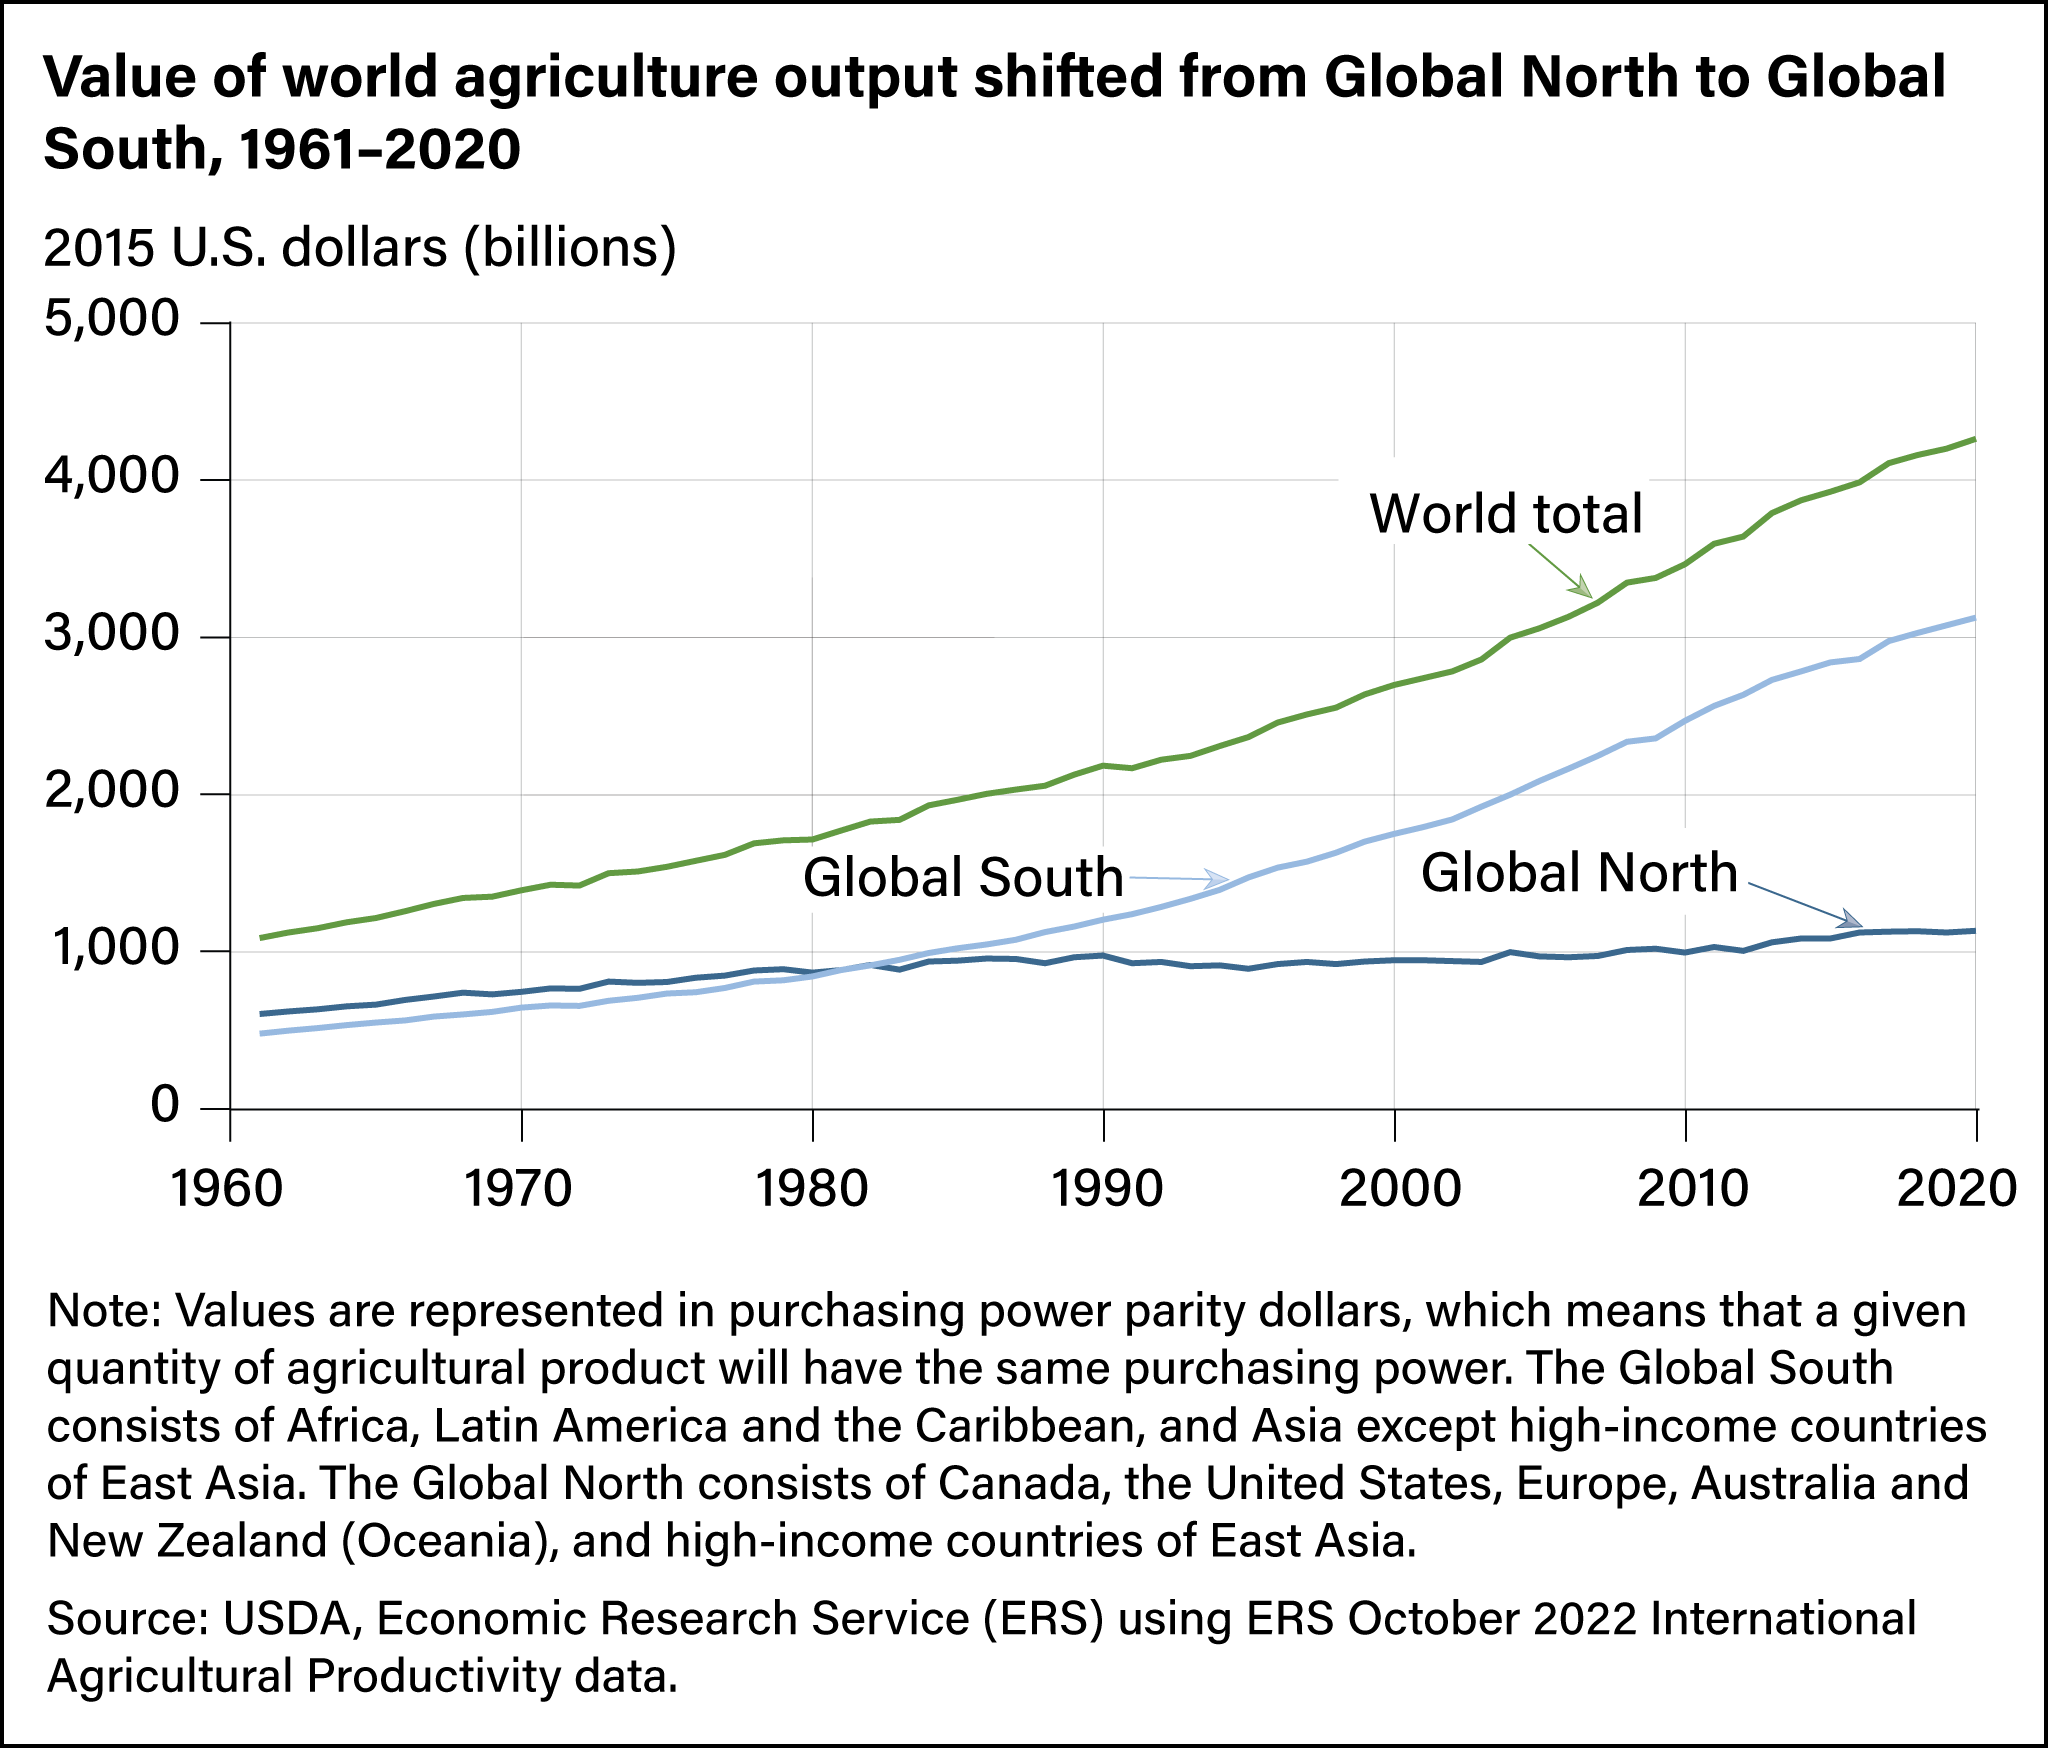
- Between 1961 and 2020, world agricultural output increased by nearly fourfold with most of the increase in the Global South, while agricultural output in the Global North has remained roughly constant since the 1990s.
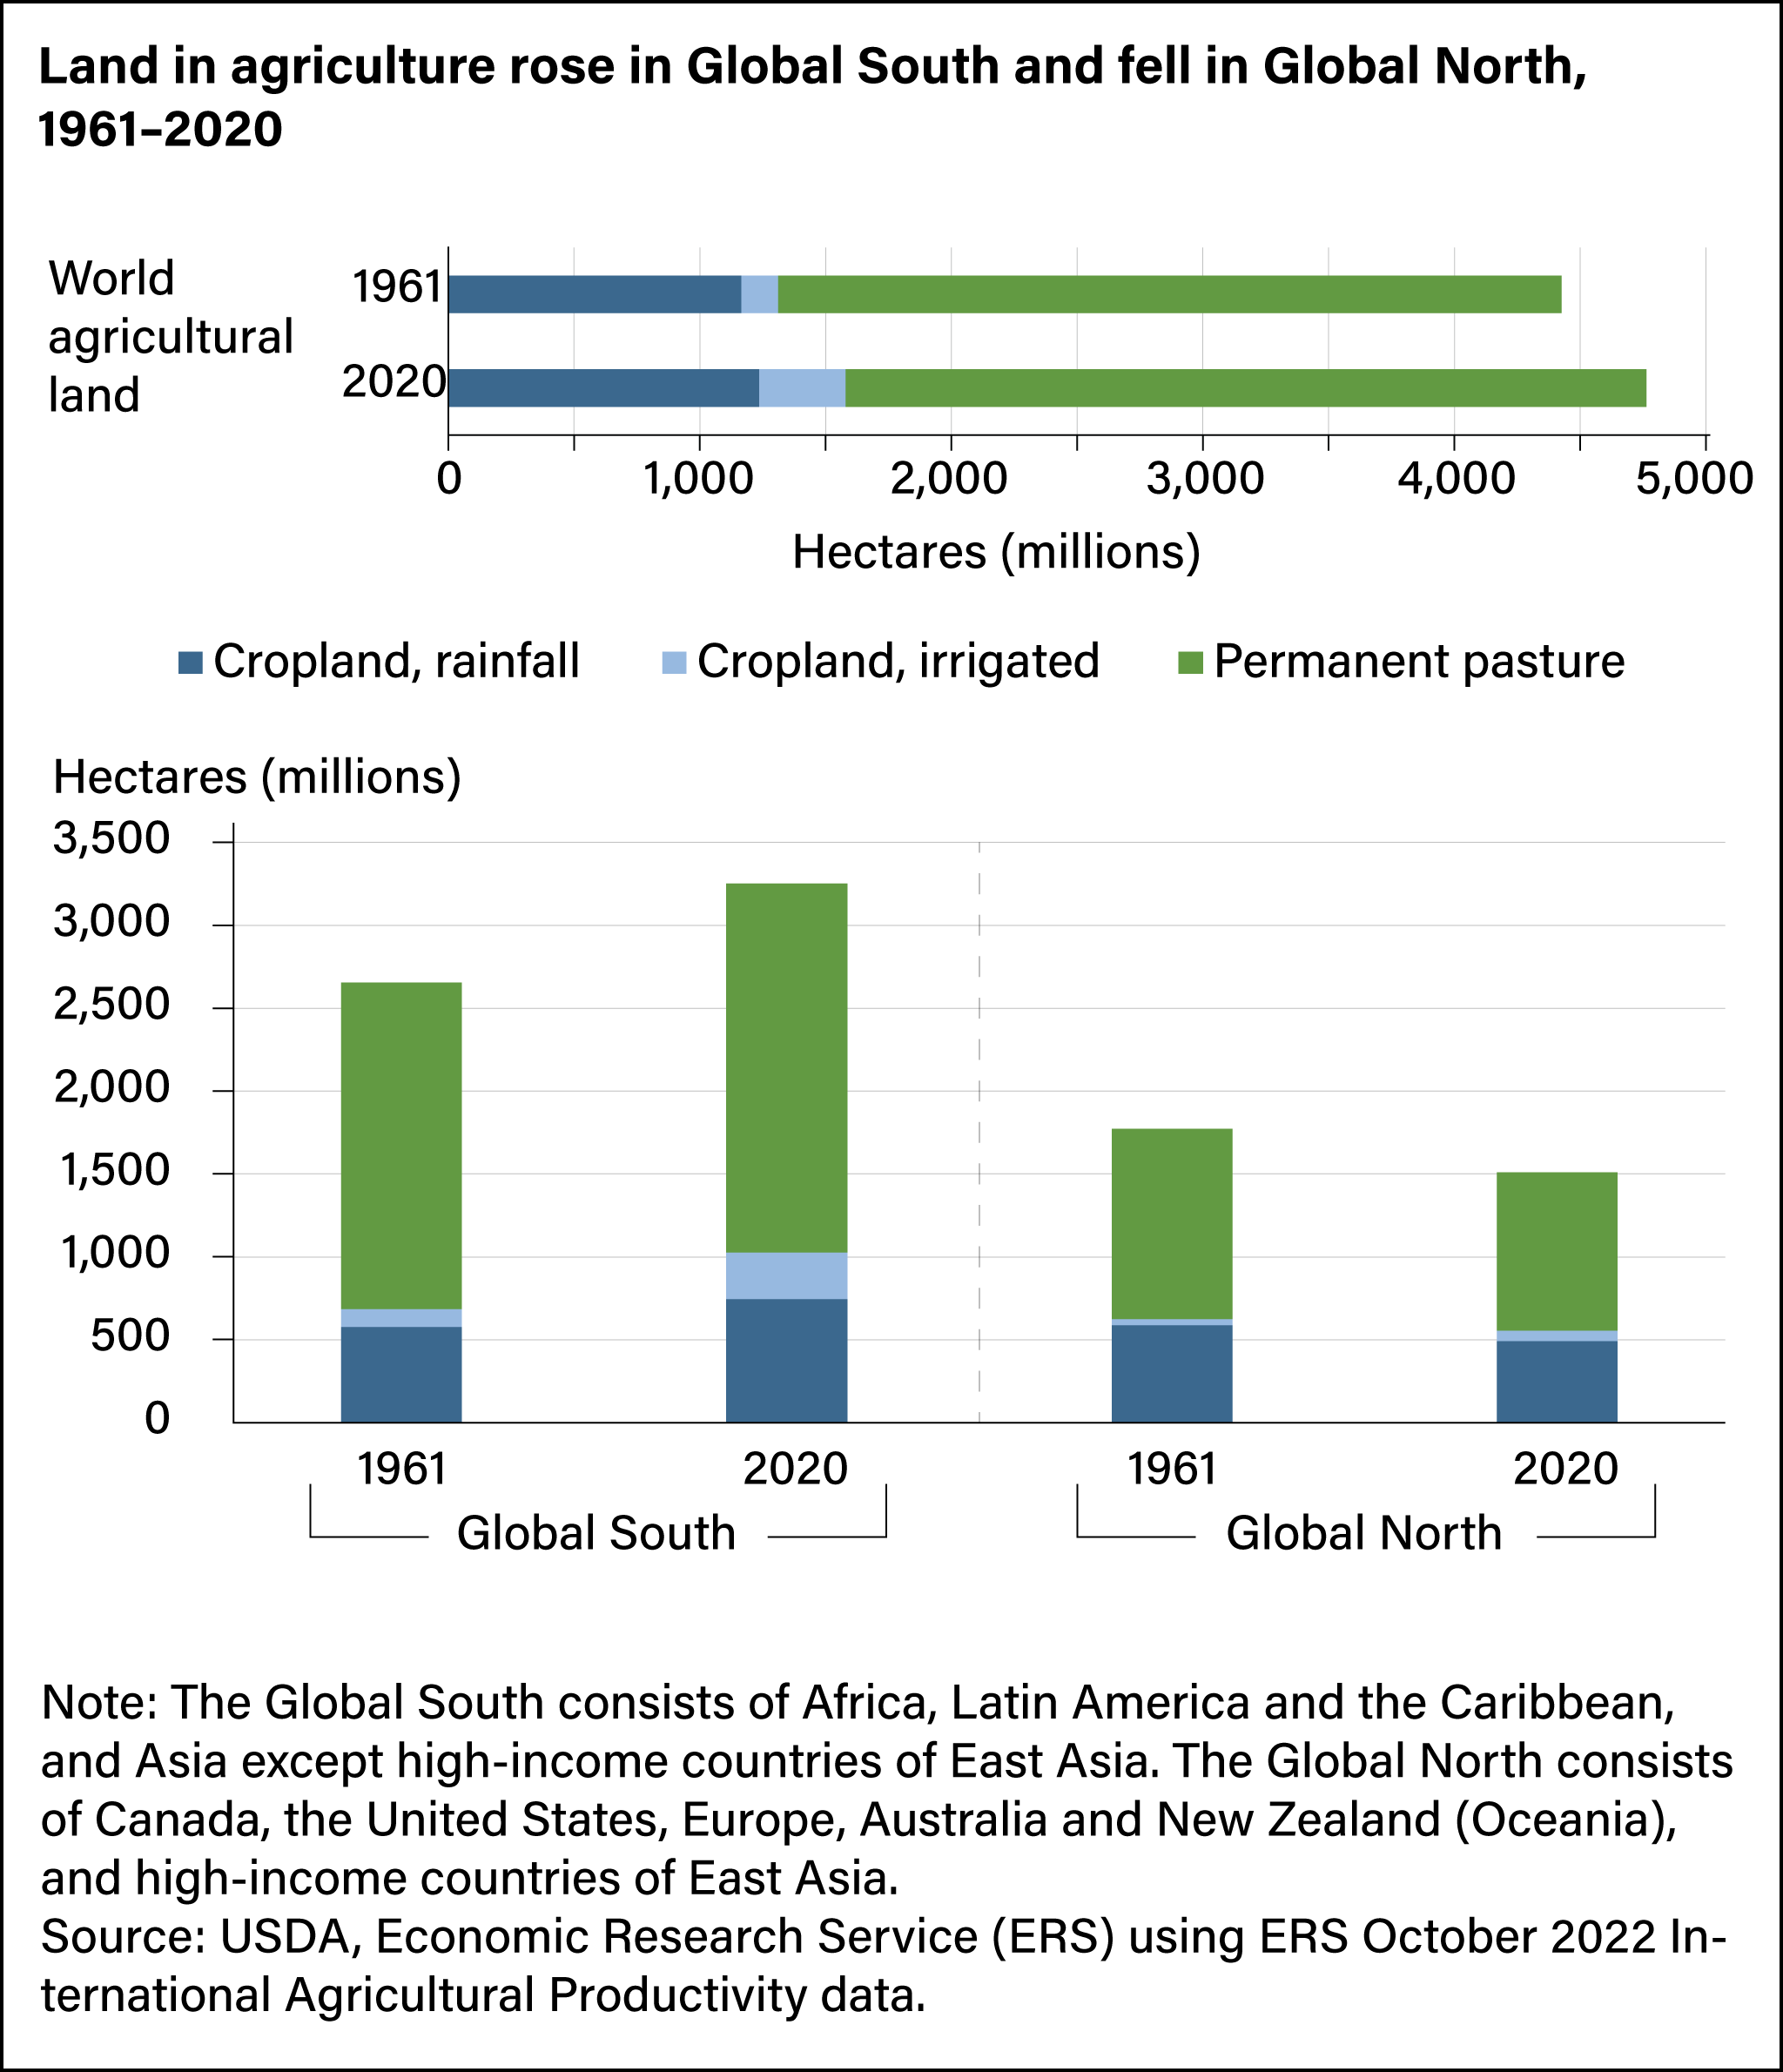
- Agricultural land area expanded 7.6 percent between 1961 and 2020 and currently occupies 32 percent of the world’s land area. Irrigated area more than doubled.
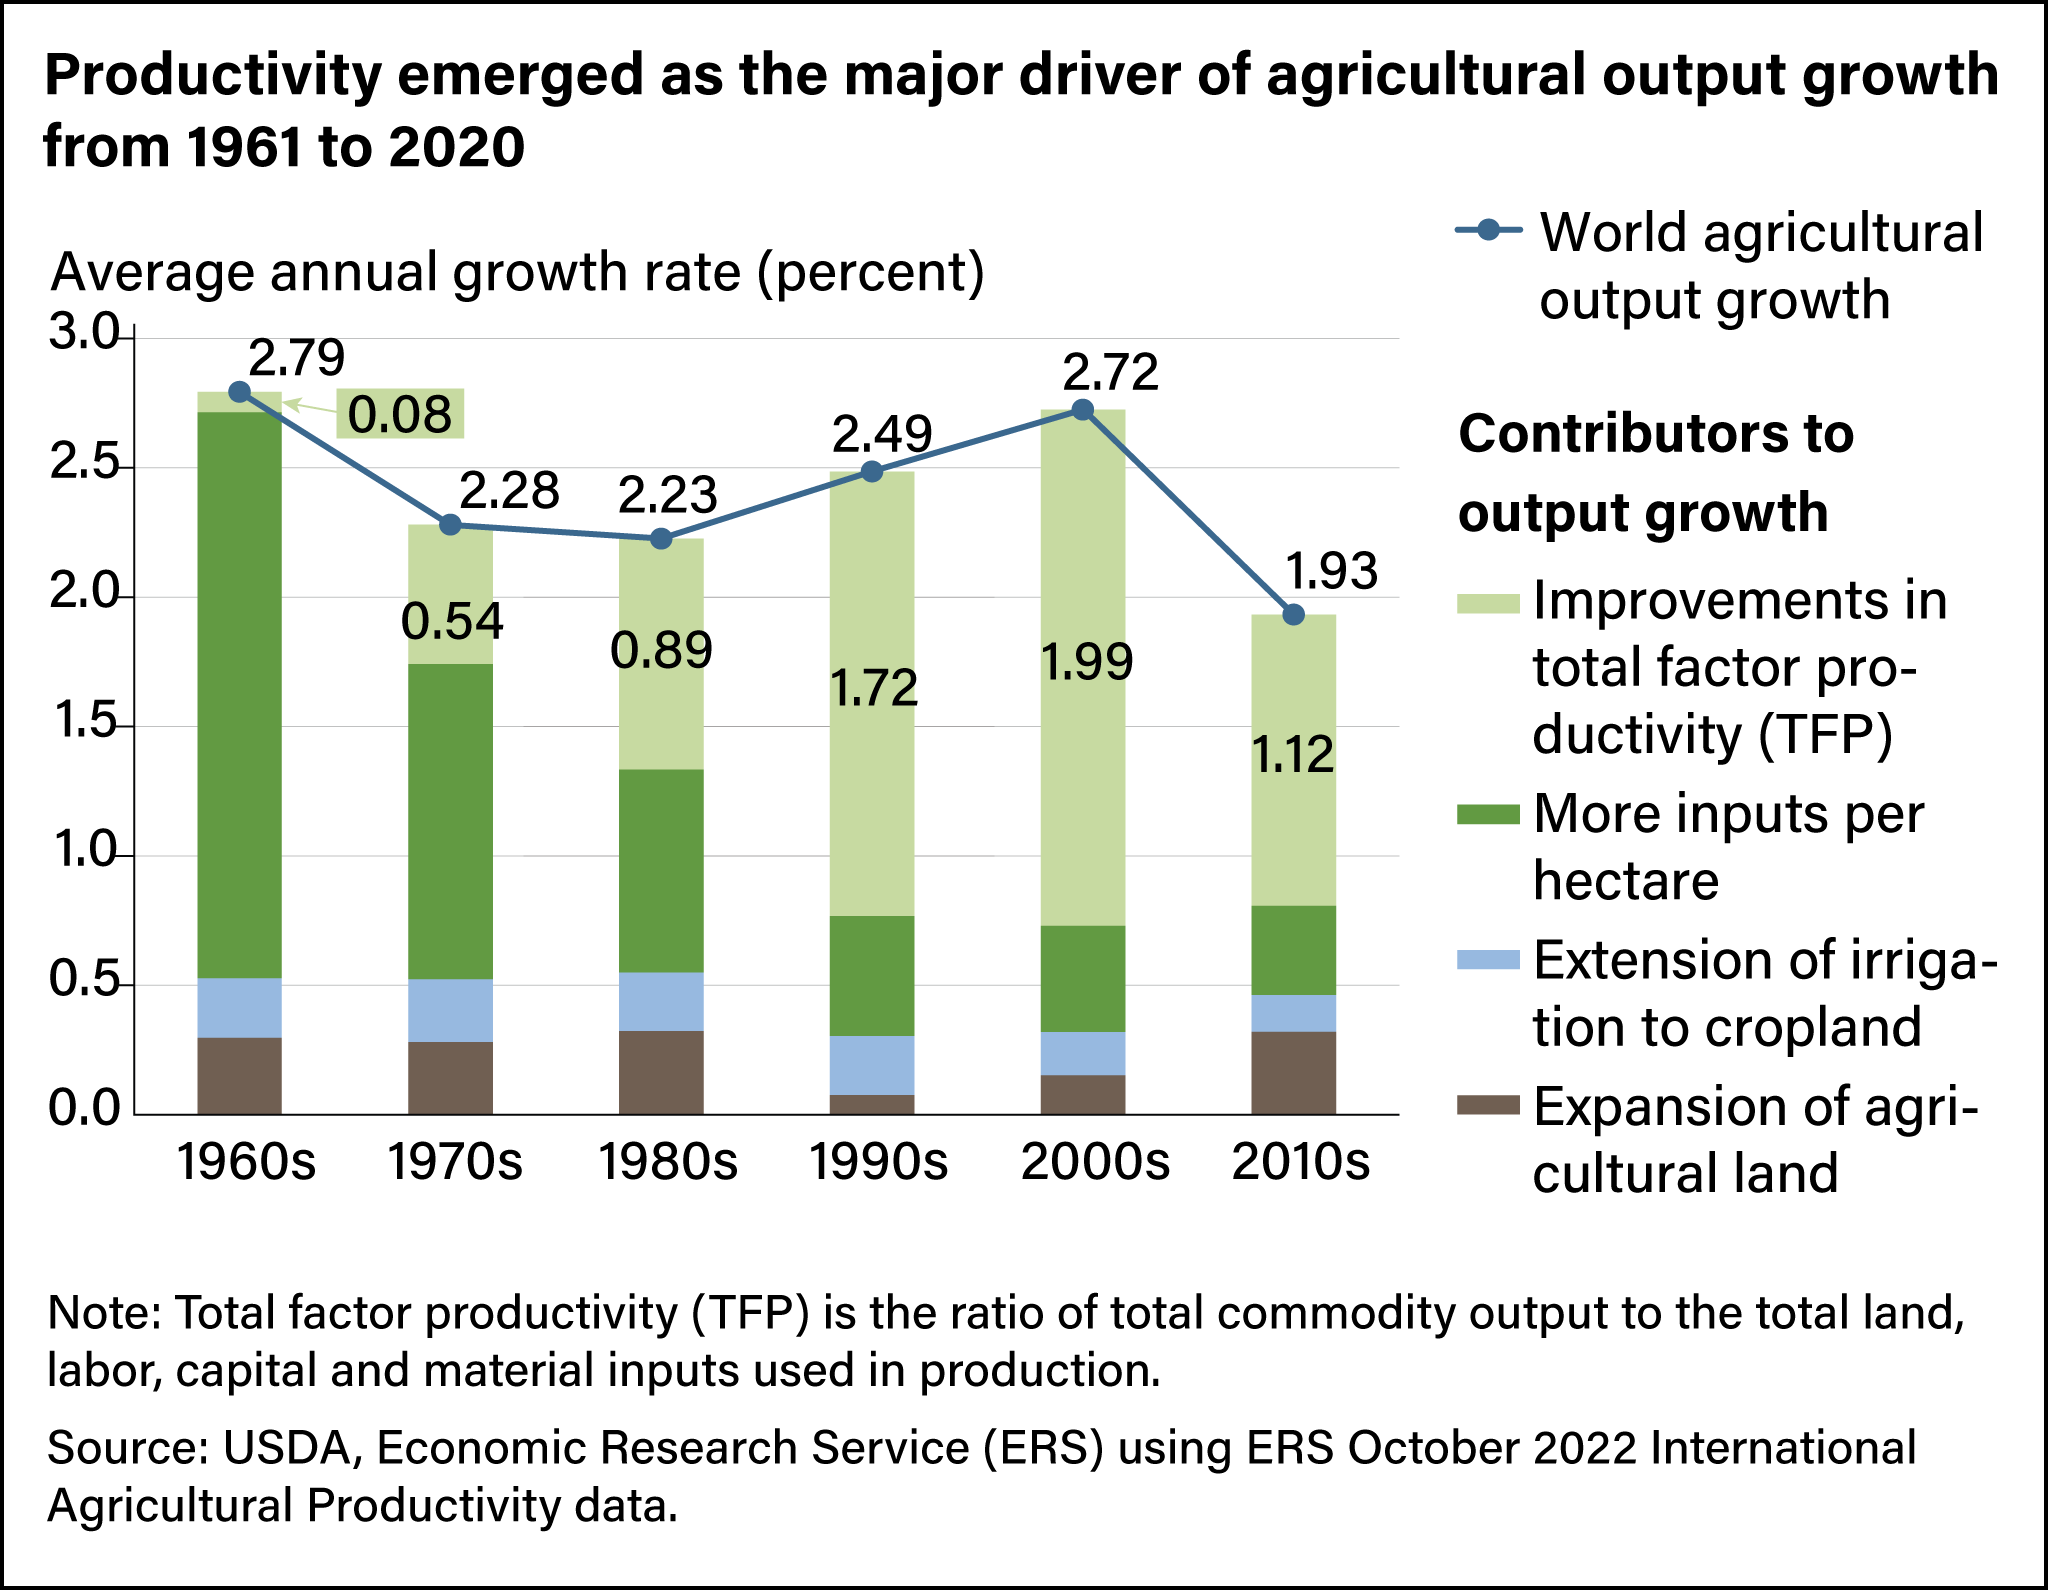
- Since the 1990s, increases in agricultural total factor productivity (the amount of output per unit of land, labor, capital and material inputs) has become the major driver of world agricultural output.
- Higher global agricultural productivity has led to fewer natural and environmental resources being used per unit of agricultural production on average worldwide.
From 1961 to 2020, the global agricultural sector underwent vast transformations in production, productivity, and resource use. Agricultural output increased nearly fourfold, and global population grew 2.6 times, resulting in a 53-percent increase in agricultural output per capita. Food prices, adjusted for inflation, declined compared with overall prices, allowing global diets to be more affordable and diverse. The global commodity mix also evolved as farm production shifted from a focus on cereal grains and root and tuber crops to a larger share of oil crops, poultry, swine, and aquaculture.
Over the past six decades, world production of crops, livestock, and aquaculture commodities grew from a gross value of $1.1 trillion to $4.3 trillion (2015 dollars). Most of the growth was achieved by bringing new resources into the production process, intensifying the use of inputs such as fertilizers and labor, and improving the efficiency with which resources were used. As global agricultural productivity has risen, fewer natural and environmental resources per unit of agricultural production have been used.
World Agricultural Production Shifted to the Global South
In the 1960s and 1970s, agricultural output was evenly divided between the Global South (Africa, Latin America, and Asia other than high-income countries in East Asia) and the Global North (Europe, Australia and New Zealand, high-income East Asia, Canada, and the United States). Since the 1980s, agriculture has expanded more rapidly in the Global South, stimulated by rising world population, shifts in food demand, technological advancements, and policy changes, and stayed mostly constant in the Global North. By 2020, the Global South accounted for 73 percent of agriculture production across the world, up from 44 percent in 1961. The Global North’s share, however, fell to 27 percent from 56 percent in 1961.
Agricultural land area, which includes rainfed and irrigated cropland and land kept as permanent pasture for grazing livestock, increased by 7.6 percent to 4.76 billion hectares by 2020, accounting for 32 percent of the world’s total land area. Even with this overall increase, regional trends are worth noting. For example, across the Global South, agricultural land use expanded by 597 million hectares and shrank in the Global North by 260 million hectares. Total irrigated area increased from 147 million hectares in 1961 to 343 million hectares in 2020. Approximately 87 percent of the increase in irrigated area occurred in the Global South. By 2020, nearly 22 percent of global cropland was equipped for irrigation.
A Shift Away from Labor and Land
In addition to expanded use of agricultural land and irrigation, major technological advancements developed for global farming. In the 1960s’ Green Revolution, the development of crop genetics resulted in improved yields. Since the late 1990s, new biotechnology and genetically modified crops introduced pest and disease resistance. Advances in genetics, health, and husbandry practices promoted animal and aquaculture well-being. Improvements in farm mechanization and automation along with the use of manufactured inputs such as synthetic fertilizers, agricultural chemicals, animal feed concentrates, and farm machinery made it easier to produce more with available land and with less labor.
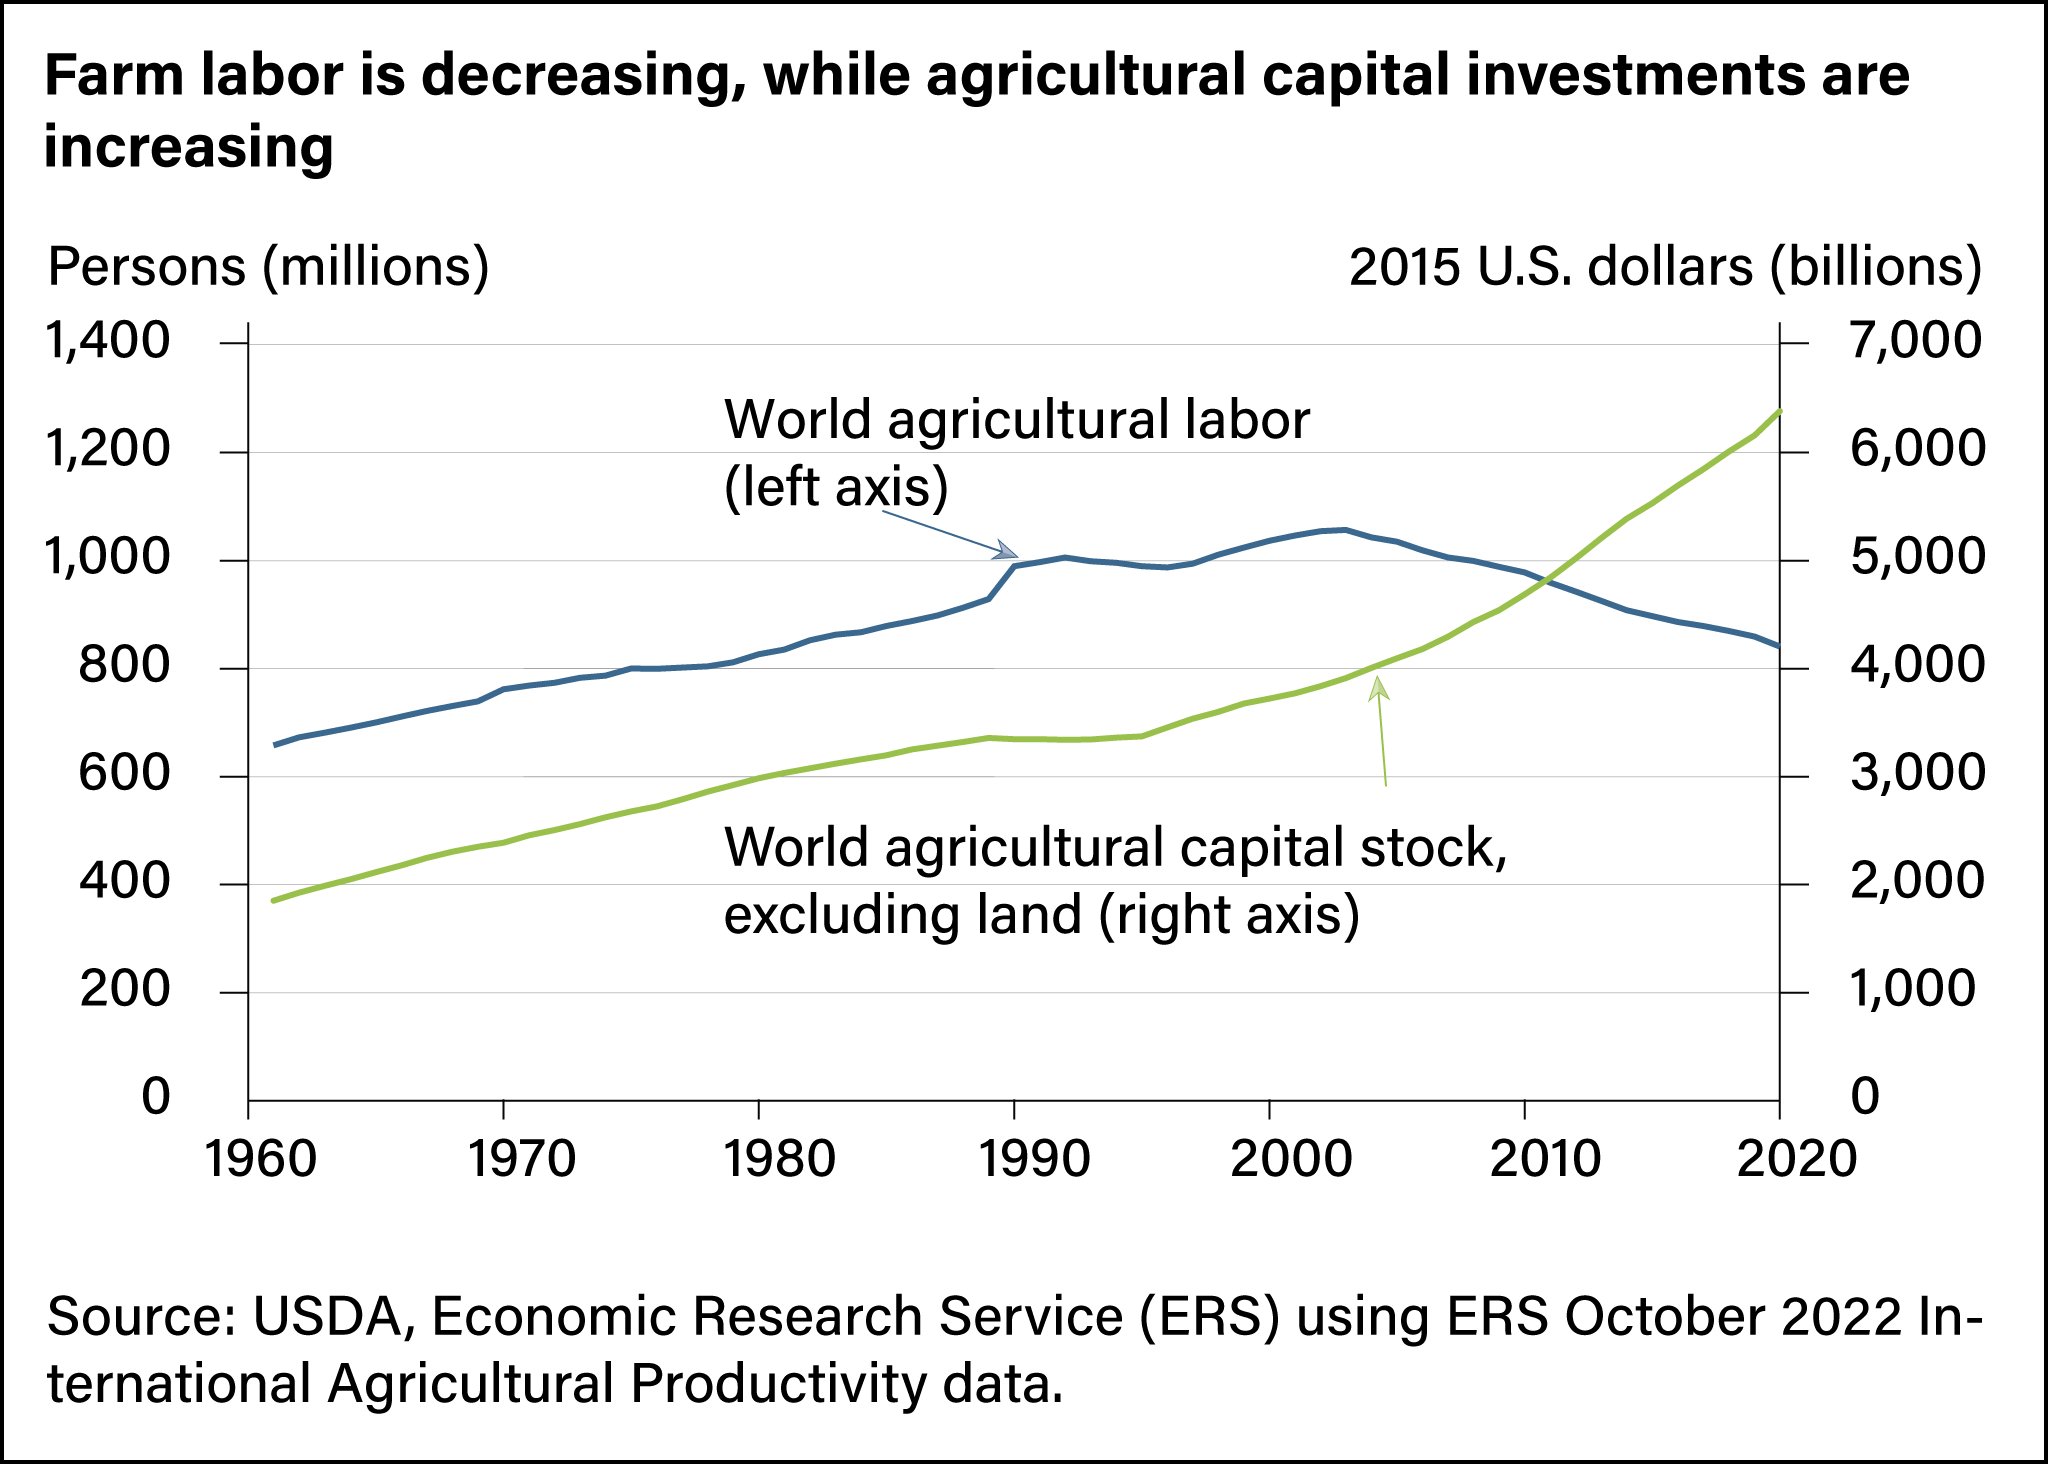
The number of people working on farms around the world peaked in 2003 at just over 1 billion and by 2020 had declined to 841 million. Farms used more capital inputs to replace labor (see the chart below). In agriculture, capital is the accumulated value of investment in structures, machinery, breeding stock, and crop trees, discounted for depreciation as these things age. Improvements in equipment such as tractors reduced the number of hands needed to complete certain tasks, including land preparation, seeding, spraying, and harvesting. For many farms, this meant the average number of workers remained consistent at one to two workers per farm even while the size of operations grew.
These advancements also coincided with the expanded use of fertilizer and chemical materials in crop production. The use of synthetic nitrogen fertilizers grew especially rapidly, from around 12 million metric tons in 1961 to 112 million metric tons in 2020. Meanwhile, as global diets shifted toward animal proteins, the use of animal feed concentrates and veterinary pharmaceuticals in animal production grew. Animal feeds have shifted to include more nutrient-dense diets, which in turn increased global demand for oilseeds. When oilseeds are crushed to extract vegetable oils, the leftover meals provide a protein-rich component of animal feed concentrates.
Productivity Became the Main Source of Growth in World Agriculture
Over time, the main contributor to global agricultural growth shifted from land and labor resources to efficiency-led improvements in productivity. From 1961 to 1990, agricultural output growth primarily resulted from the use of more land, labor, and material inputs. However, from 1990 to 2020, most of the agricultural output growth was driven by advancements in how those resources were used. Total factor productivity, or TFP, is a metric that reflects the overall efficiency with which farmers use inputs such as land, labor, and capital to produce crops and livestock (see box at end of article). Several factors increased productivity, including the adoption of improved technology and farming practices.
From 1961 to 2020, global agricultural output grew at an average annual rate of 2.3 percent. However, that growth slowed during the most recent decade. From 2011 to 2020, agricultural output grew 1.93 percent annually compared with 2.72 percent from 2001 to 2010. The slowdown mostly can be attributed to a decline in total factor productivity growth. Between the decades 2001–10 and 2011–20, annual total factor productivity growth fell by nearly half, from 1.99 percent to 1.12 percent. The rate of land expansion also grew during this time, although this measure remains a relatively small driver of growth.
Agricultural Productivity Growth Reduced Use of Natural and Environmental Resources
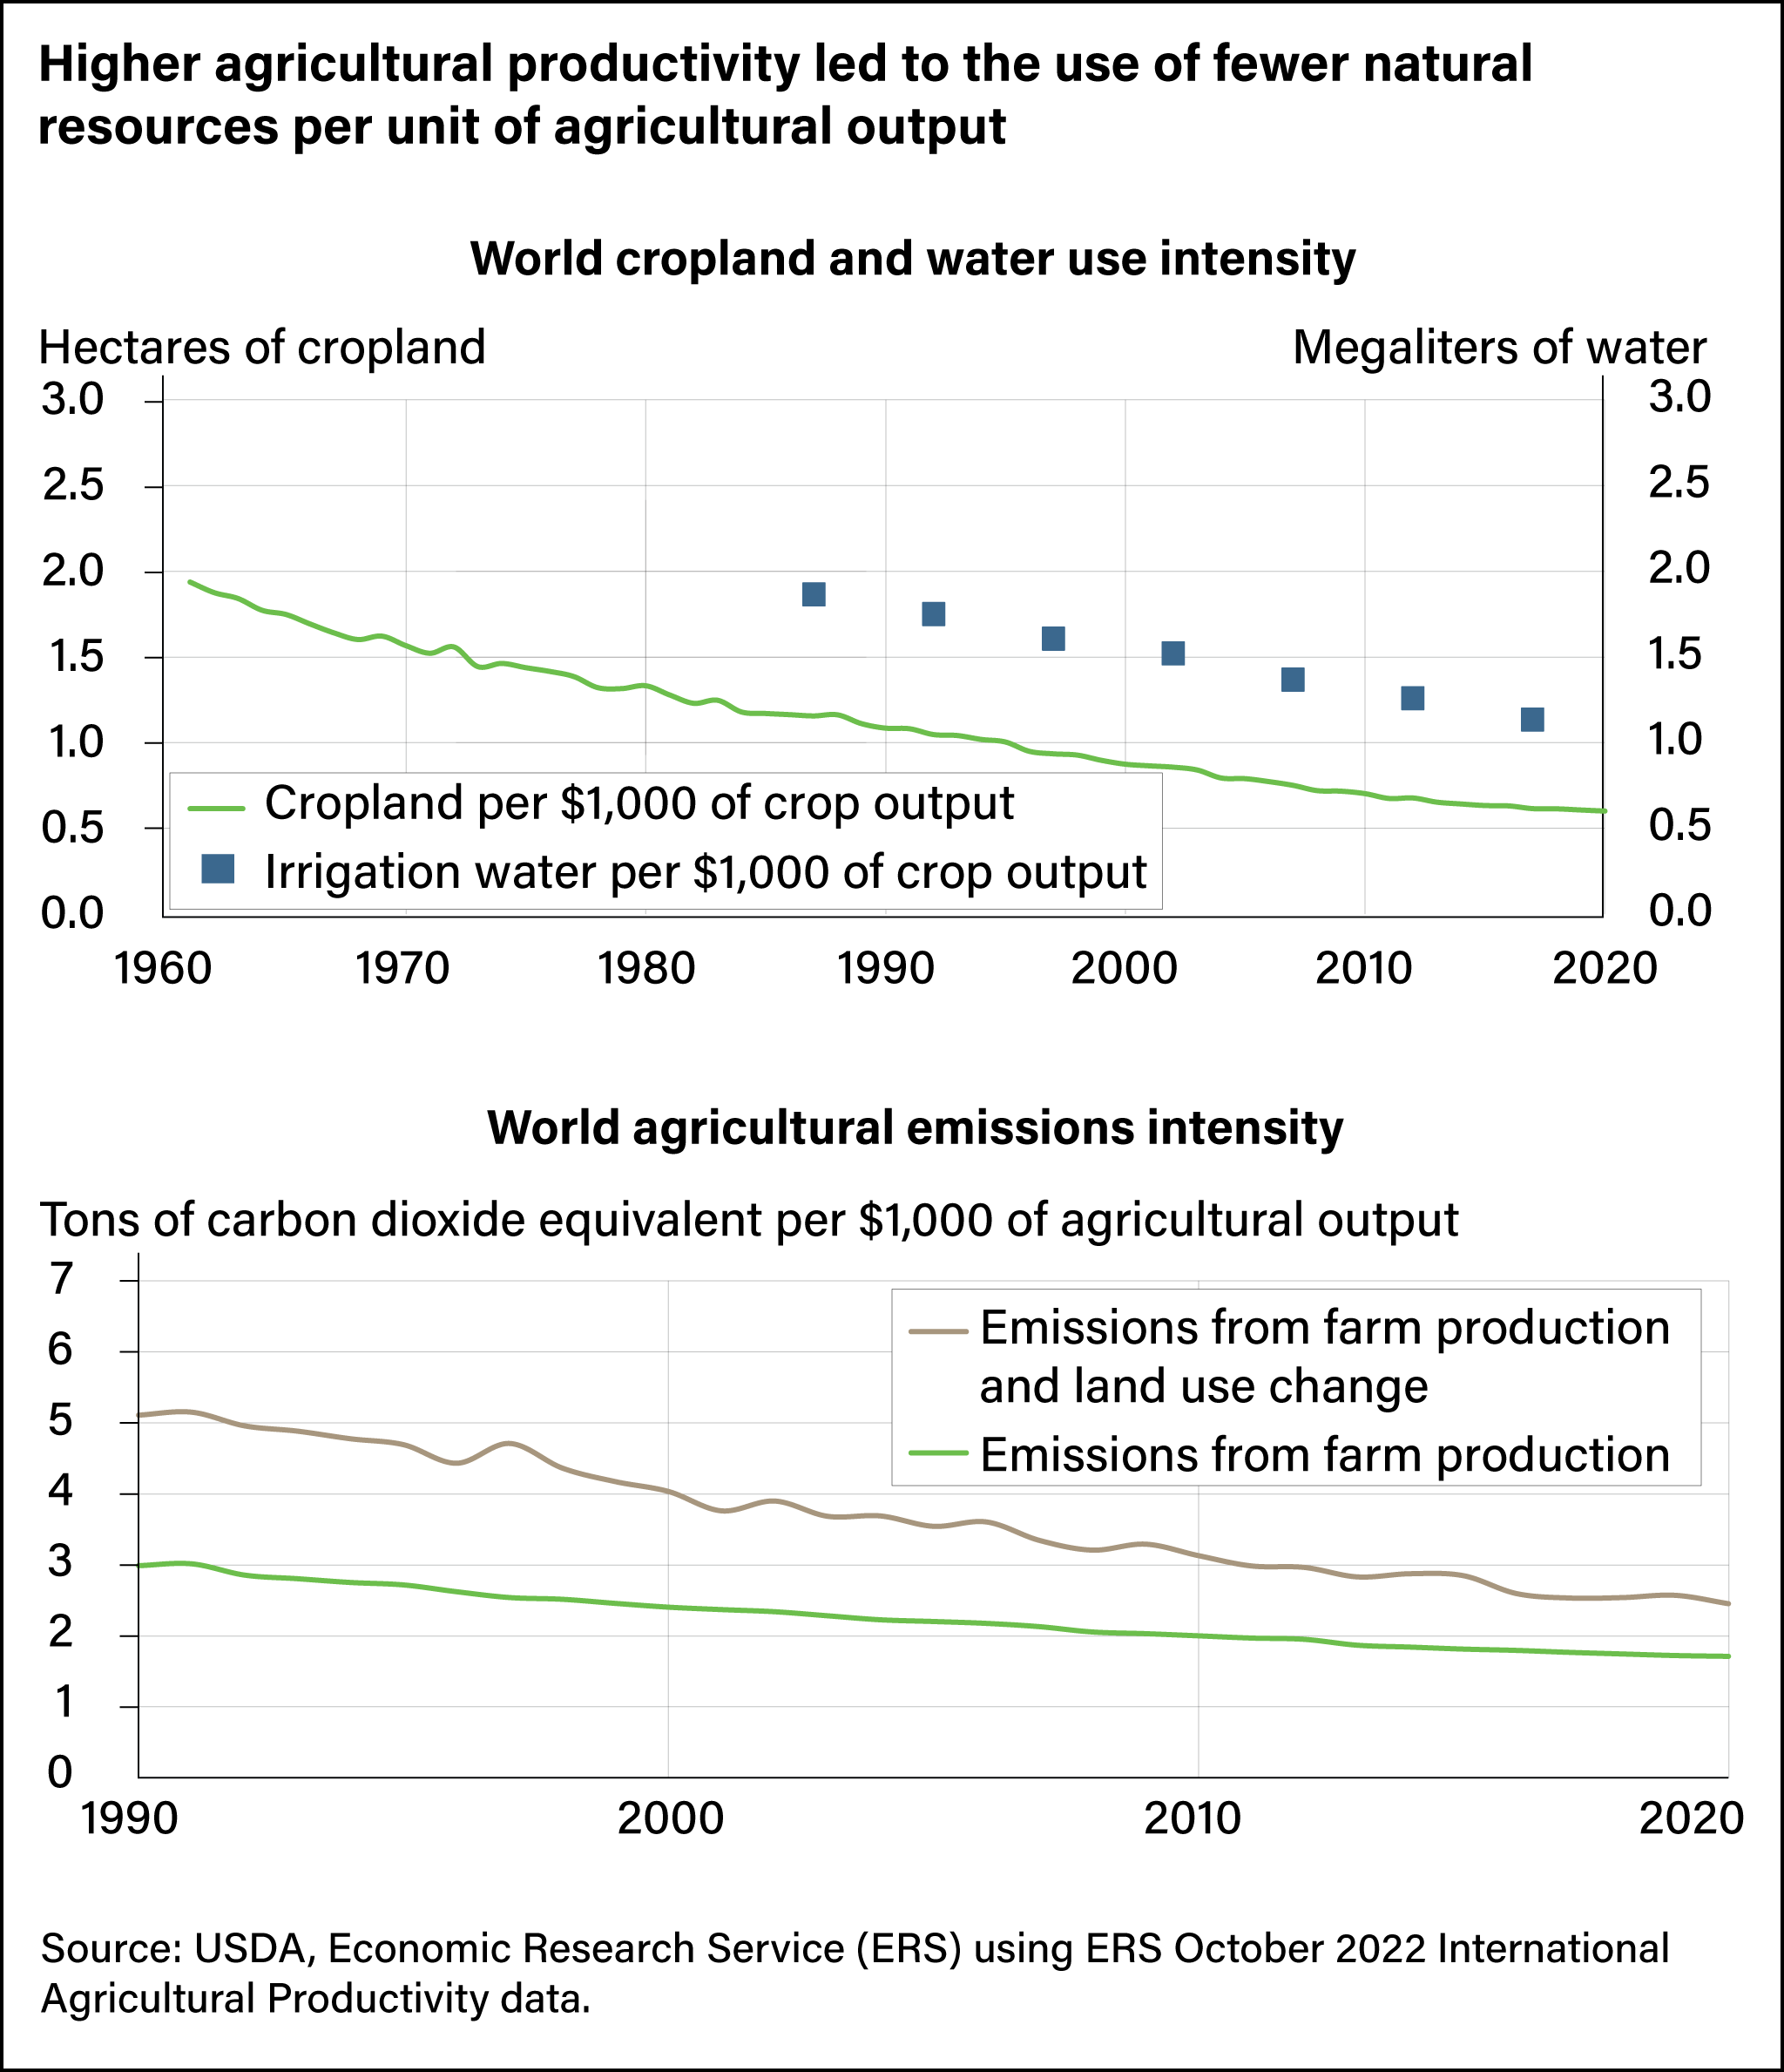
One result of productivity growth is that it reduced the amount of resources used or emitted for every unit of agricultural output, known as resource-use intensity. These efficiency improvements are due to a combination of factors, including adoption of improved technologies and practices, farm specialization, and concentration of production in the most agriculturally favorable environments. From 1990 to 2020, the amount of cropland needed to produce $1,000 of crop commodities such as rice, corn, and wheat declined by nearly half, from 1.1 hectares to 0.6 hectares (and down from 1.9 hectares in 1961). The amount of irrigation water applied to obtain $1,000 of crop output also was reduced, from 1.8 megaliters in 1991–95 to 1.1 megaliters in 2016–2020 (see chart below). In some countries, the use of irrigation water has shifted to more high-value crops and less arid areas, which contributed to a rise in the average value of output per volume of irrigation water applied.
Achieving higher output per unit of land and irrigation water used may involve employing more of other inputs—like labor, capital, and fertilizers—per hectare. Input intensification is sometimes linked with the degradation of natural resources, increased risk of excess nutrient runoff into water bodies, elevated greenhouse gas emissions, and a loss of biodiversity. However, the gradual transition to productivity-led growth in world agriculture appears to have resulted in reduced use-intensity for some environmental resources. For example, from 1990 to 2020, greenhouse gas emissions from agriculture per $1,000 of output fell by more than half as measured by tons of carbon dioxide equivalents, which aggregate the combined effect on global warming of carbon dioxide and other emissions related to farm production. Lower rates of land-use conversion and improved farm production efficiency have contributed to reduced agricultural greenhouse gas emissions.
The close association between total factor productivity growth and improved economic and environmental performance show how productivity-led growth can be leveraged for sustainable and resilient growth in agriculture. However, at the global level, improvements in agricultural productivity have not been rapid or universal enough to make a significant dent in the effect of agriculture on the environment. This is especially true in regions where agricultural productivity remained low or stagnant. Total factor productivity growth is coming under strain, slowing significantly in the decade from 2011 to 2020. The effects of a prolonged slowdown or stagnation in agricultural productivity could affect food prices, the expansion of agriculture into more natural lands, and global food security.
This article is drawn from:
- Fuglie, K., Morgan, S. & Jelliffe, J. (2024). World Agricultural Production, Resource Use, and Productivity, 1961–2020. U.S. Department of Agriculture, Economic Research Service. EIB-268.
You may also like:
- Morgan, S., Fuglie, K. & Jelliffe, J. (2022, December 5). World Agricultural Output Growth Continues to Slow, Reaching Lowest Rate in Six Decades. Amber Waves, U.S. Department of Agriculture, Economic Research Service.
- Data Training Webinar: U.S. and International Agricultural Productivity. (n.d.). U.S. Department of Agriculture, Economic Research Service.
- International Agricultural Productivity. (n.d.). U.S. Department of Agriculture, Economic Research Service.
- Fuglie, K., Morgan, S. & Jelliffe, J. (2023, December 7). World Agricultural Output and Productivity Growth Have Slowed. Amber Waves, U.S. Department of Agriculture, Economic Research Service.


