Coronavirus (COVID-19) Pandemic Transformed the U.S. Federal Food and Nutrition Assistance Landscape
- by Leslie Hodges, Jordan W. Jones and Saied Toossi
- 10/4/2021
Highlights
- The Coronavirus (COVID-19) pandemic and subsequent economic recession in 2020 led to significant changes to existing USDA food and nutrition assistance programs and the creation of two temporary food assistance programs.
- Spending on USDA’s domestic food and nutrition assistance programs reached a historical high of $122.1 billion in fiscal year 2020 due to a sharp increase in spending beginning in March 2020 (data as of January 2021 and subject to revision).
- USDA, Economic Research Service’s<em> Food and Nutrition Assistance Landscape: Fiscal Year 2020 Annual Report</em> provides information on program spending and participation from October 2019 through September 2020, a key time for understanding how the food assistance landscape changed with the onset of the pandemic.
The Coronavirus (COVID-19) pandemic brought daily life in the United States to a halt in March 2020. To slow the spread of the virus, the U.S. Government declared a national public health emergency and State and local governments issued stay-at-home orders. With businesses, schools, and other facilities closed throughout the country, economic conditions quickly declined. The unemployment rate surged from 4.4 percent in March 2020 to 14.7 percent in April 2020, according to the U.S. Bureau of Labor Statistics. The abruptness of job losses and school closures created an unprecedented need for Federal food assistance. According to USDA, 1 in 10 adults reported sometimes or often not having enough to eat in early May 2020. At the same time, social distancing measures required unprecedented flexibility in providing this assistance.
The Federal Government responded to the pandemic with legislation that provided billions of dollars to USDA food and nutrition assistance programs and allowed USDA to adjust program operations to protect the health and safety of program participants and staff. Major changes to the food and nutrition assistance landscape in fiscal year (FY) 2020 included the creation of two temporary programs and the expansion of Supplemental Nutrition Assistance Program (SNAP) benefits through emergency allotments. Additionally, the four largest child nutrition programs experienced major transformations. Much of the food and nutrition assistance for children typically provided by school meal programs shifted to summer meal programs and to the newly created Pandemic Electronic Benefit Transfer (P-EBT) program. As a result of these changes, Federal spending on food and nutrition assistance amounted to a historic high of $122.1 billion in FY 2020 (data as of January 2021 and subject to revision).
Researchers at USDA, Economic Research Service (ERS) document trends in food and nutrition assistance program participation and spending each fiscal year using data collected by USDA, Food and Nutrition Service (FNS). The Food and Nutrition Assistance Landscape: FY 2020 Annual Report describes participation and spending in USDA’s largest food and nutrition assistance programs leading up to and during the early months of the pandemic. It documents how and when the food assistance landscape changed in relation to Federal COVID-19 legislation and economic conditions.
Federal Food Assistance Programs and Pandemic-Related Legislation
The Federal food and nutrition assistance landscape typically includes 15 programs administered by FNS. The largest of these is SNAP, which provides low-income households with additional resources to purchase food and reaches tens of millions of people per month. Other programs are targeted toward meeting the food and nutrition needs of specific population groups. The Special Supplemental Nutrition Program for Women, Infants, and Children (WIC) provides supplemental food packages, nutrition education, breastfeeding support, and health care referrals to low-income pregnant and postpartum breastfeeding and non-breastfeeding women as well as infants and children up to age 5 who are at nutritional risk. USDA’s child nutrition programs, including the National School Lunch Program (NSLP), the School Breakfast Program (SBP), and the Child and Adult Care Food Program (CACFP), provide nutritious meals and snacks at low or no cost to children in participating schools and childcare providers. In a typical year, SNAP, WIC, and the child nutrition programs account for more than 95 percent of total USDA food and nutrition assistance spending. (For a guide to acronyms used in this article, please see the blue box below.)
Responding to the pandemic, the U.S. Congress passed two bills in 2020 that transformed the food and nutrition assistance landscape. The Families First Coronavirus Response Act (FFCRA) authorized SNAP emergency allotments to temporarily raise households’ SNAP benefits to the maximum amount for their household size, increased WIC appropriations by $500 million, and gave USDA authority to launch two new programs. One of those programs, P-EBT, reimbursed families whose children were eligible for free or reduced-price school meals missed due to COVID-19 related school closures. The other program, the Farmers to Families Food Box Program (Food Box Program), allowed USDA to purchase food products from U.S.-based producers and donate them to food banks and other charitable organizations. The Coronavirus Aid, Relief, and Economic Security (CARES) Act provided an additional $8.8 billion to child nutrition programs and $15.8 billion to SNAP to support program operations during the pandemic.
Federal Food and Nutrition Assistance Spending Increased by $30 Billion in FY 2020
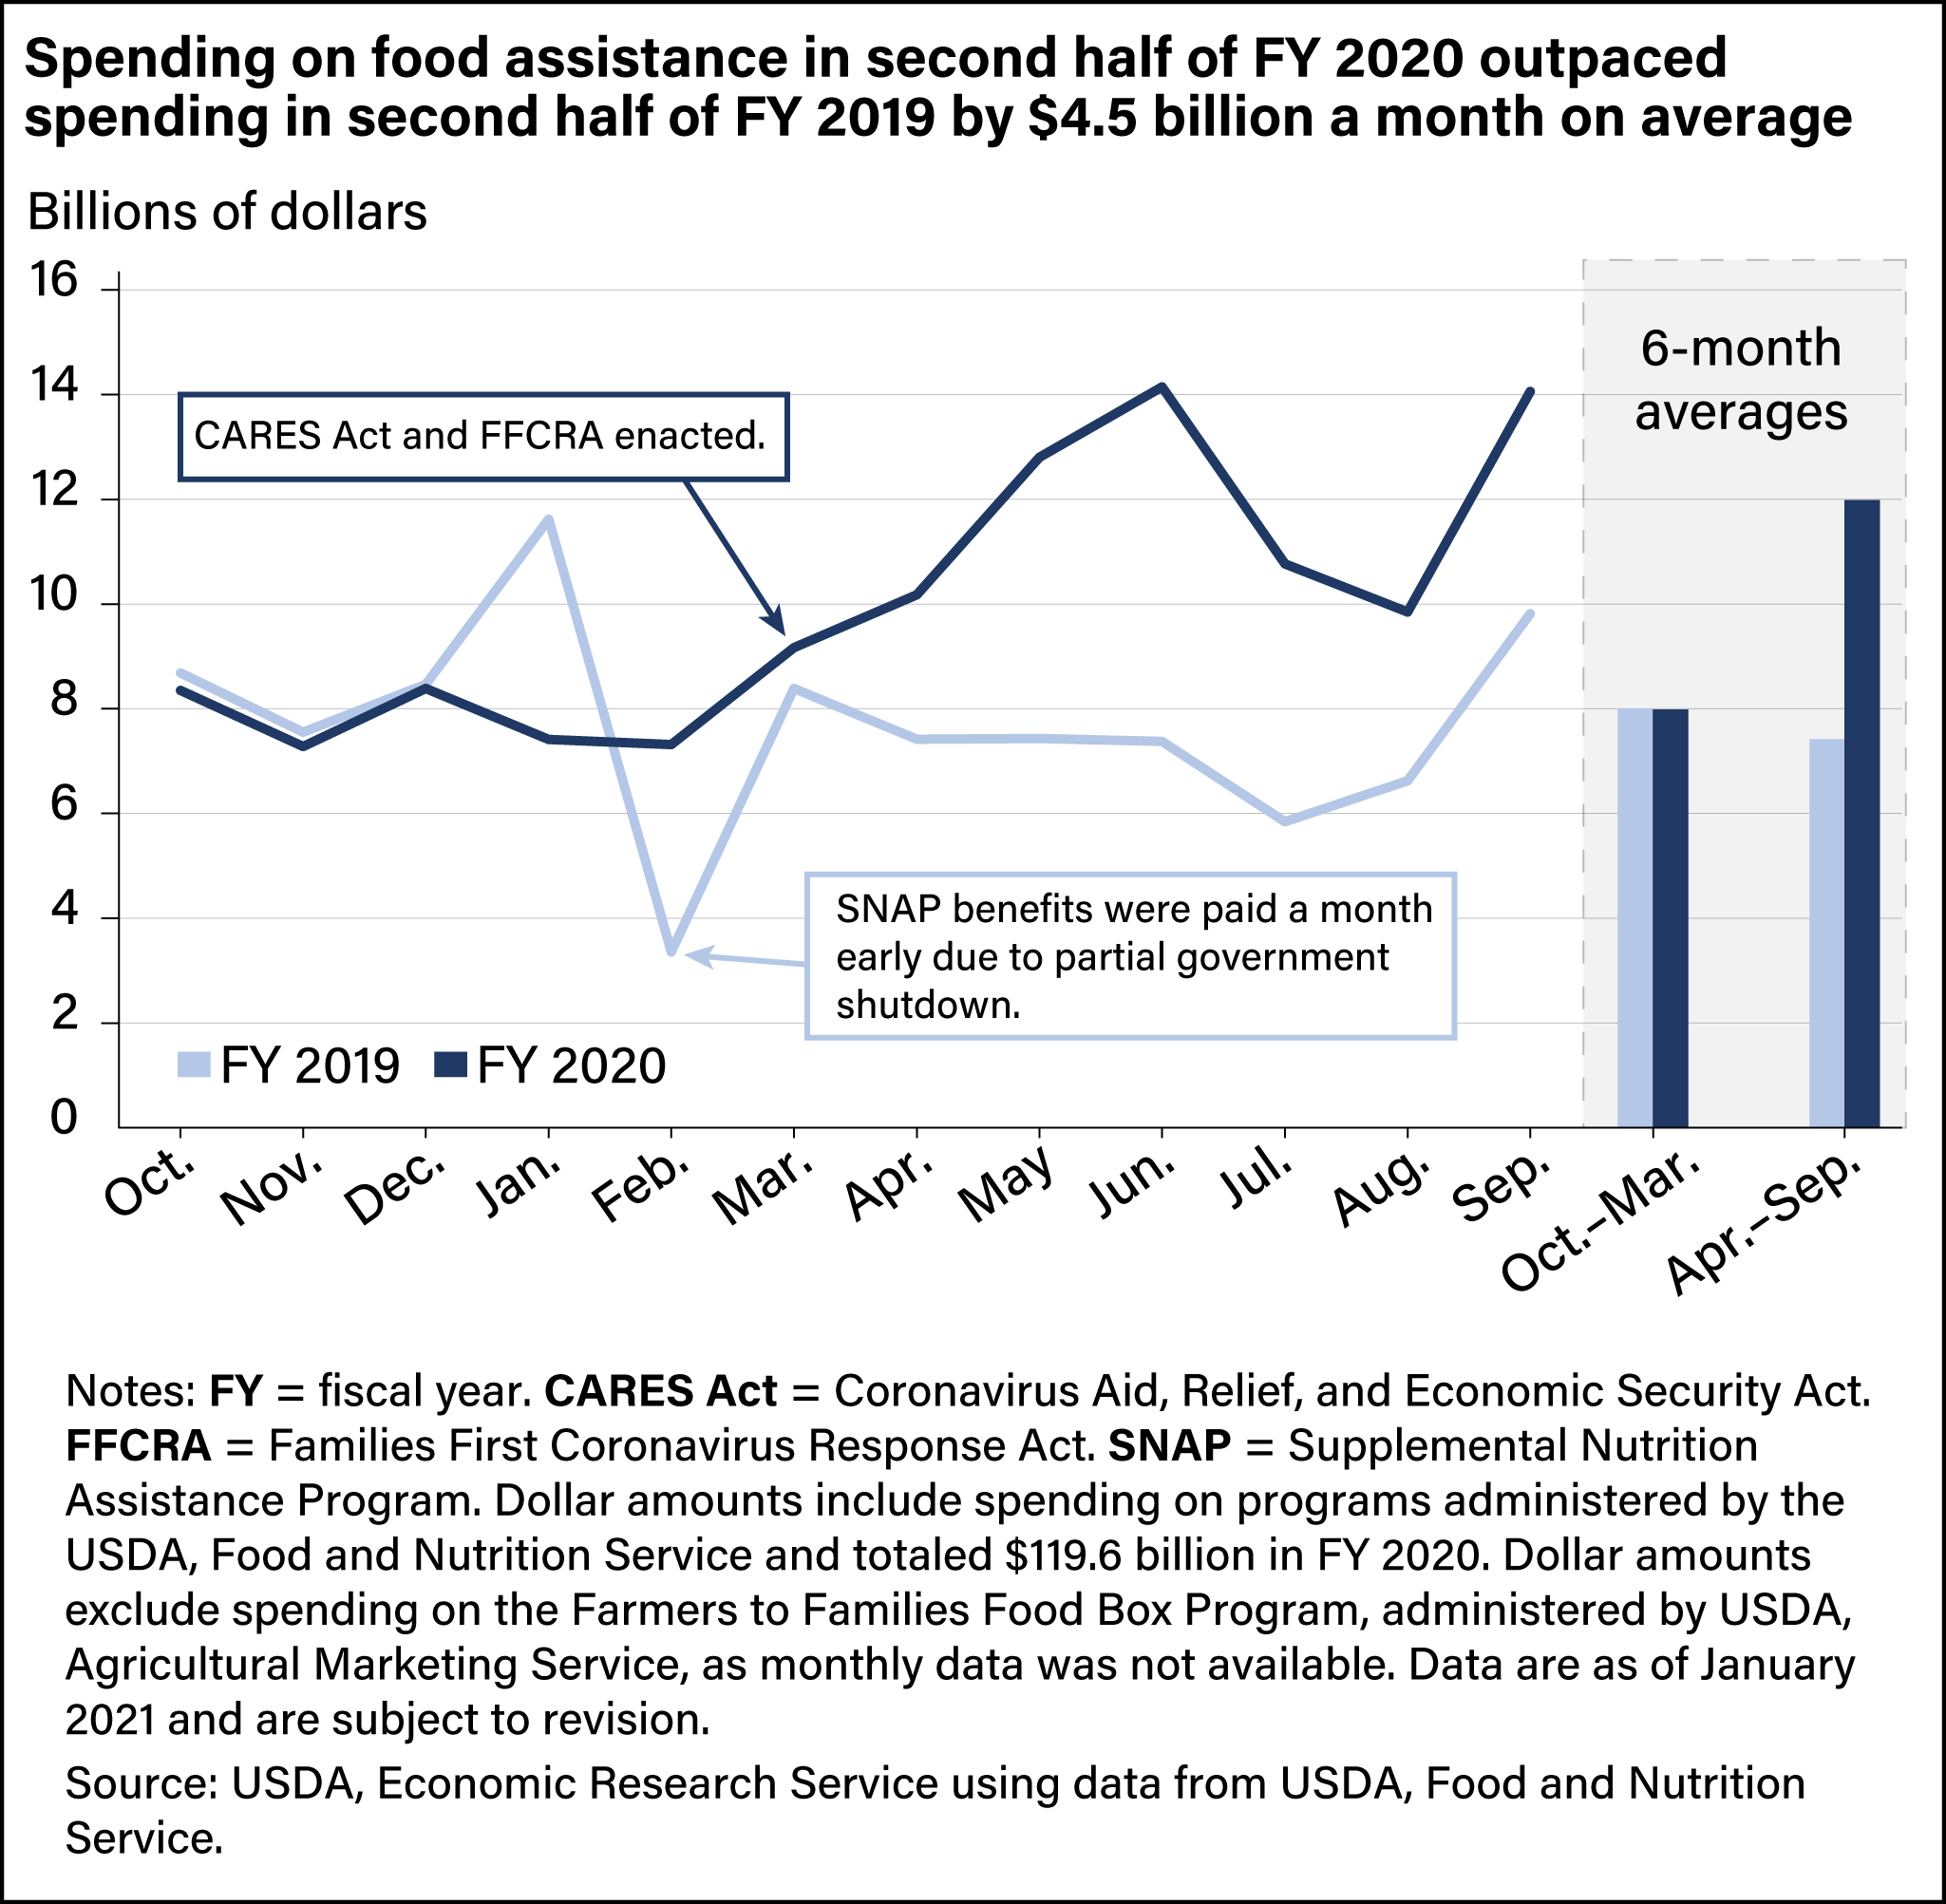
Within FY 2019, total spending followed a mostly regular pattern of monthly variation, declining in the summer months and spiking in September. A notable exception was in January and February 2019, when USDA authorized disbursement of SNAP benefits for both months in January because of a partial Federal Government shutdown in February.
In the first half of FY 2020, monthly spending averaged $8.0 billion, about the same as in FY 2019. However, spending increased in March 2020, following the start of the economic recession and the passage of the FFCRA and CARES Act, and grew each month through June 2020 when it reached $14.1 billion. Spending then fell in July and August 2020 before jumping back to $14.1 billion in September. As a result, average monthly spending amounted to $12.0 billion in the second half of FY 2020, a 61-percent increase over average monthly spending in the second half of FY 2019. Overall, food and nutrition assistance spending averaged $10.0 billion a month in FY 2020 compared with $7.7 billion a month in FY 2019.
Spending on the Food Box Program is not included in the monthly dollar amounts described above because monthly data is not available for that program. From May through September of FY 2020, USDA spent $2.5 billion on the Food Box Program, which distributed 92 million boxes of produce, dairy, and meat products to food banks and other charitable organizations nationwide.
SNAP Benefits and Participation Expanded in Response to Federal COVID-19 Legislation and Declining Economic Conditions
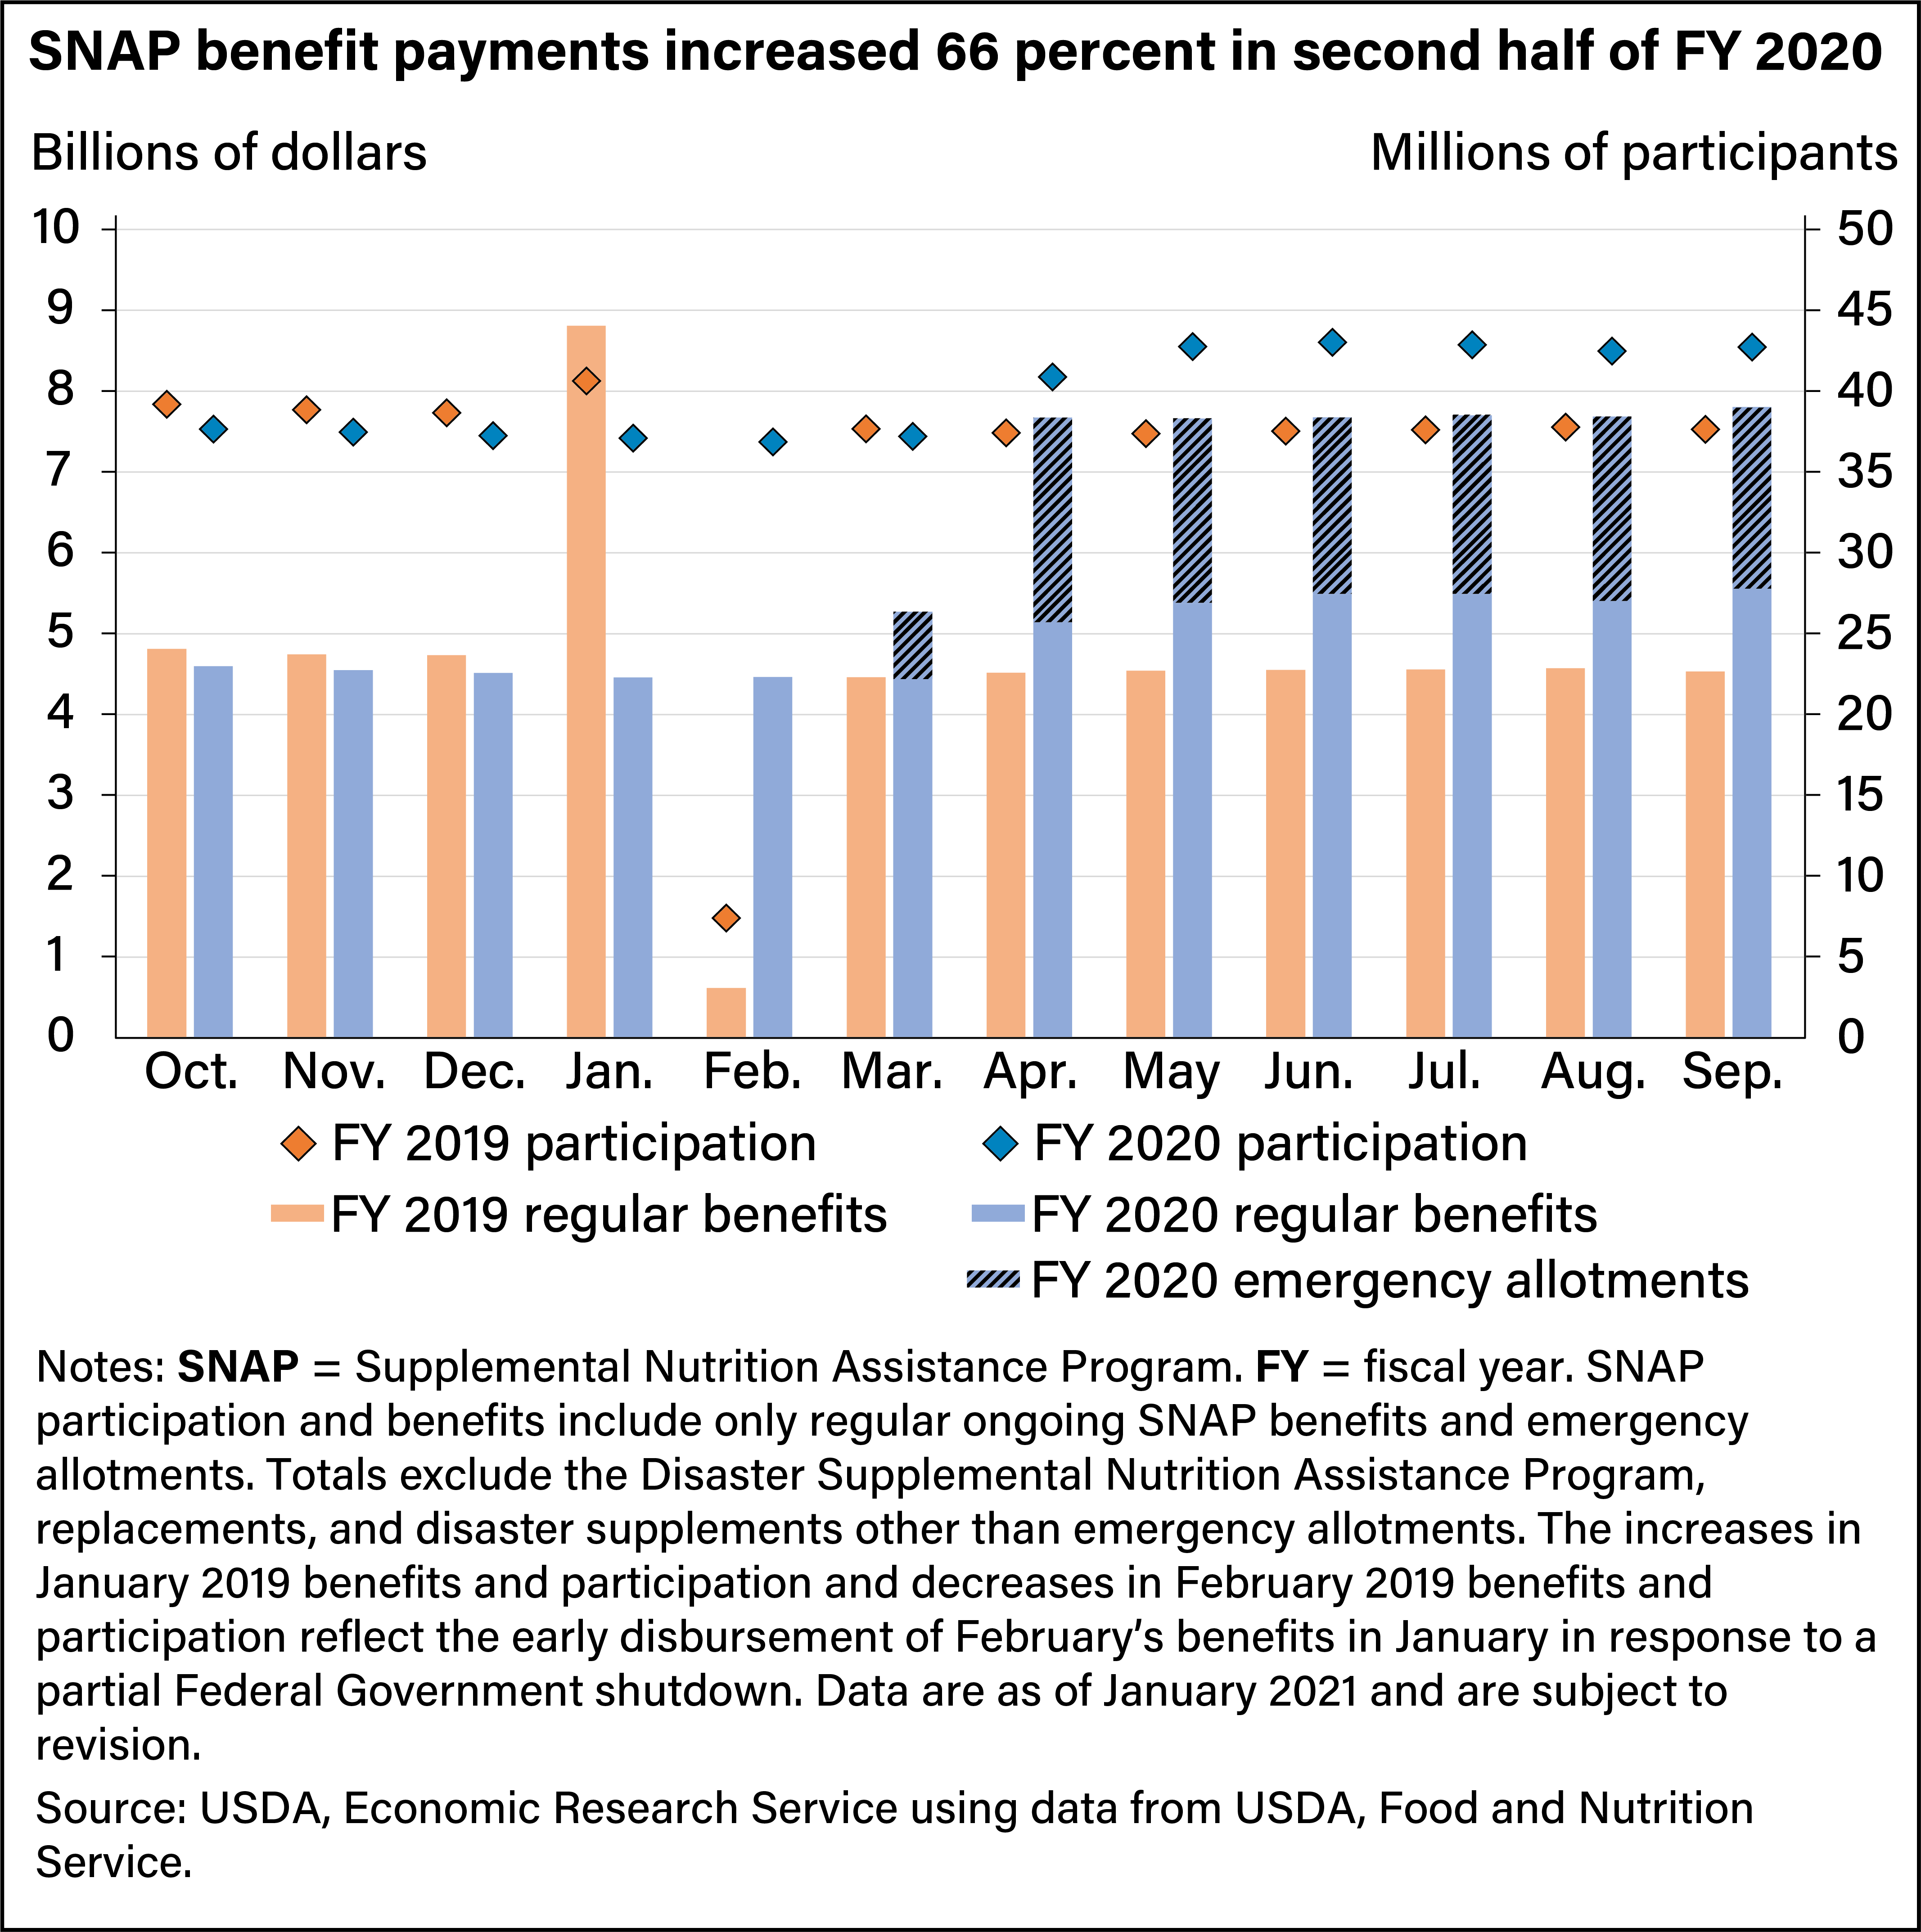
Before the pandemic, SNAP participation and benefits continued to decline as they had in previous years. From October 2018 to February 2020, participation fell from 39.2 million people to 36.9 million, and benefits fell from $4.8 billion to $4.5 billion. Apart from January and February 2019, monthly participation in FY 2019 averaged 38.0 million, and monthly benefits averaged $4.6 billion. These were the lowest annual levels since FY 2009, reflecting continued economic growth in the United States.
Beginning in March 2020, the economic downturn and Federal pandemic response led to increases in monthly SNAP participation and benefits. The FFCRA allowed for greater administrative flexibilities and suspended time limits on SNAP benefit receipt for able-bodied adults without dependents, which contributed to an increase in SNAP participation. The number of SNAP participants increased from 36.9 million in February 2020 to 40.9 million by April. Participation reached 42.8 million in May 2020 and stayed near that level for the rest of the fiscal year. Overall, average participation from April through September 2020 was 42.5 million—up nearly 5 million from the same period the previous year.
The FFCRA also authorized increases in SNAP benefit amounts through monthly emergency allotments. SNAP benefits are typically determined based on household size and are reduced for households with higher net income (gross income less specific deductions). Emergency allotments temporarily provided all SNAP households with the maximum benefit amount for their household size regardless of their net income. On average, 60 percent of SNAP participants received emergency allotments. The remainder did not, either because they were already receiving the maximum benefit without an emergency allotment or because of limited interruptions in emergency allotment issuance in some States.
States began issuing emergency allotments in late March or April 2020, causing total benefits to increase in those months. SNAP benefits rose from $4.5 billion in February 2020 to $7.7 billion in April and stayed near that level the rest of the fiscal year. Emergency allotments accounted for about 30 percent of total benefits in May 2020 and subsequent months. Compared with the same period in FY 2019, SNAP benefits from April through September 2020 were up nearly $3.2 billion per month. Emergency allotments accounted for $2.3 billion of this increase, but regular ongoing benefits also grew during this period, accounting for the remaining $0.9 billion.
School and Childcare Provider Closures Prompted New Approaches to Providing Meals Through USDA’s Child Nutrition Programs
The closure of schools and childcare providers beginning in March 2020 disrupted the routine provision of meals through the NSLP, SBP, and CACFP. The Families First Coronavirus Response Act granted USDA authority to adjust program operations to meet rising food needs, and the CARES Act provided additional funding to support these adjustments. One set of USDA waivers suspended requirements that meals be served in group settings at specific times and instead allowed for “grab and go” meals that children’s parents or guardians could pick up. Other USDA waivers expanded the scope and coverage of the Summer Food Service Program (SFSP) and the NSLP and SBP’s Seamless Summer Option (SSO), which typically allow qualifying organizations to provide free meals to children when schools are not in session in areas or sites where at least half of children qualify for free or reduced-price meals. USDA waivers allowed for the provision of free meals in all areas throughout the year through schools and childcare providers otherwise closed for instruction or care, as well as through other qualifying locations.
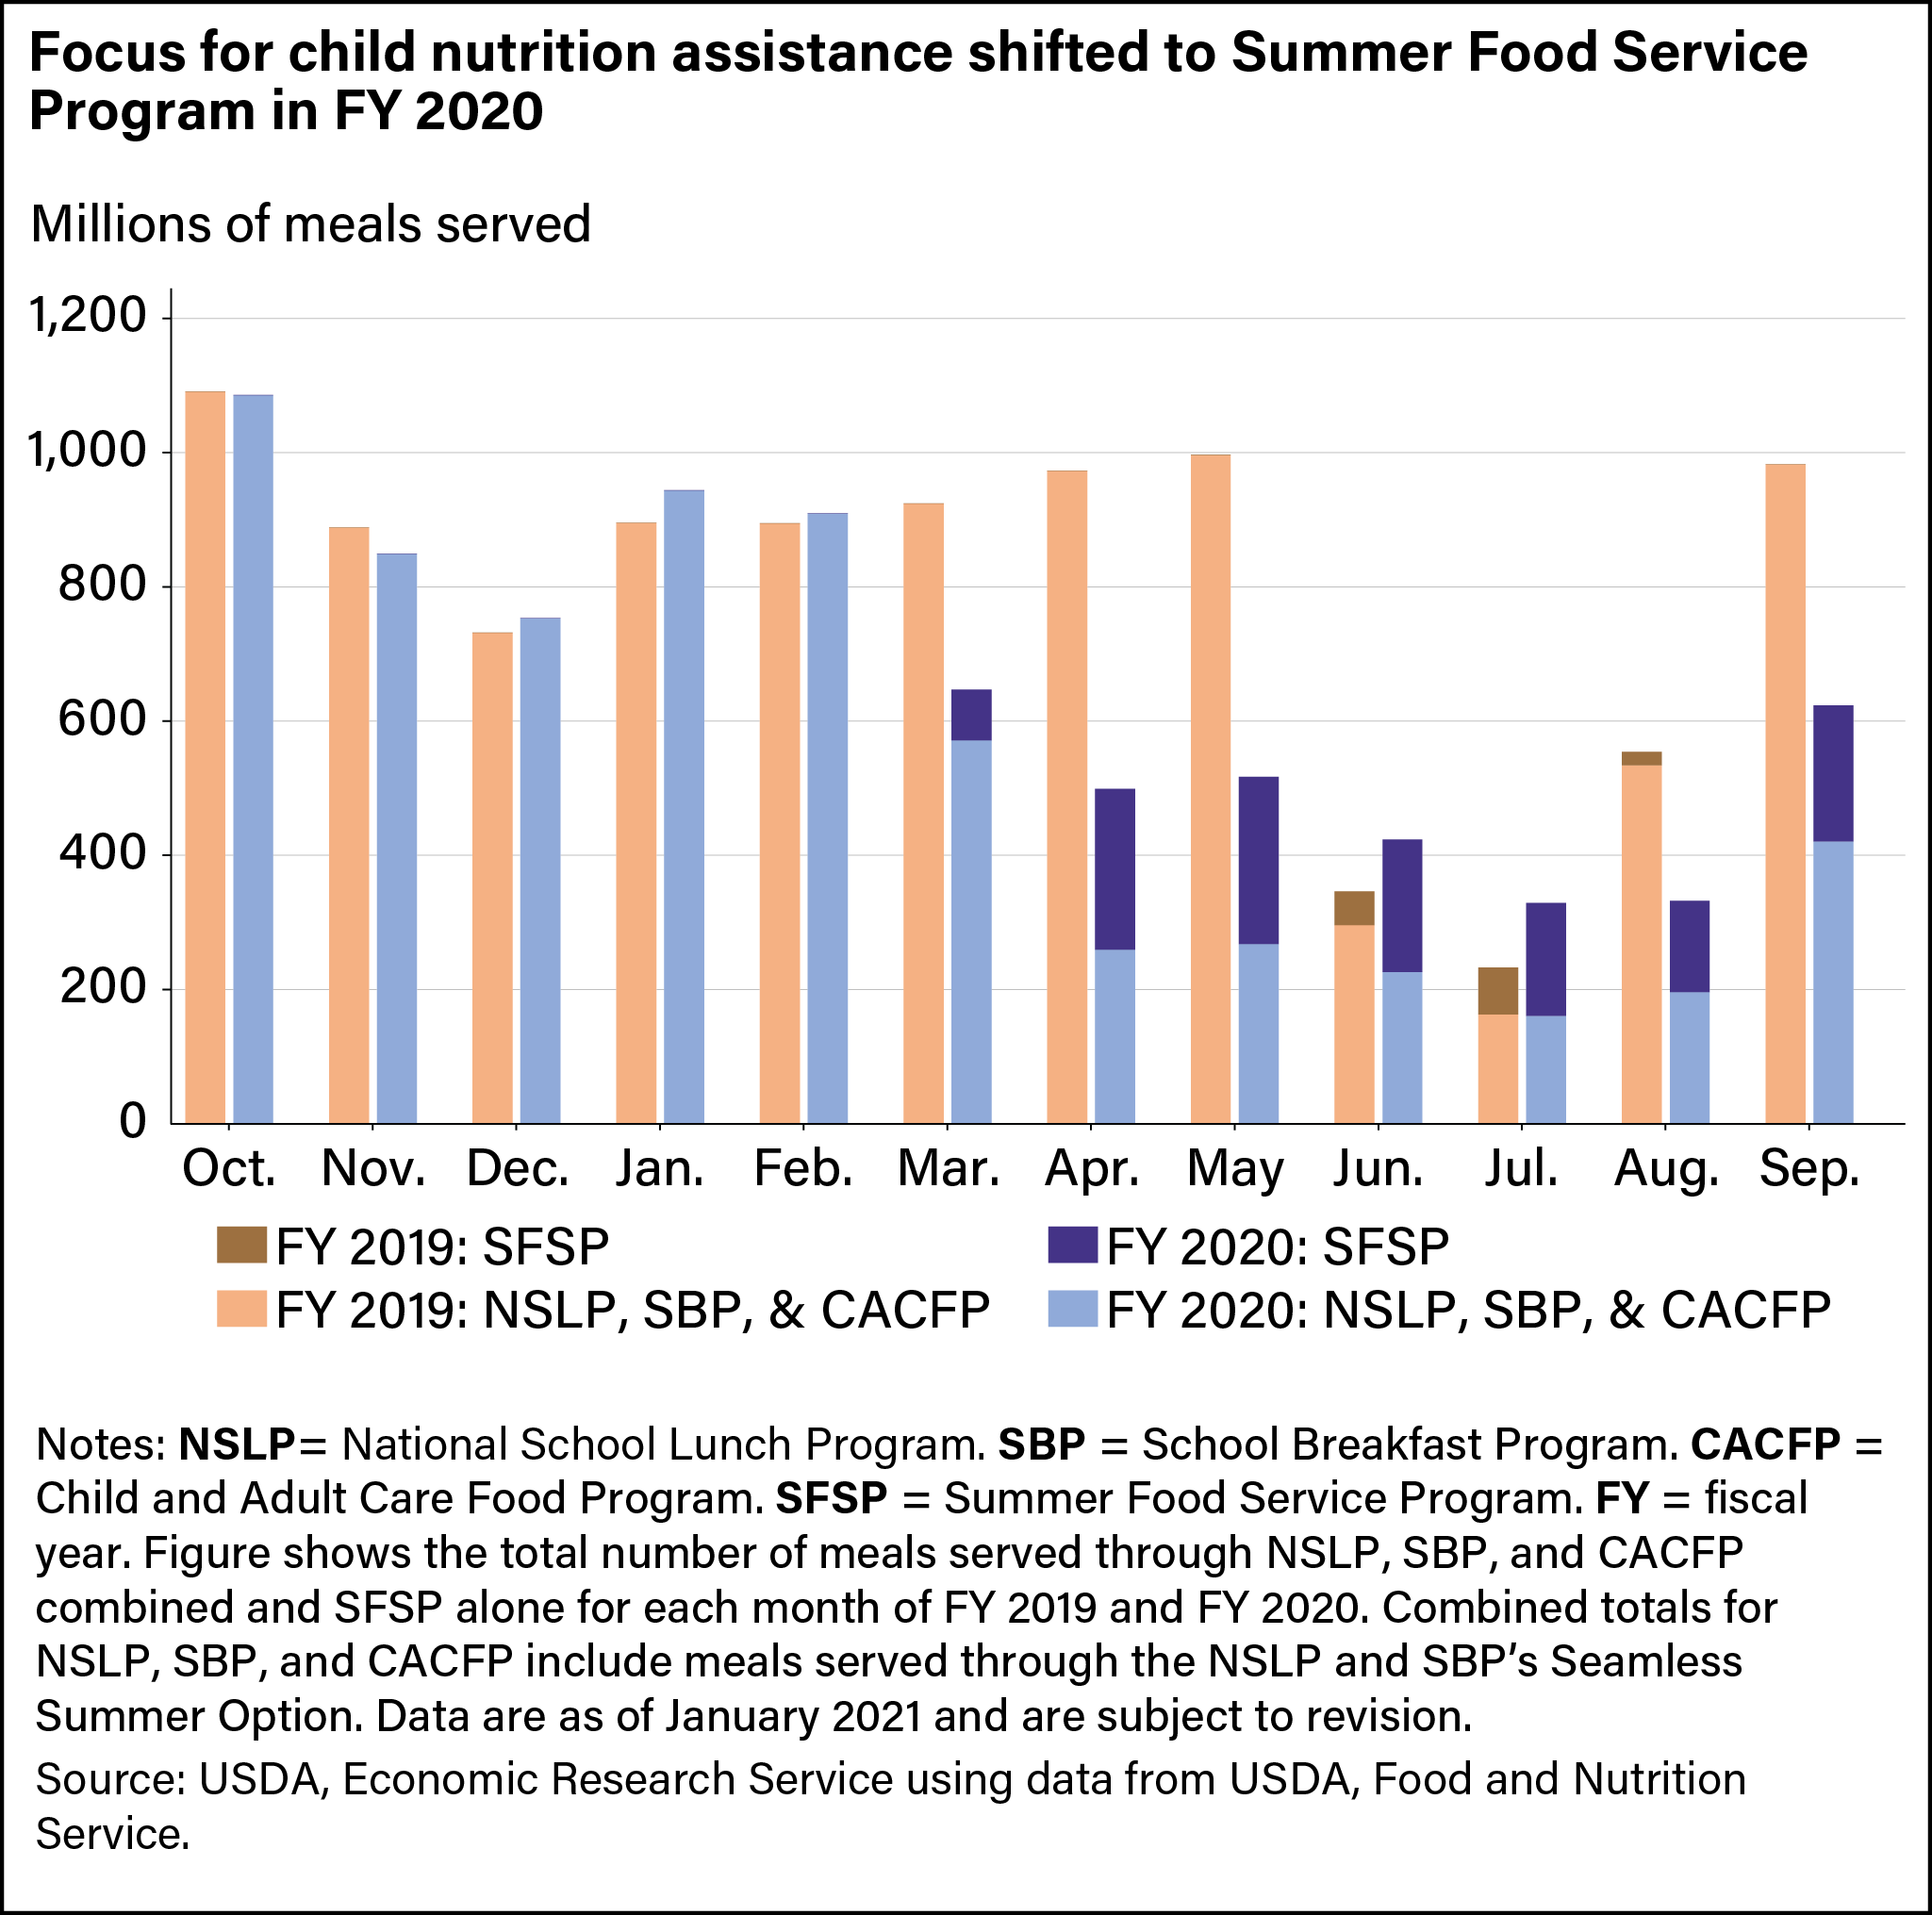
From October 2019 through February 2020, 4.5 billion meals were served through NSLP, SBP, and CACFP, about the same as the number served over the same period in FY 2019. However, from March through May 2020, these programs served 1.1 billion meals, 1.8 billion fewer than in 2019. In contrast, the SFSP distributed 564.4 million meals from March through May 2020, a large jump from the 1.2 million meals served during the same period in 2019.
Despite the increase in meals served through SFSP, fewer total meals were served across all four programs from March through May 2020 compared with the same period in 2019. Conversely, although most schools are typically closed for the summer in June and July, more meals were served across the four programs in these months in 2020 compared with 2019. This increase was driven by the SFSP, which served about three times the number of meals over the 2 months in 2020 relative to 2019. With many schools remaining closed for the beginning of the 2020–2021 school year, fewer meals were served across all four programs in August and September 2020 than in the same months in 2019.
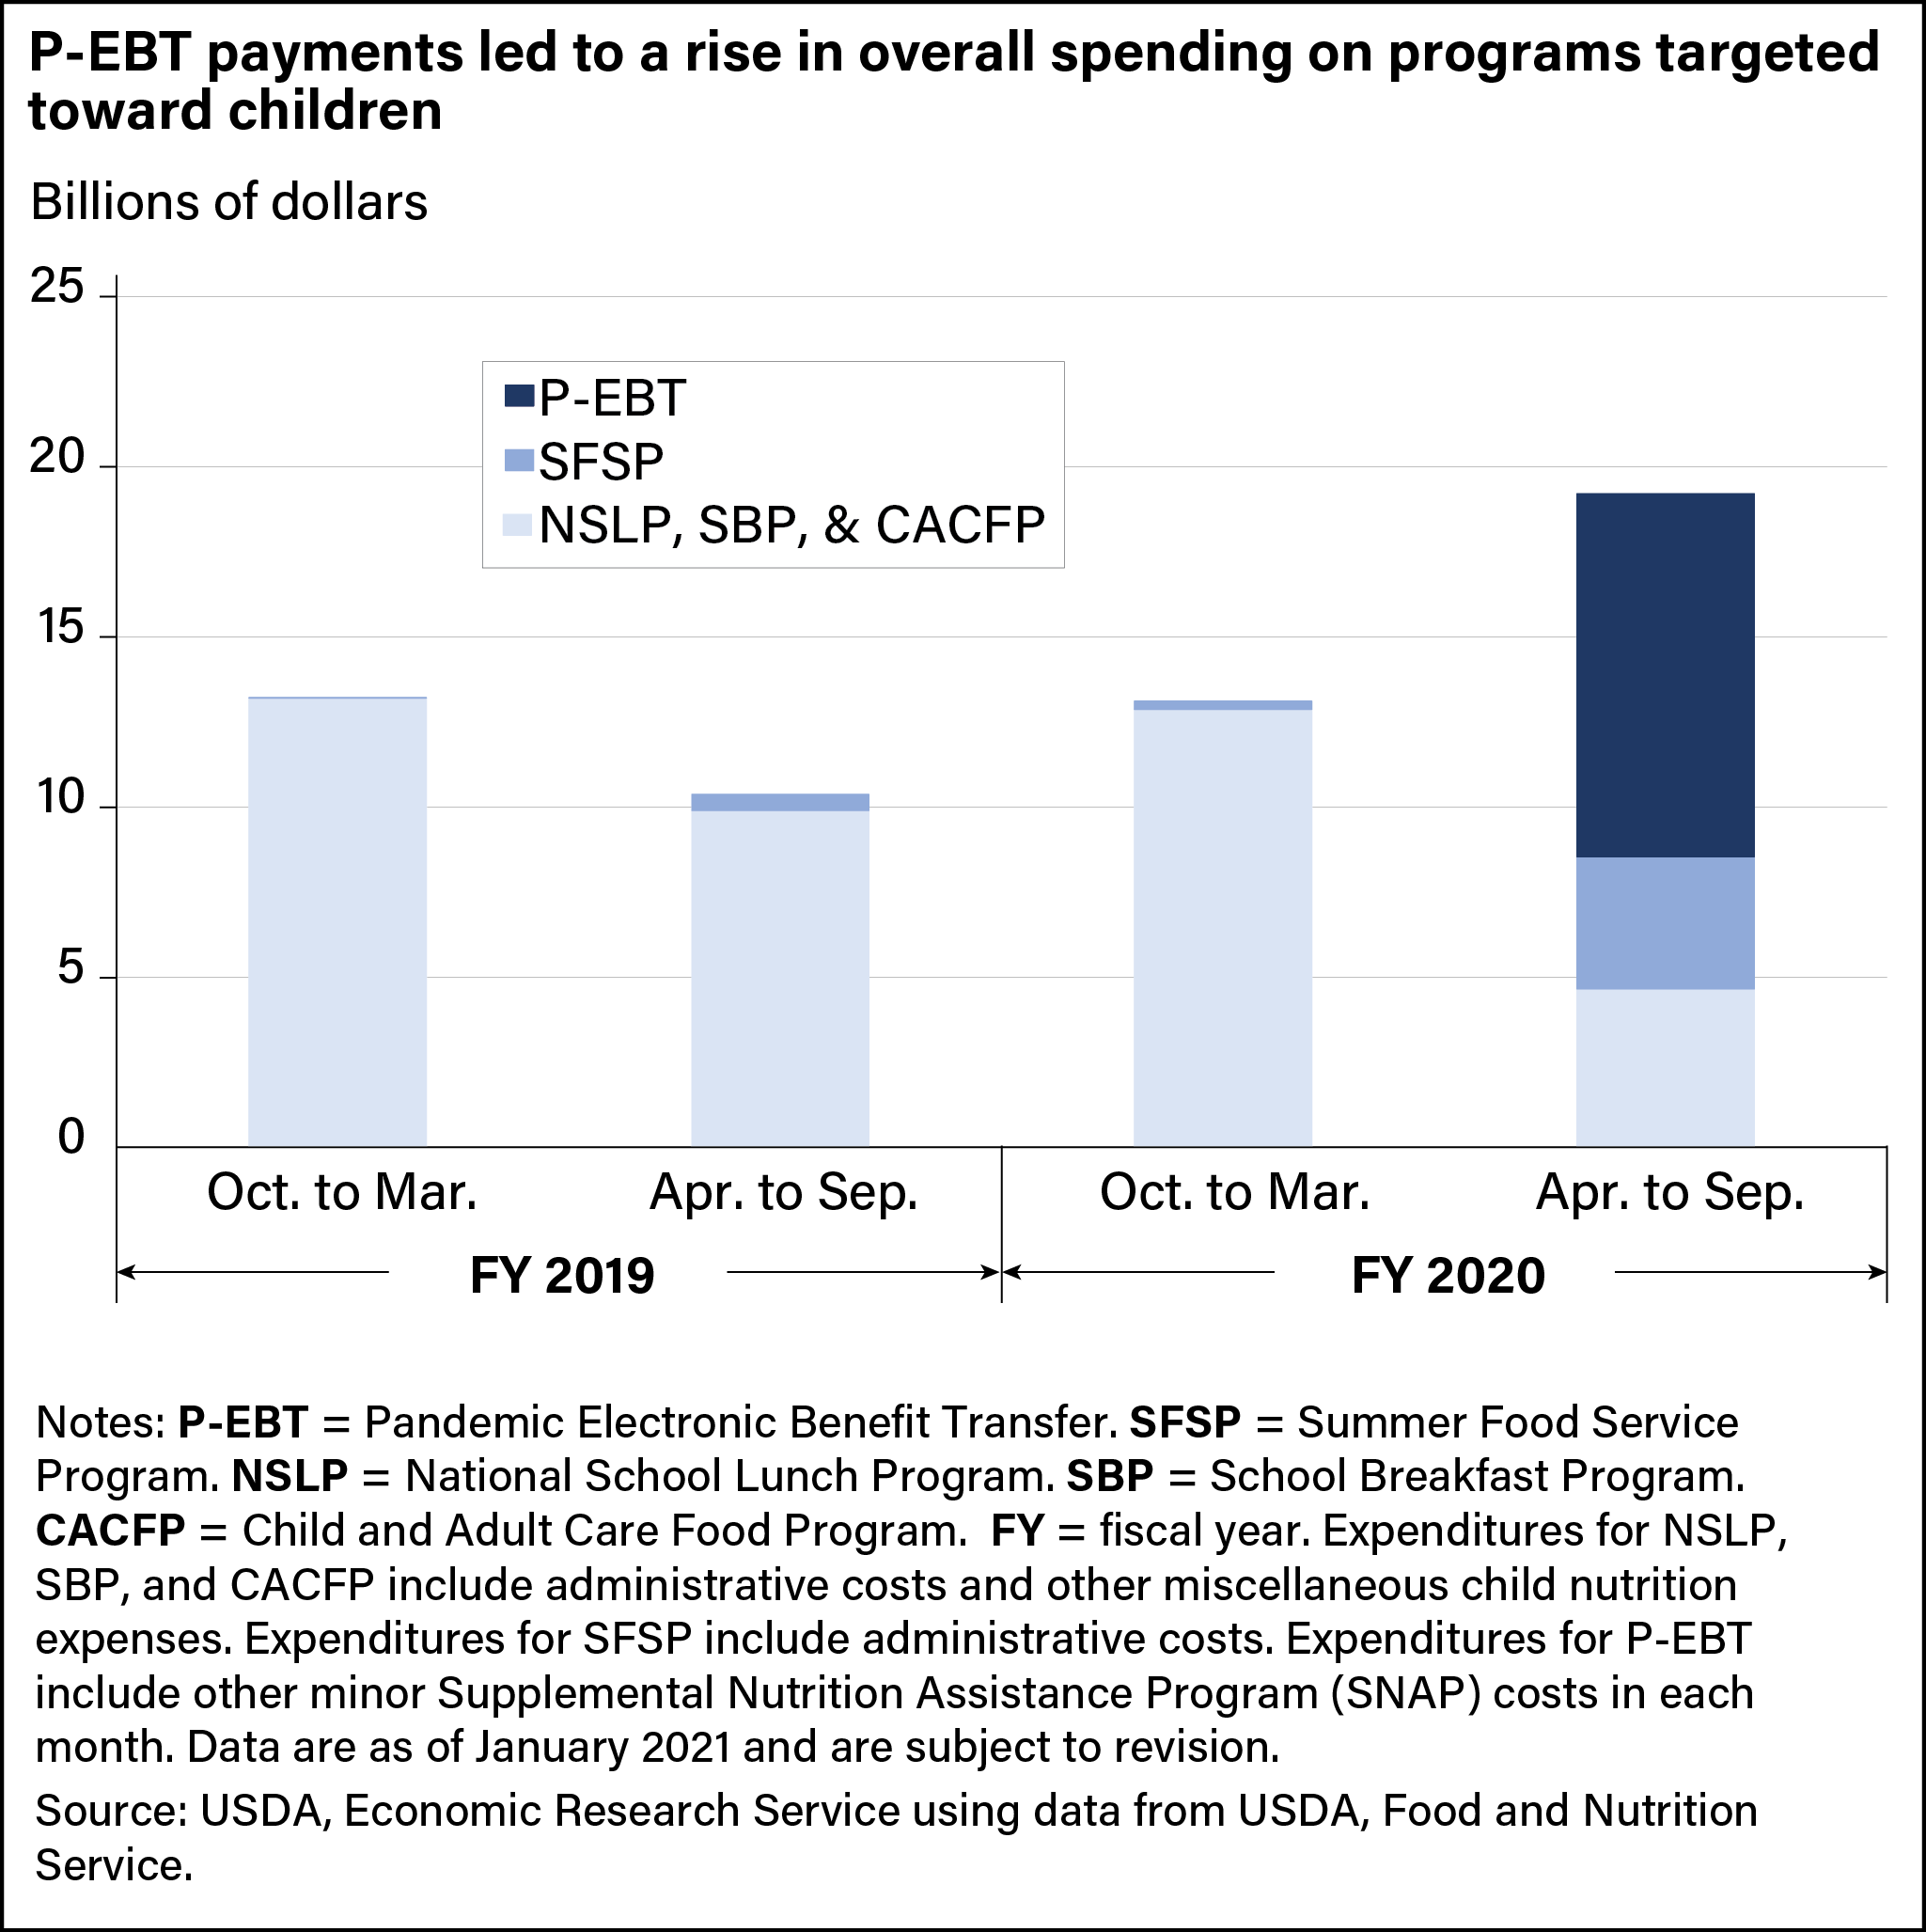
Therefore, 7.9 billion meals were served overall through NSLP, SBP, CACFP, and SFSP in FY 2020, down from 9.5 billion in FY 2019. As a result, total expenditures on these programs amounted to $21.7 billion in FY 2020, $1.9 billion fewer than in FY 2019.
The FFCRA also authorized USDA to create the P-EBT program to help meet children’s food needs. As spending on the school meal programs and CACFP declined beginning in March 2020, spending on SFSP and P-EBT grew. Overall, the Federal Government spent about $10.7 billion on P-EBT and $4.1 billion on SFSP in FY 2020.
Changes to WIC at the Onset of the Pandemic Were Less Pronounced Than Changes to Other Food and Nutrition Assistance Programs
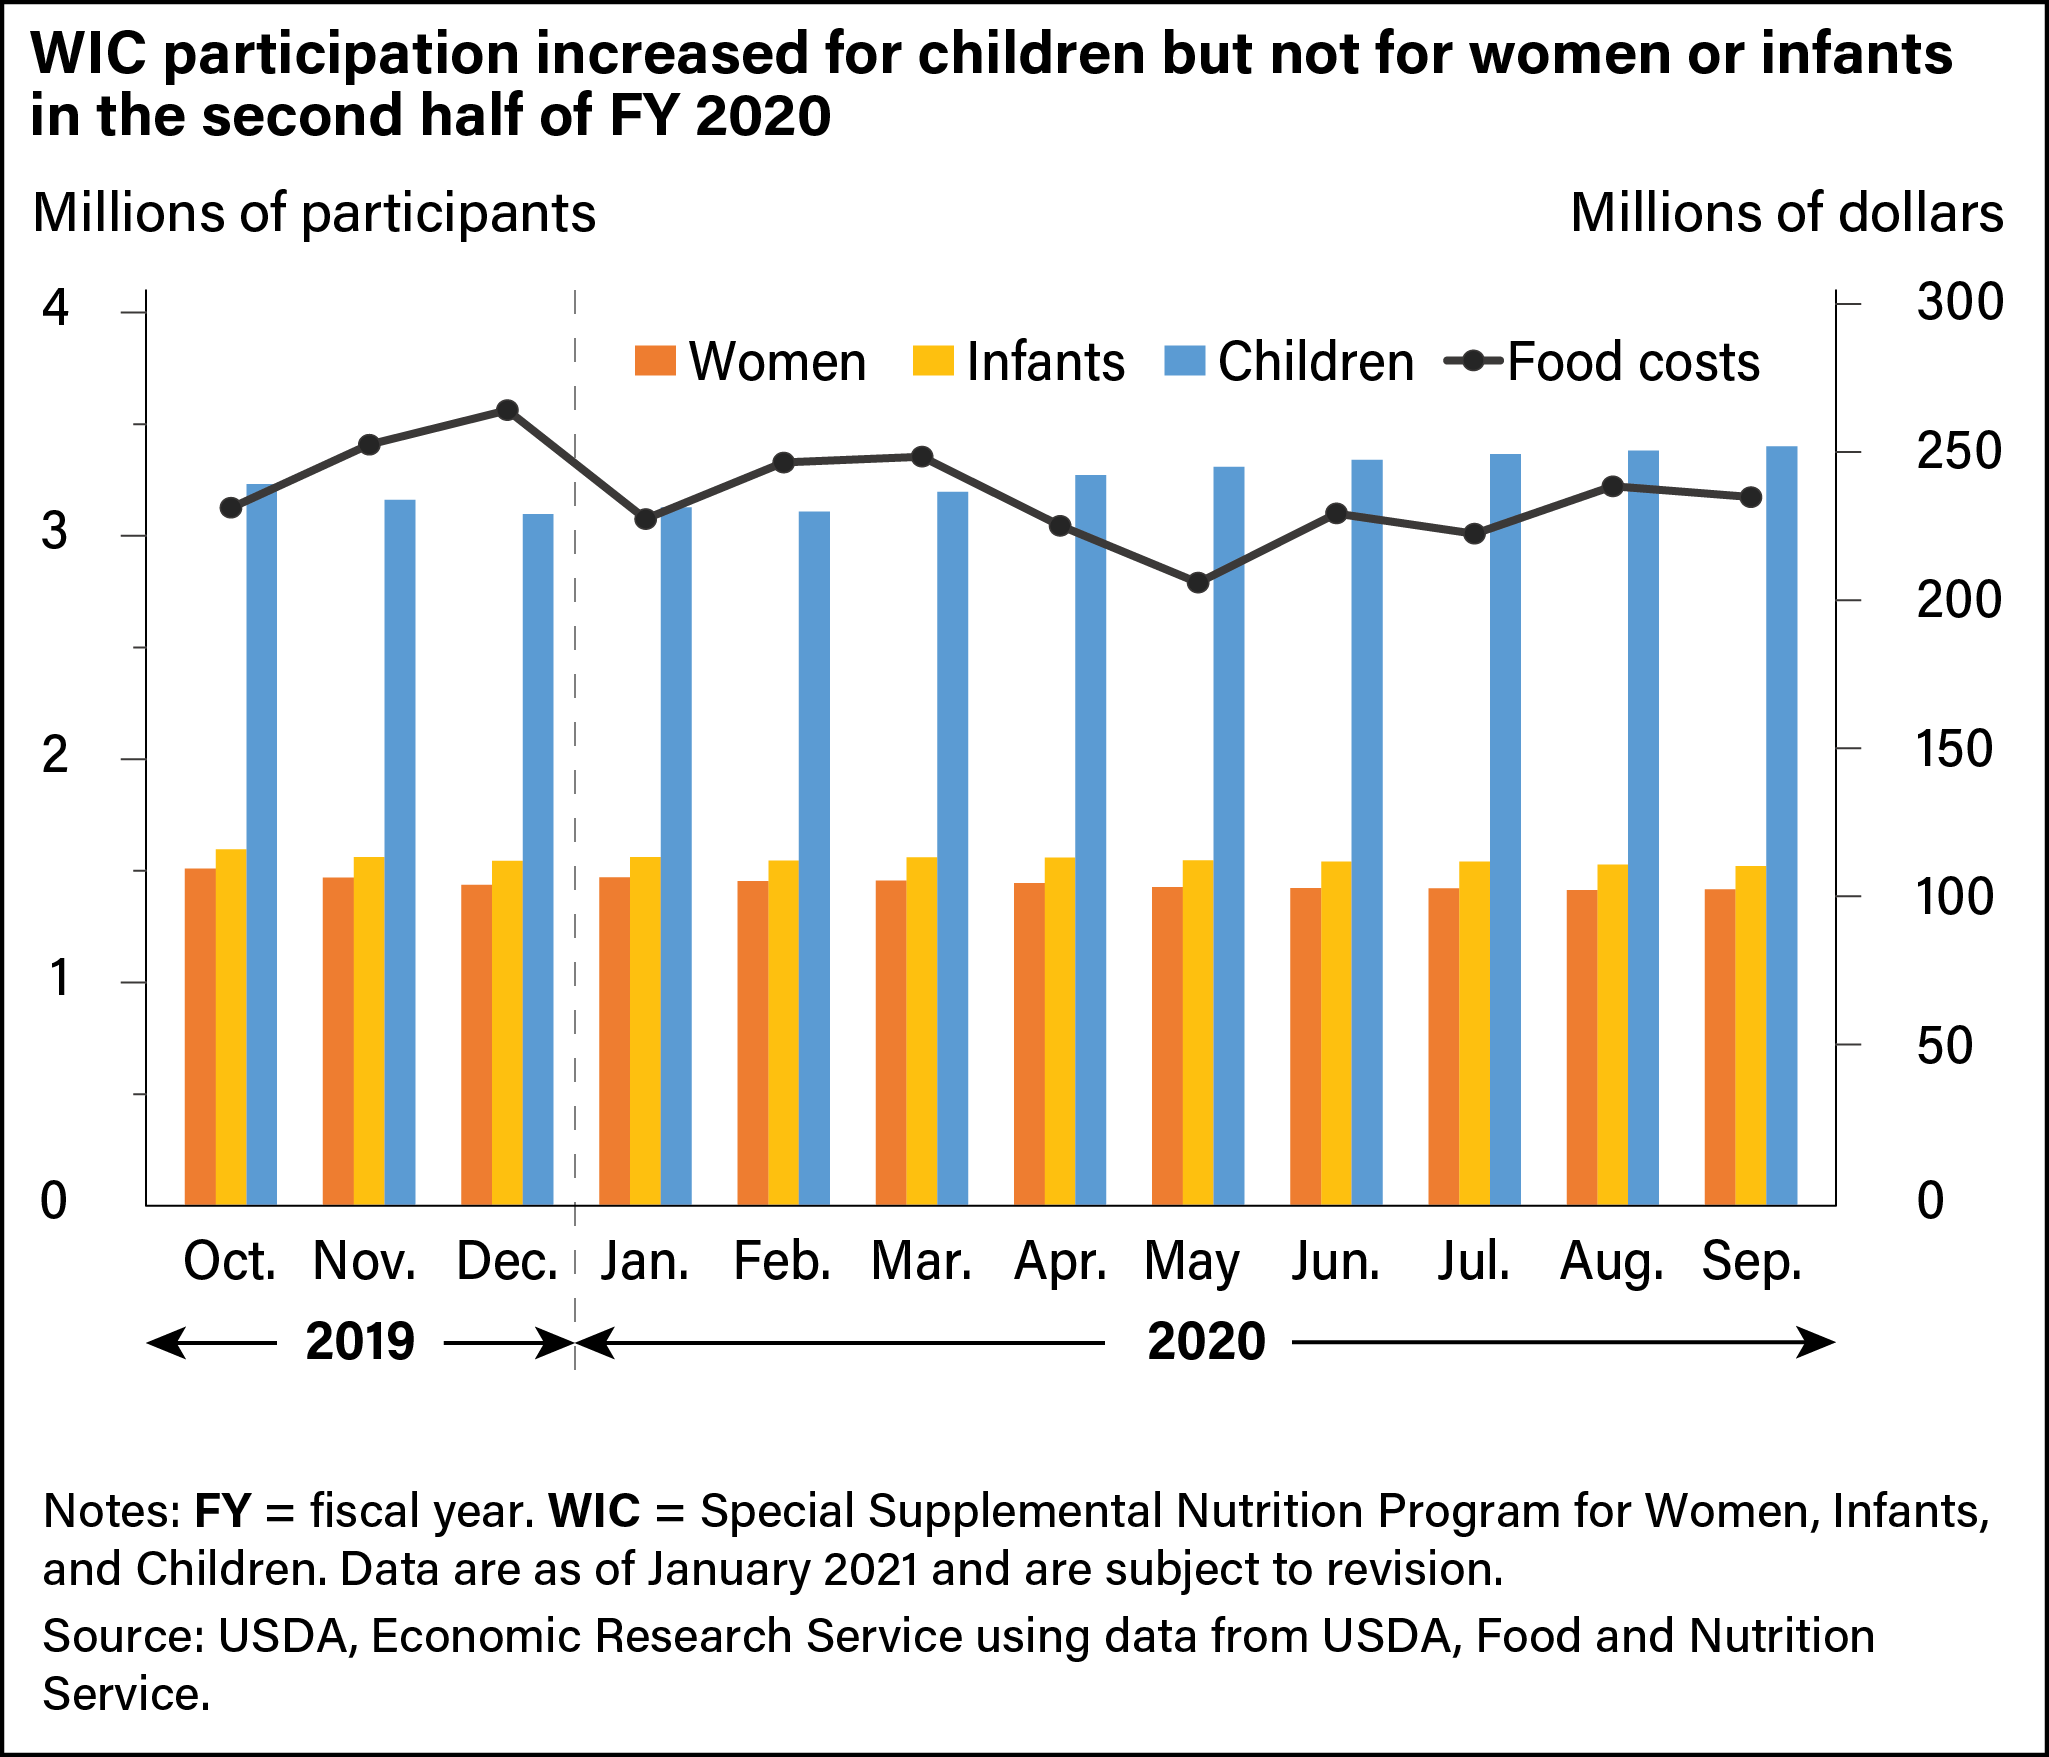
The FFCRA provided additional funding to WIC to support continuity of services during the pandemic. Most States applied for and received USDA waivers that allowed for remote certification and recertification, for deferrals of medical documentation requirements for applicants, and for food package substitutions due to food shortages. Despite the flexibilities the waivers provided to WIC State agencies, changes to WIC participation and spending in FY 2020 were modest. In fact, average monthly participation rates for women, infants, and children all fell in FY 2020. On average, 1.45 million women, 1.55 million infants, and 3.25 million children participated in WIC per month in FY 2020 compared with 1.51 million women, 1.61 million infants, and 3.27 million children in FY 2019.
When considering patterns within FY 2020, participation rates did increase among children 1 to 4 years of age in the second half of FY 2020 (by about 200,000 children per month on average). On the other hand, average monthly participation rates for women and infants in the second half of the fiscal year were slightly lower than rates in the first half of the year (by about 42,000 women and 22,000 infants per month on average).
USDA spending on WIC food package redemptions, referred to as WIC food costs, also declined in the months following the onset of the pandemic. On average, monthly food costs in the second half of FY 2020 were about $20 million lower than food costs in the first half of FY 2020. Because food prices increased during the pandemic, store closures and other social distancing measures undertaken to slow the spread of the virus may have contributed to lower WIC food package redemptions in the early months of the pandemic.
Government Continues to Assess, Add to Federal Food Assistance Programs
Legislative and policy changes in FY 2021 provided additional support for food and nutrition programs to continue to meet the needs of households impacted by the pandemic. SNAP benefit maximums were increased by 15 percent through September 2021, and, in April 2021, USDA began providing emergency allotments of $95 per month to SNAP households previously receiving no emergency allotment or receiving an emergency allotment of less than $95 due to their lower net income. P-EBT daily benefit amounts were also increased by approximately 15 percent through September 2021, and the program was expanded to include children under age 6 receiving SNAP in areas where schools and/or childcare providers were closed or had limited operations. State agencies were given the option to increase the WIC cash-value benefit for fruit and vegetable purchases to a maximum of $35 per person through September 2021, and $390 million was provided to support WIC modernizations. Going forward, ERS researchers will continue to track how these and other policy changes, as well as economic conditions and social trends, affect participation in and spending on food and nutrition assistance programs.
This article is drawn from:
- Toossi, S., Jones, J.W. & Hodges, L. (2021). The Food and Nutrition Assistance Landscape: Fiscal Year 2020 Annual Report. U.S. Department of Agriculture, Economic Research Service. EIB-227.
You may also like:
- Food and Nutrition Assistance Research Reports Database. (n.d.). U.S. Department of Agriculture, Economic Research Service.
- Food Security in the United States. (n.d.). U.S. Department of Agriculture, Economic Research Service.
- Jones, J.W. (2021). COVID-19 Working Paper: Supplemental Nutrition Assistance Program and Pandemic Electronic Benefit Transfer Redemptions during the Coronavirus Pandemic. U.S. Department of Agriculture, Economic Research Service. AP-089.
- Coleman-Jensen, A., Rabbitt, M.P., Gregory, C.A. & Singh, A. (2021). Household Food Security in the United States in 2020. U.S. Department of Agriculture, Economic Research Service. ERR-298.


