Larger Farms and Younger Farmers Are More Vulnerable to Financial Stress
- by Nigel Key
- 10/22/2019
Highlights
- Farm-level measures of solvency, liquidity, and repayment capacity indicate that farms with at least $100,000 in annual sales were more likely to be under financial stress than smaller scale operations in 2017, the most recent year analyzed by ERS.
- Among farms with at least $100,000 in annual sales, the share having a low repayment capacity or low levels of solvency has increased since 2012, but levels of financial stress in 2017 were near 20-year averages and not as severe as levels in 2002.
- If gross cash farm income were to fall from 2017 levels, the share of farms in extreme financial stress would increase relatively more for larger scale farms, for farms with a principal operator under age 40, and for dairy farms.
Recent economic conditions have raised concerns about the financial health of the U.S. farm sector. After peaking around 2012, farm sector income has declined while farm debt has continued to rise. Farm real estate is no longer rapidly appreciating in value, and land prices have declined in some regions. Interest rates have trended upward in recent years—increasing the cost of borrowing for some farmers. If commodity prices were to decline in the near future, some farmers would find it difficult to meet their loan obligations while also paying for production expenses.
Recent ERS research examined farm-level data from the USDA’s annual Agricultural Resource Management Survey (ARMS) to determine how current economic conditions in the agricultural sector compare with those in past periods of financial stress. The study identified which types of farms are financially vulnerable, and which would be likely to face the most challenges if commodity prices declined further. The study looked at multiple measures of a farm’s financial health, including repayment capacity, liquidity, and solvency. Lenders often use these measures to assess the financial stability and performance of farm operations. To gain insight into how farms would be affected if farm income continued to decline in the years ahead, the study simulated the effect of a further decline in gross cash farm income (GCFI) on the share of farms in extreme financial stress, which is defined as having a debt-to-asset ratio greater than 55 percent and not having enough household income to meet current loan payments. A high debt-to-asset ratio implies a limited ability to pay loan obligations through the sale of assets and hence a greater risk of default.
Repayment Capacity
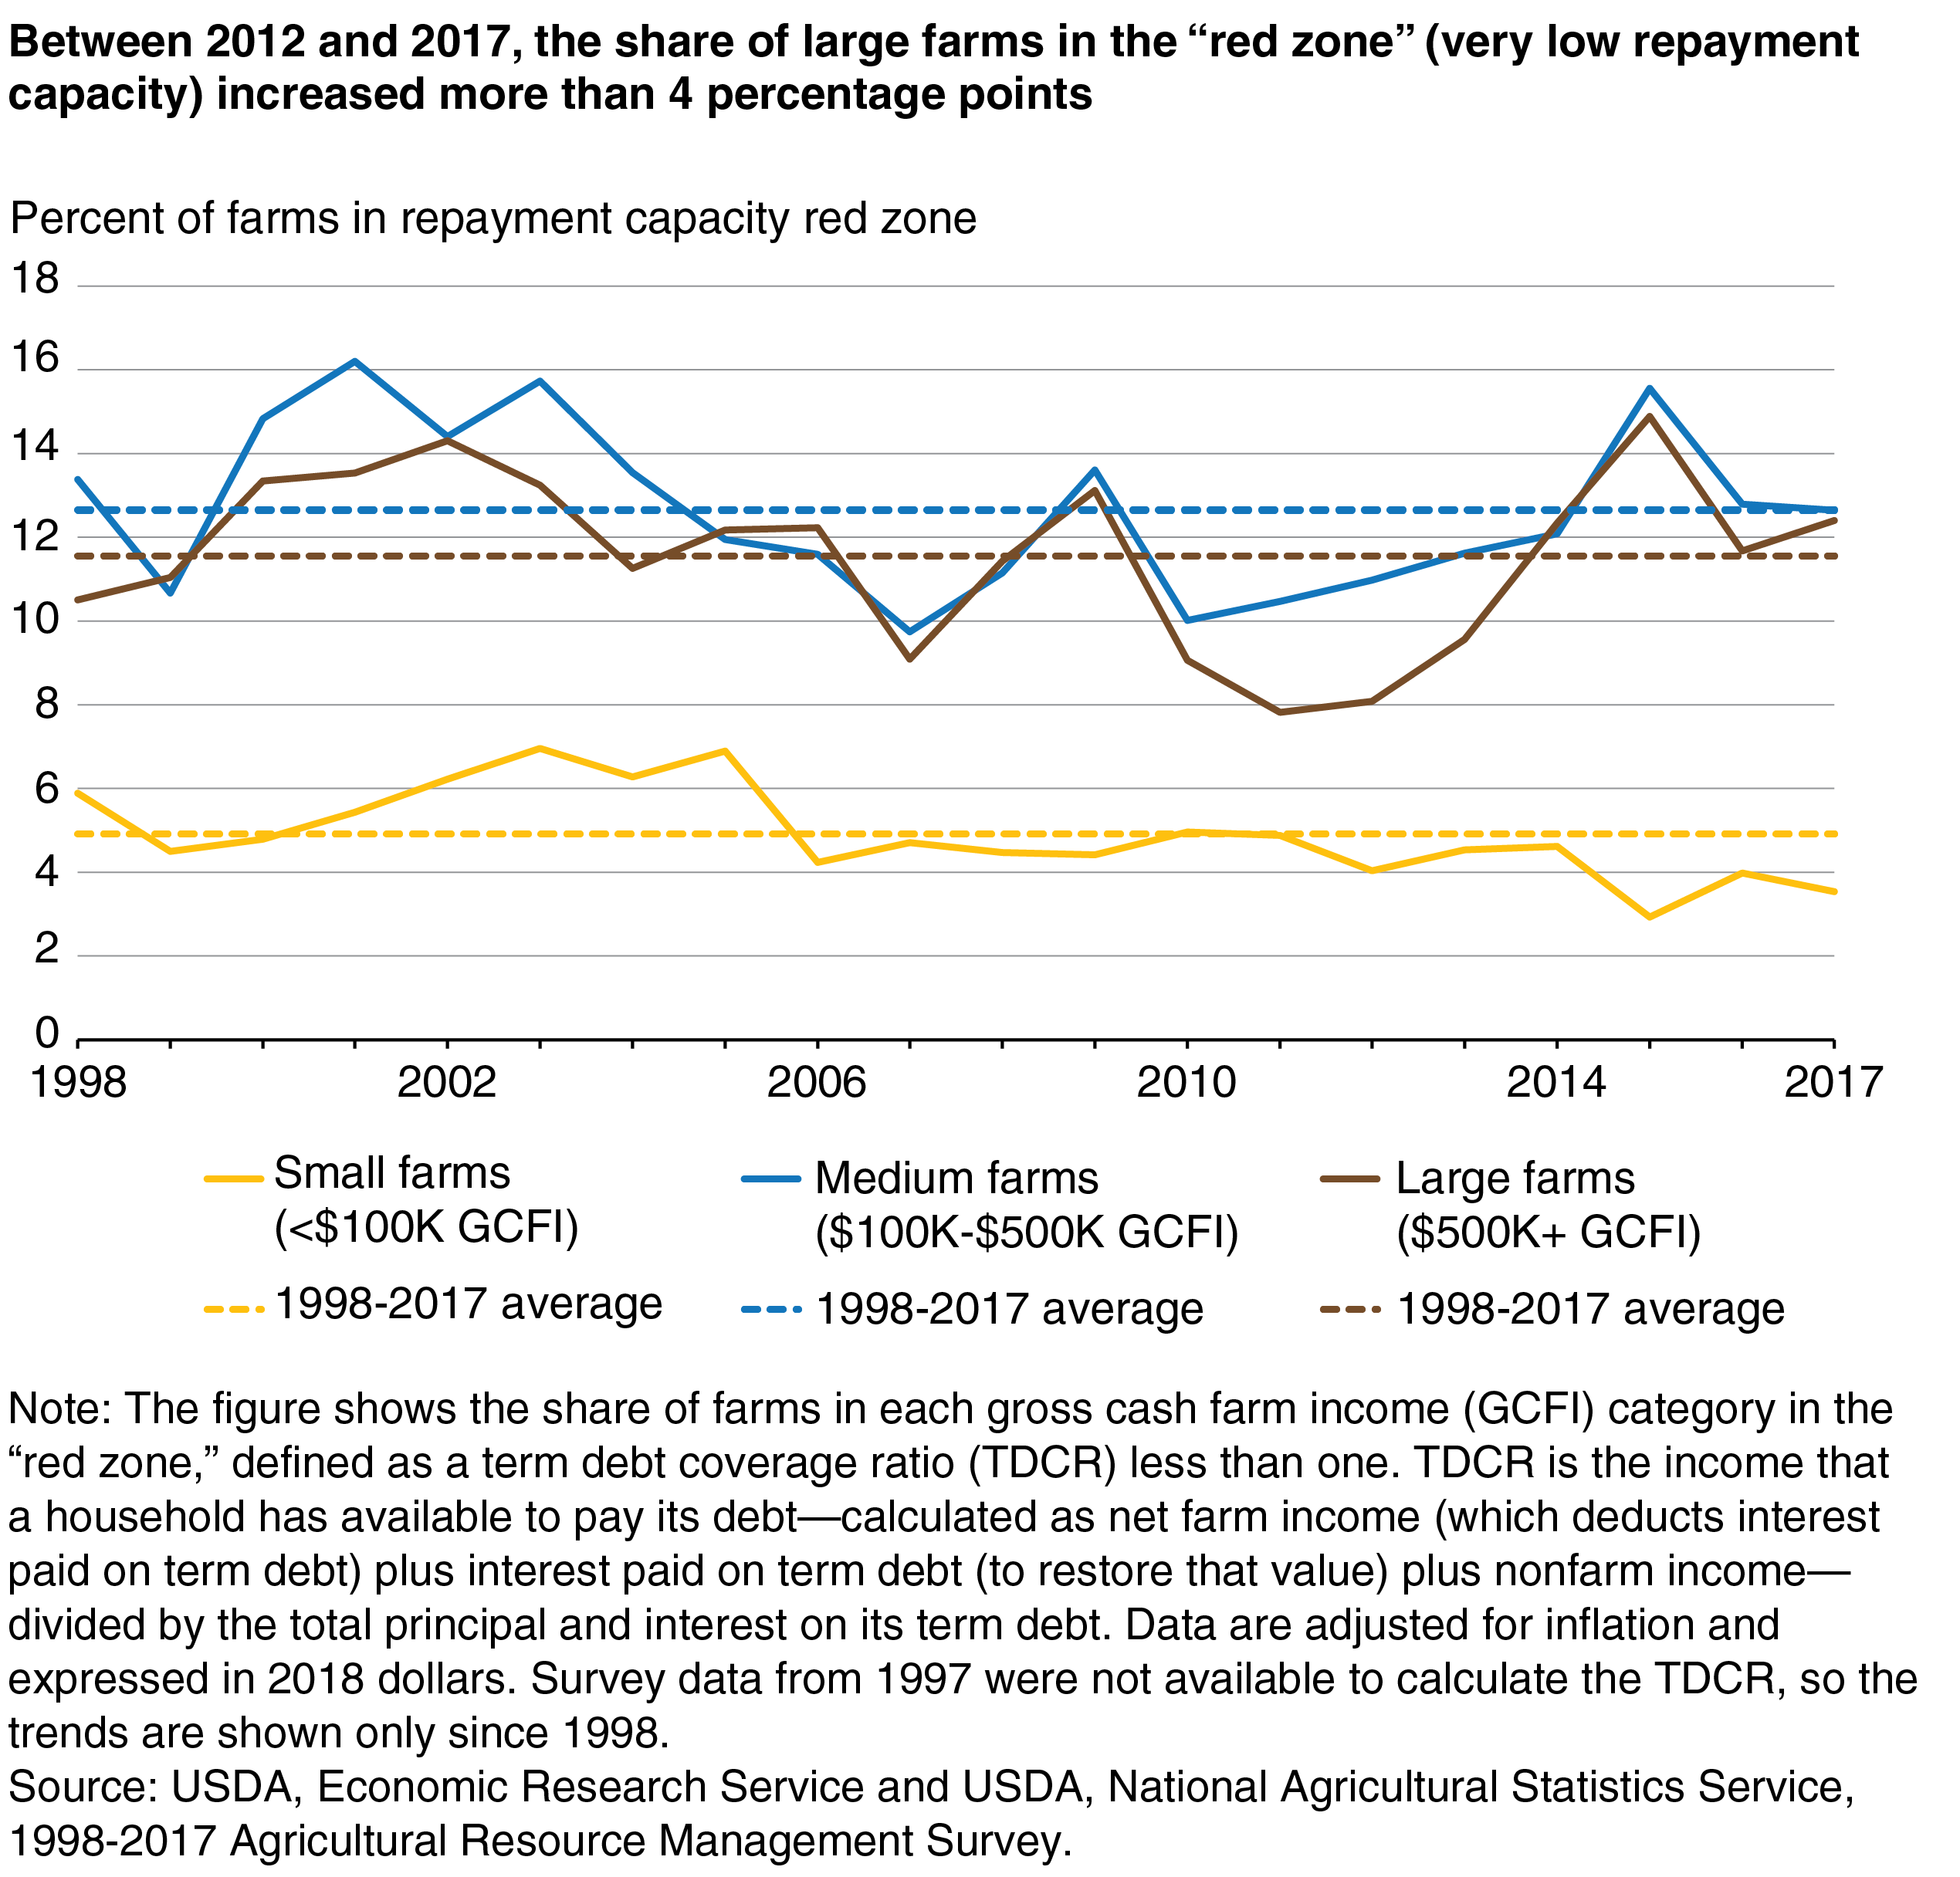
The term debt coverage ratio (TDCR) is often used to measure a farmer’s loan repayment capacity. TDCR is the income that a household has available to pay its debt divided by the total principal and interest on its term debt (debt that has a set payment schedule). A larger TDCR indicates a bigger margin to cover loan payments. A TDCR less than 1.0 indicates the farm household is in a repayment capacity “red zone” and does not have sufficient income to meet its loan payments.
The figure below shows how the percentage of farms in the red zone has evolved for three size categories: small farms with annual gross cash farm income (GCFI) less than $100,000, medium farms with annual GCFI between $100,000 and $500,000, and large farms with annual GCFI greater than $500,000. Over the last 20 years, the shares of medium and large farms with a repayment capacity in the red zone have exceeded the share of small farms in that zone. On average, households that operate small farms earn most of their income off the farm and have relatively little farm debt.
In the years following the 2012 peak in net cash farm income, the share of medium and large farms in the red zone increased. The increase was particularly steep for large farms—from 8.1 percent in 2012 to 12.4 percent in 2017. In contrast, small farms remained largely insulated from the downturn in the agricultural economy. Indeed, the share of small farms in the red zone fell slightly over this period. Because small farm households rely relatively more on off-farm income, the improved performance for small farms is likely due to the strengthening nonagricultural economy over this period. As the farm economy worsened and the nonfarm economy improved, small farms experienced a relatively small increase in farm debt (because they have smaller farms that require less capital) and a relatively large increase in household income (because they earn a larger share of their income from nonfarm sources).
In 2017, the shares of medium and large farms in the red zone were slightly above their respective 1998-2017 averages. However, for these farms, the repayment capacity is stronger than it was in 2002—the year with the lowest aggregate net cash farm income since 1996. Specifically, the 2017 shares of medium and large farms in the red zone was about 2 percentage points below the 2002 shares.
Liquidity
Liquidity refers to a business’s capacity to meet its short-term obligations without disrupting its normal operations—that is, how well a business can cover current liabilities (due within 1 year) using current assets (those which can be easily converted into cash within 1 year). Farmers face a number of recurring business costs, including input expenses, rents, and debt obligations. Current assets that can be quickly liquidated to pay for these recurring costs include savings in banks, certain types of livestock, and stored crops. Farm businesses require liquidity to be able to cope with a bad harvest or low commodity prices. Farmers without sufficient liquidity may be forced to sell noncurrent assets, such as real estate or farm equipment, or may have to take out new loans.
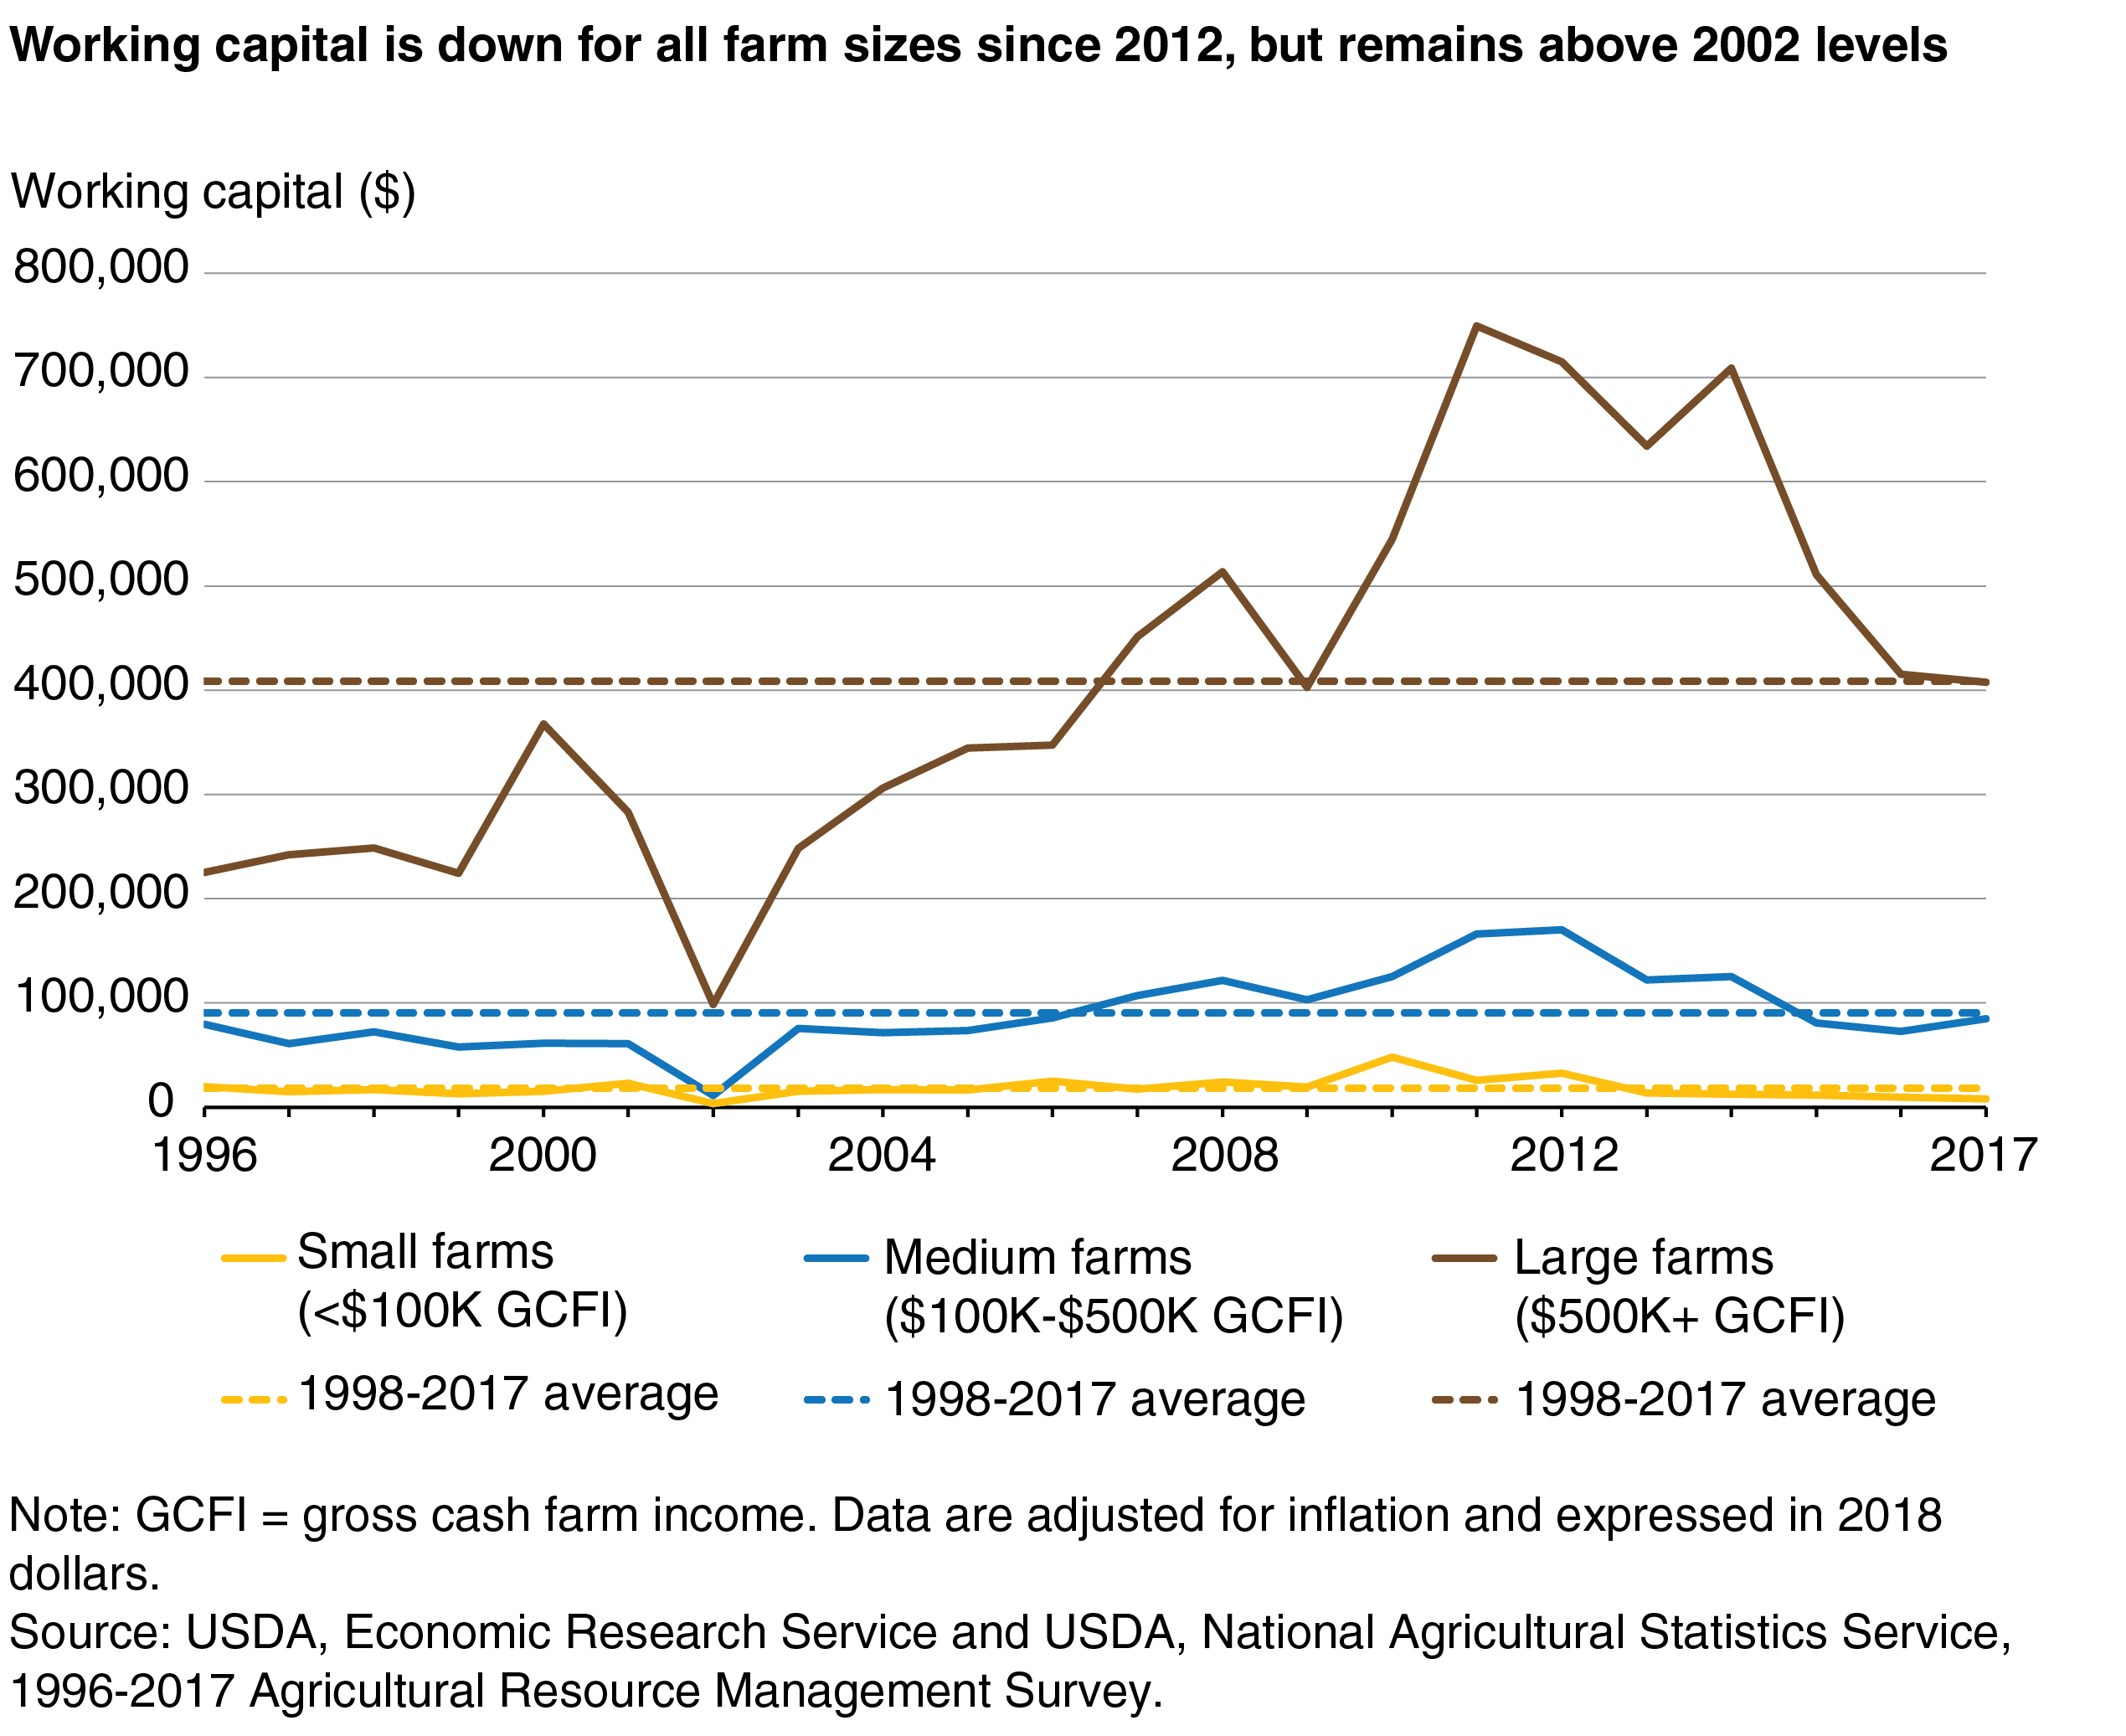
Working capital (current farm assets minus current farm liabilities) is a commonly used measure of liquidity related to the size of a farm business. Larger operations generally require more working capital than smaller operations. In low-income years, farmers may draw down their working capital to pay their normal business expenses. In high-income years, working capital may be accumulated.
Since reaching record highs in 2012, working capital for farms of all sizes has fallen as farm incomes have fallen and farmers depleted their savings and inventory to cope with lower revenues. Working capital for small, midsized, and large farm operations fell by 75 percent, 50 percent, and 43 percent, respectively. Despite these large declines, working capital remains close to long-run average levels for midsized and large farms, and substantially above 2002 levels, which were the lowest levels since 1996. For small farms, working capital is about half the long-run average but about double the 2002 level. Because off-farm income accounts for most household income for small-scale farmers, a low level of working capital is less indicative of imminent financial stress for these farm households.
Solvency
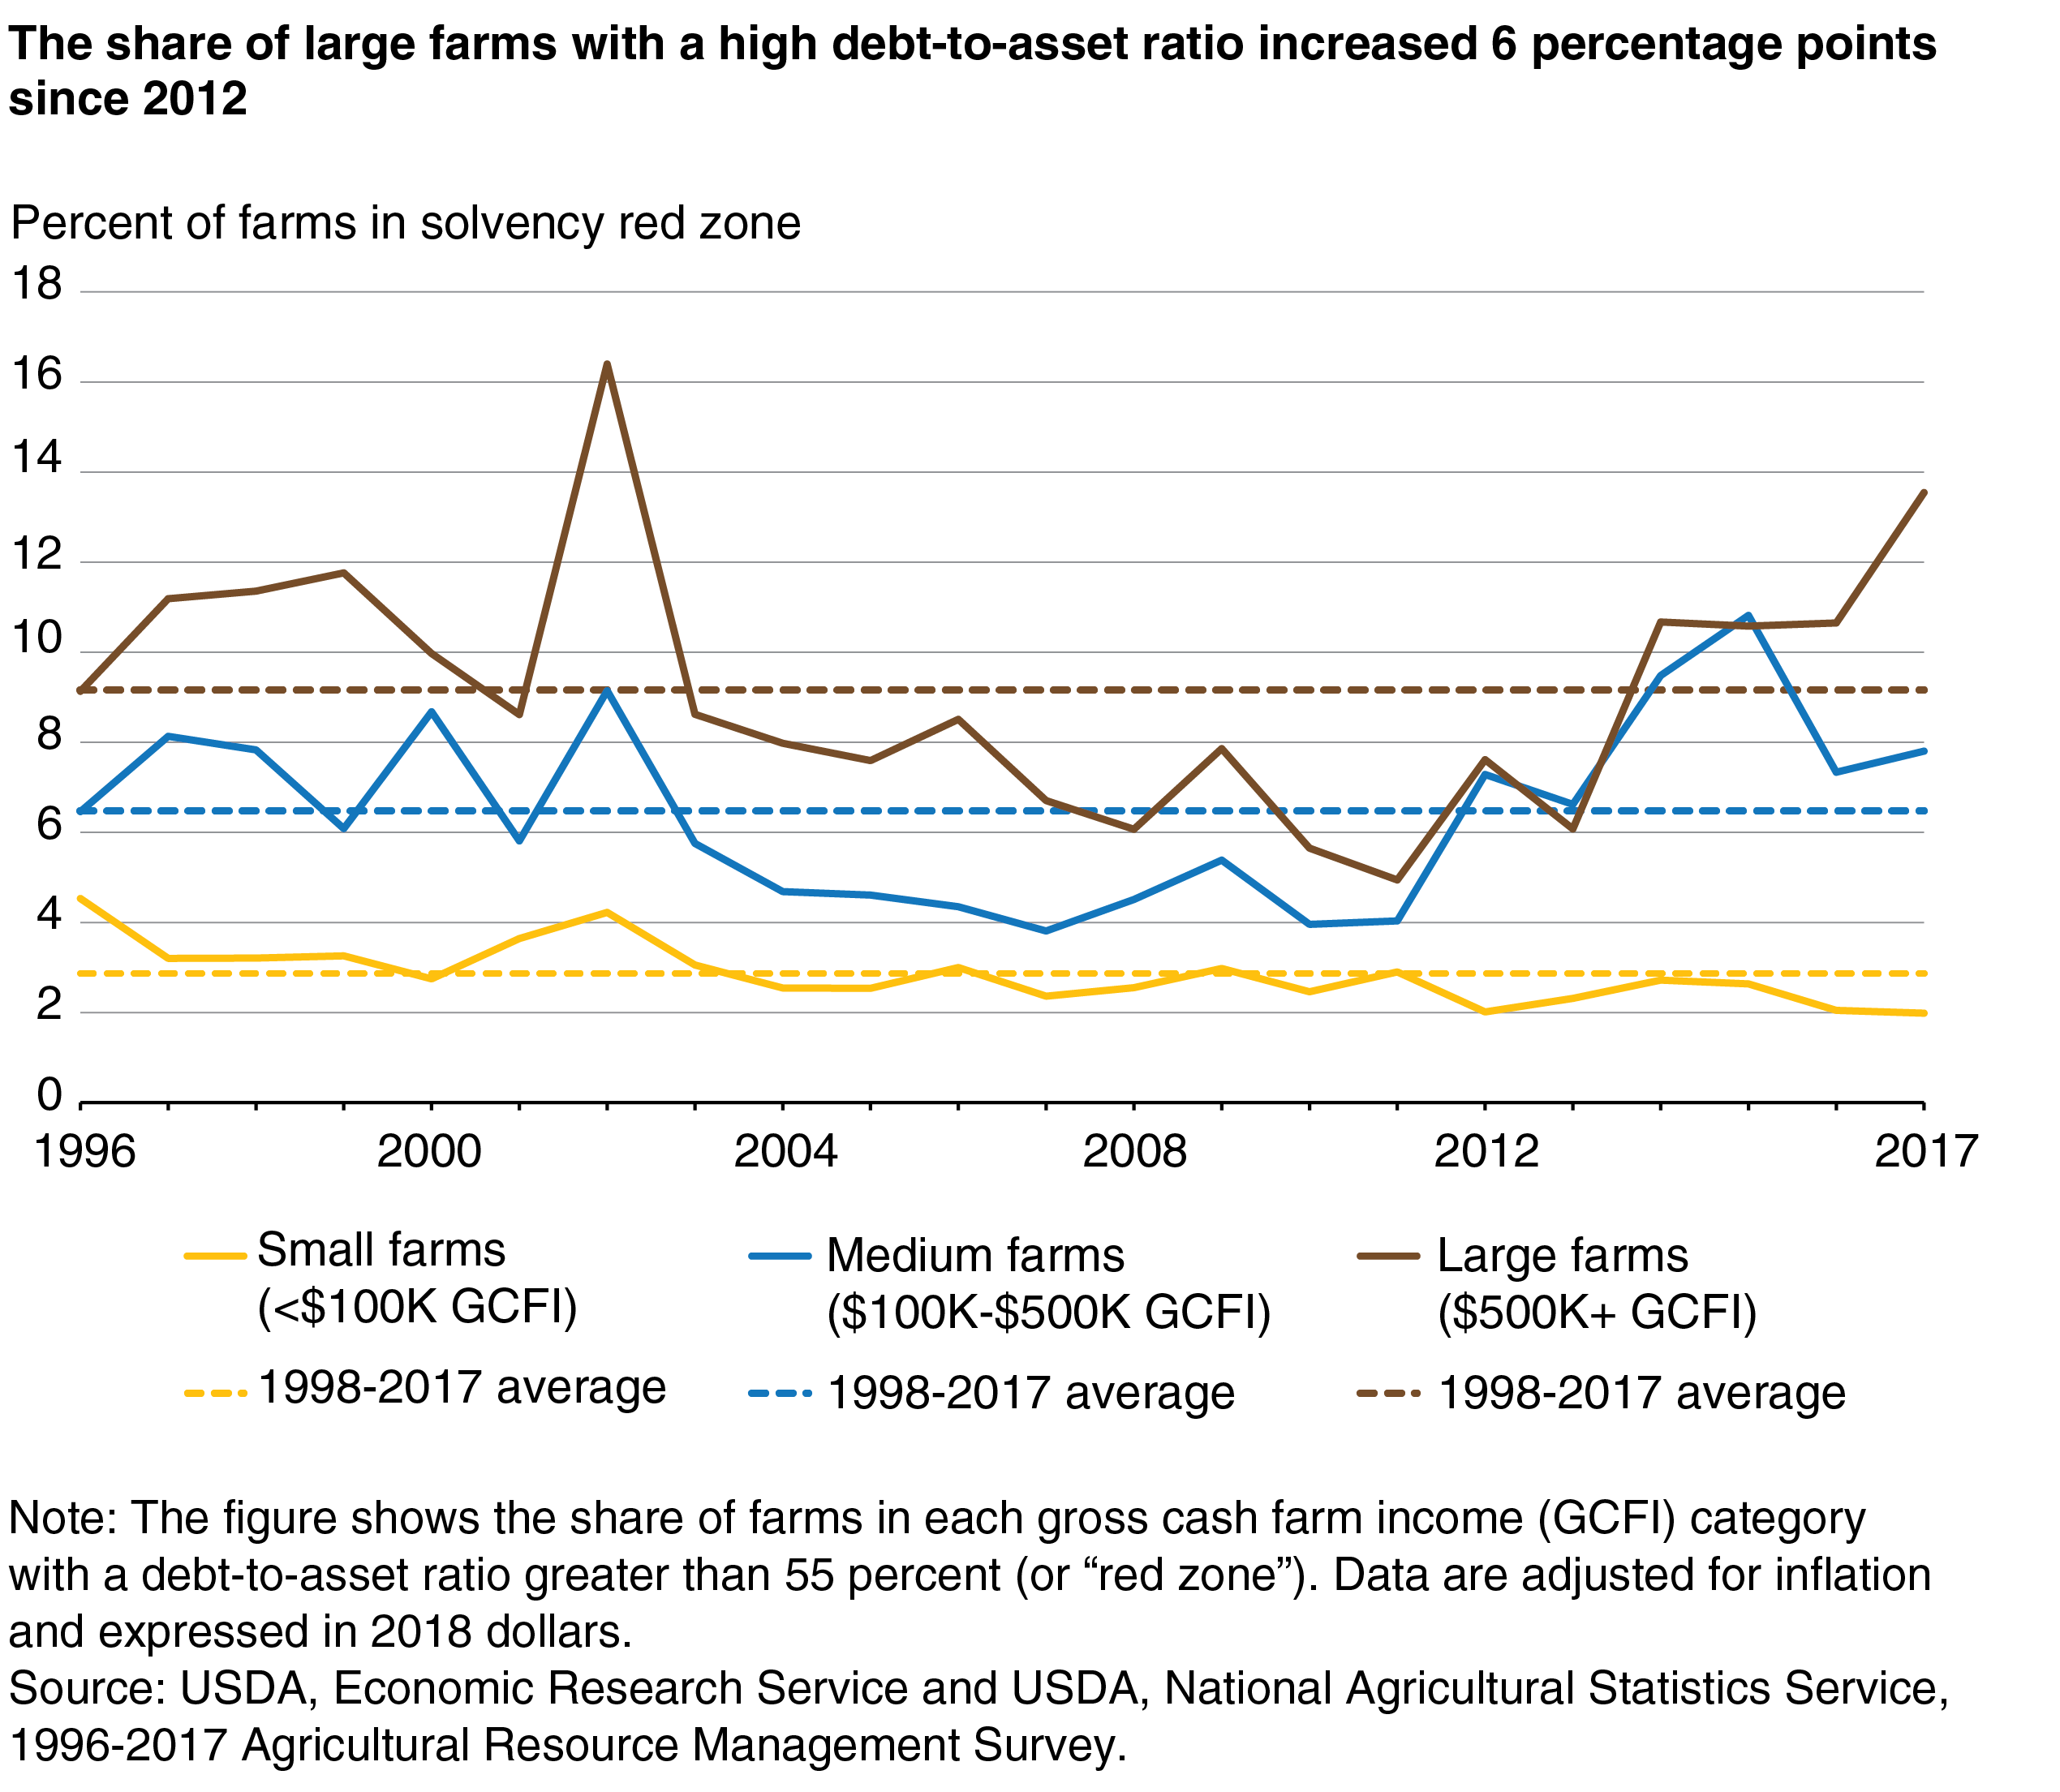
Solvency refers to the ability of an operation to meet its long-term financial obligations and remain in business. The debt-to-asset ratio—total farm debt divided by total farm assets—is a measure of solvency that is often used by lenders as an indicator of bankruptcy risk. Farms with a high debt-to-asset ratio generally have less ability to cover potential financial liabilities through the sale of assets, leading to a greater risk of default.
The figure below shows the share of operations in each farm size category that are in a solvency red zone—that is, a debt-to-asset ratio above 55 percent. Many farmers borrow to expand their scale of production. As a consequence, larger farms tend to have a higher debt-to-asset ratio than smaller farms. This relationship with scale extends to the share of farms in the debt-to-asset red zone: from 1996 to 2016, an average of 9.2 percent of large farms were in the red zone, compared to 6.5 percent of midsized farms and 2.9 percent of small farms.
Since 2012, the shares of midsized and large farms in the solvency red zone have increased and are now above their respective 1996-2017 averages. Large farms saw the greatest increase, with the share in the red zone rising from 7.6 percent in 2012 to 13.5 percent in 2017. In contrast, in 2017, the share of small farms in the red zone is essentially the same as it was in 2012. While the share of midsized and large farms in the red zone has increased in recent years, the current share remains below the peak levels in 2002.
Which Farms Would Be Vulnerable If Farm Income Were To Fall?
If farm incomes were to decline in the years ahead, more farmers would find it difficult to meet their debt obligations. Repayment capacity would decline, and more farmers would draw down their working capital stock. Some farmers without sufficient working capital may be able to obtain new loans to finance their production expenses, or they may be able to restructure their loans to reduce their debt payments. However, some of those who are unable to borrow or restructure their debt may have to sell their land, equipment, or other farm assets. The most financially stressed farms may be forced to sell their operations or file for bankruptcy protection.
To identify the types of farms that could be the most vulnerable to a further decline in farm income, ERS researchers estimated which farms in 2017 (the most recent year for which ARMS data were available) would be under “extreme financial stress” if there were a 10-percent or 20-percent decrease in gross cash farm income holding everything else constant, including input expenses. To put these numbers in perspective, gross cash farm income declined 11.7 percent from 2012 to 2016.
ERS researchers define “extreme financial stress” as being in both the repayment capacity and solvency red zones (a TDCR less than 1.0 and a debt-to-asset ratio greater than 55 percent). Such farmers would not have enough household income to meet their principal and interest payments—and thus would be unlikely to be able to obtain new loans.
| Percent change in GCFI from 2017 level | |||
|---|---|---|---|
| No change | 10 percent decline | 20 percent decline | |
| All farms | 1.1 | 1.3 | 1.6 |
| GCFI category | |||
| < $100,000 | 0.5 | 0.5 | 0.6 |
| $100,000 – $499,999 | 3.1 | 3.9 | 4.9 |
| > $500,000 | 3.7 | 5.2 | 6.7 |
| Commodity specialization | |||
| Grains and oilseeds | 2.3 | 3.0 | 4.0 |
| Specialty crops, fruits, nuts, nursery | 0.7 | 0.8 | 1.0 |
| General livestock | 0.6 | 0.7 | 0.7 |
| Dairy | 3.2 | 4.9 | 6.8 |
| Hogs and poultry | 3.8 | 5.0 | 5.9 |
| Operator age and experience | |||
| Young (below age 40) | 3.2 | 4.4 | 5.4 |
| Beginning (10 years or less) | 1.5 | 1.9 | 2.4 |
| Young and beginning | 2.8 | 4.0 | 5.3 |
| Note: “Extreme financial stress” is defined as having a term debt coverage ratio (TDCR) less than one and a debt-to-asset ratio greater than 55 percent. GCFI = gross farm cash income. A “beginning farm” is one in which all farm operators have 10 years or less farming experience on any operation. A “young farm” is one in which the principal operator is below age 40. Source: USDA, Economic Research Service and USDA, National Agricultural Statistics Service, 2017 Agricultural Resource Management Survey. |
|||
In 2017, only 1.1 percent of all farms were in extreme financial stress (table). However, the likelihood of being in extreme financial stress increases with farm size. Only 0.5 percent of small farms were in extreme stress in 2017, compared to 3.1 percent of midsize farms and 3.7 percent of large farms.
While the shares of midsize and large farms in extreme financial stress in 2017 were fairly similar, the share of farms in stress would increase more for large farms if farm revenue were to fall. For example, if gross cash farm income were to decline 20 percent, the share of large farms in stress would increase to 6.7 percent, compared with 4.9 percent for midsize farms. For midsize and large farms, the shares in this scenario would be the highest since at least 1998. The disproportionate increase in financial stress for larger farms stems from the role of off-farm income: large farms have relatively less off-farm income than midsize or smaller sized farms with which to compensate for a downturn in farm income. Consequently, more large-scale producers are likely to have a TDCR that falls below 1.0 when their sales decline.
Farms would be affected differently by a decline in gross farm income depending on their commodity specialization. Dairy farms, as well as hog and poultry farms, are more likely to be in extreme financial stress, compared to other farms. If gross income were to fall by 20 percent, the share of grains/oilseeds, hog, poultry, and dairy operations in extreme stress would increase between 1.7 and 3.6 percentage points. Dairy farms, which would see the biggest increase in the share of farms in extreme financial stress, tend to be relatively capital-intensive and highly leveraged operations and, therefore, more vulnerable to a decline in farm revenues. Dairy farms would also be more vulnerable because dairy farm households earn relatively little income from off-farm sources.
That table also shows the share of farms in extreme financial stress broken out by operator age and farming experience. Farms with young operators (below age 40) and beginning operators (10 years or less farming experience on any operation) tend to be smaller in scale. Despite this, the shares of young-operator farms (3.2 percent) and beginning-operator farms (1.5 percent) in extreme financial stress in 2017 are larger than the share of all U.S. farms (1.1 percent). Young or beginning operators may be more vulnerable to financial stress because they are more likely to borrow and have a higher debt-to-asset ratio. If sales were to decline by 20 percent, the shares of young and young-beginning farms in extreme financial stress would increase to 5.4 percent and 5.3 percent, respectively. The share of all beginning farms in financial stress would increase to 2.4 percent.
Financial Stress Concentrated on Certain Types of Operations
In recent years, U.S. farm sector income has fallen from near record highs, and farm real estate is no longer rapidly appreciating in value. The economic slowdown in the sector has made some types of farms more vulnerable to financial stress. Farm-level indicators of repayment capacity and leverage indicate that larger farms (those with at least $100,000 in annual gross income) are more likely to be in financial risk than smaller farms. Larger farms may be more financially vulnerable than smaller farms because they derive a greater share of income from the farm and earn less income off-farm. It is possible that if farm income goes down, operators of large farms would be more likely to need to borrow more to meet their expenses—that is, they could not as readily cover their production losses with their off-farm income without borrowing.
While the measures of financial stress for larger operations have worsened since 2012, the indicators of repayment capacity and solvency indicate that most of these large farms are not in “red zones” that indicate financial stress. In addition, the financial measures are currently near their 1996-2017 average levels and are lower than recent peak levels in 2002.
If gross cash farm income were to fall by 20 percent from 2017 levels, the share of all farms in extreme financial stress would increase about 0.5 percentage points. However, certain types of farms could see larger increases. The share of farms in extreme financial stress would increase the most in percentage-point terms for large-scale farms, for farms with a principal operator under age 40, and for dairy farms.
This article is drawn from:
- Lyons, G. (2019). Financial Conditions in the U.S. Agricultural Sector: Historical Comparisons. U.S. Department of Agriculture, Economic Research Service. EIB-211.
You may also like:
- Farm Income and Wealth Statistics. (n.d.). U.S. Department of Agriculture, Economic Research Service.
- Farm Sector Income & Finances. (n.d.). U.S. Department of Agriculture, Economic Research Service.
- Key, N., Litkowski, C. & Williamson, J. (2018, July 2). Current Indicators of Farm Sector Financial Health. Amber Waves, U.S. Department of Agriculture, Economic Research Service.


