Current Indicators of Farm Sector Financial Health
- by Nigel Key, Carrie Litkowski and James Williamson
- 7/2/2018
Highlights
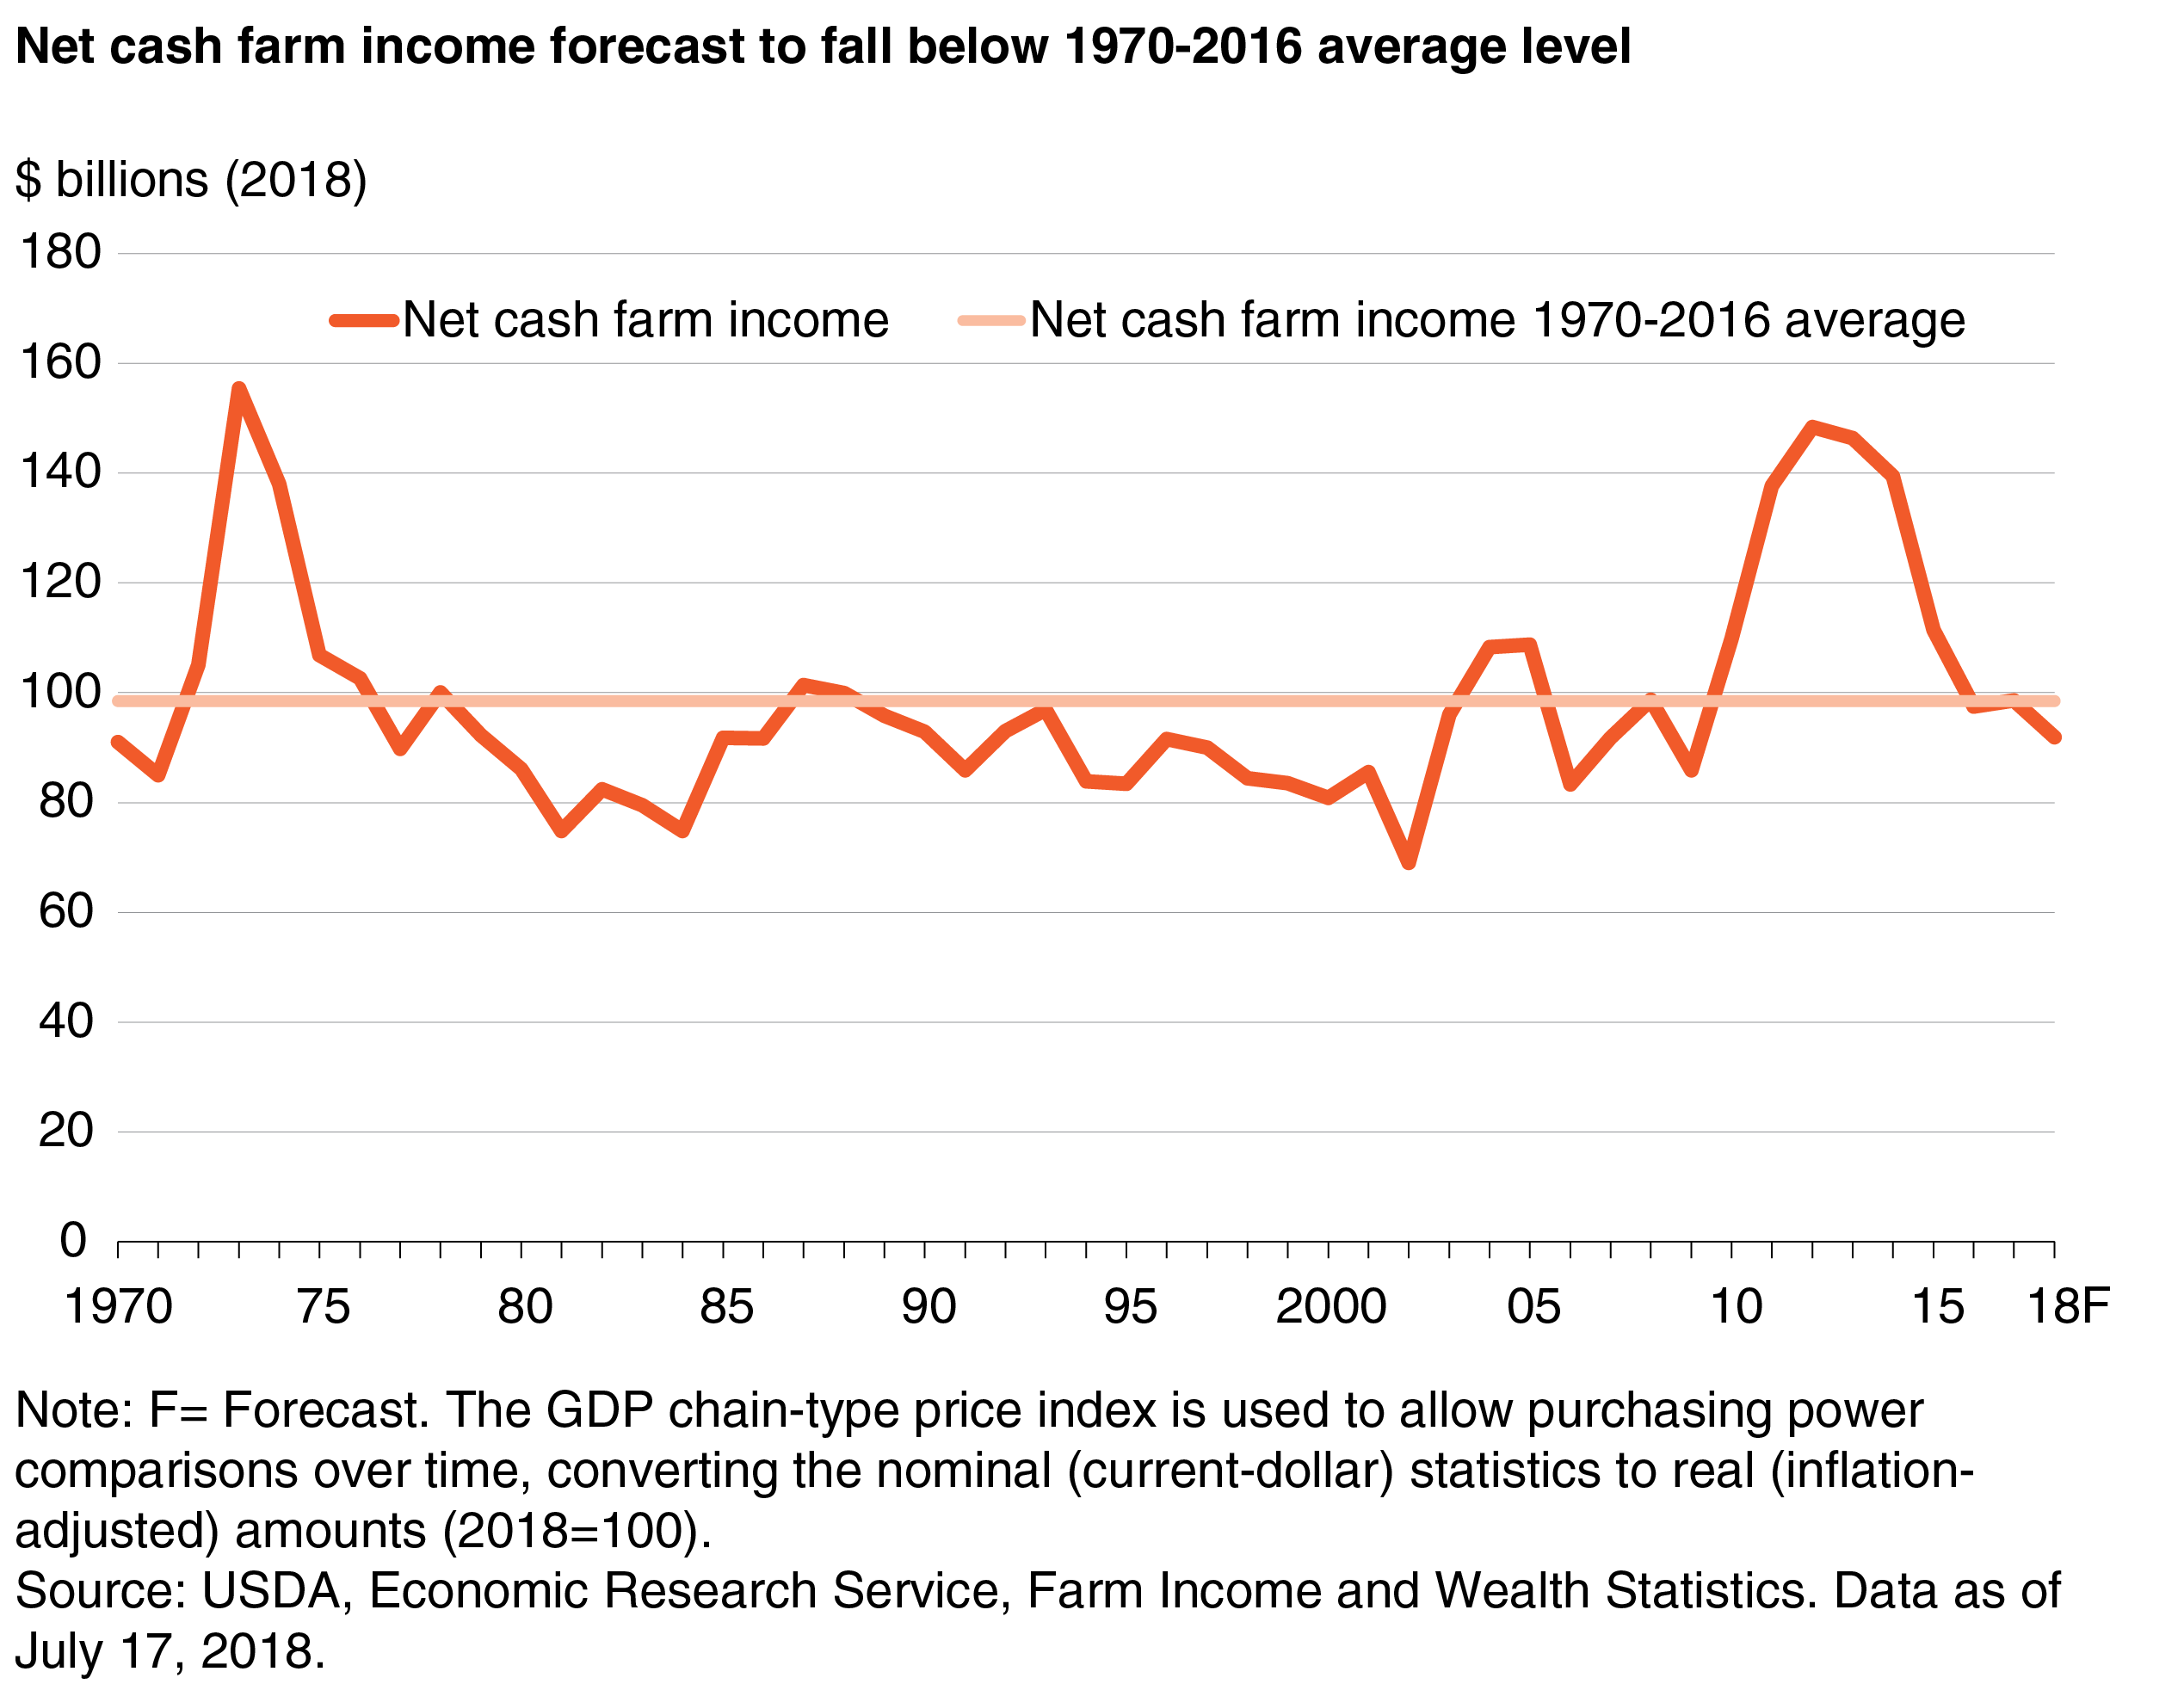
- Inflation-adjusted net cash farm income for the sector is forecast in 2018 to be 38 percent lower than its peak in 2012 and 7 percent below its 1970-2016 average.
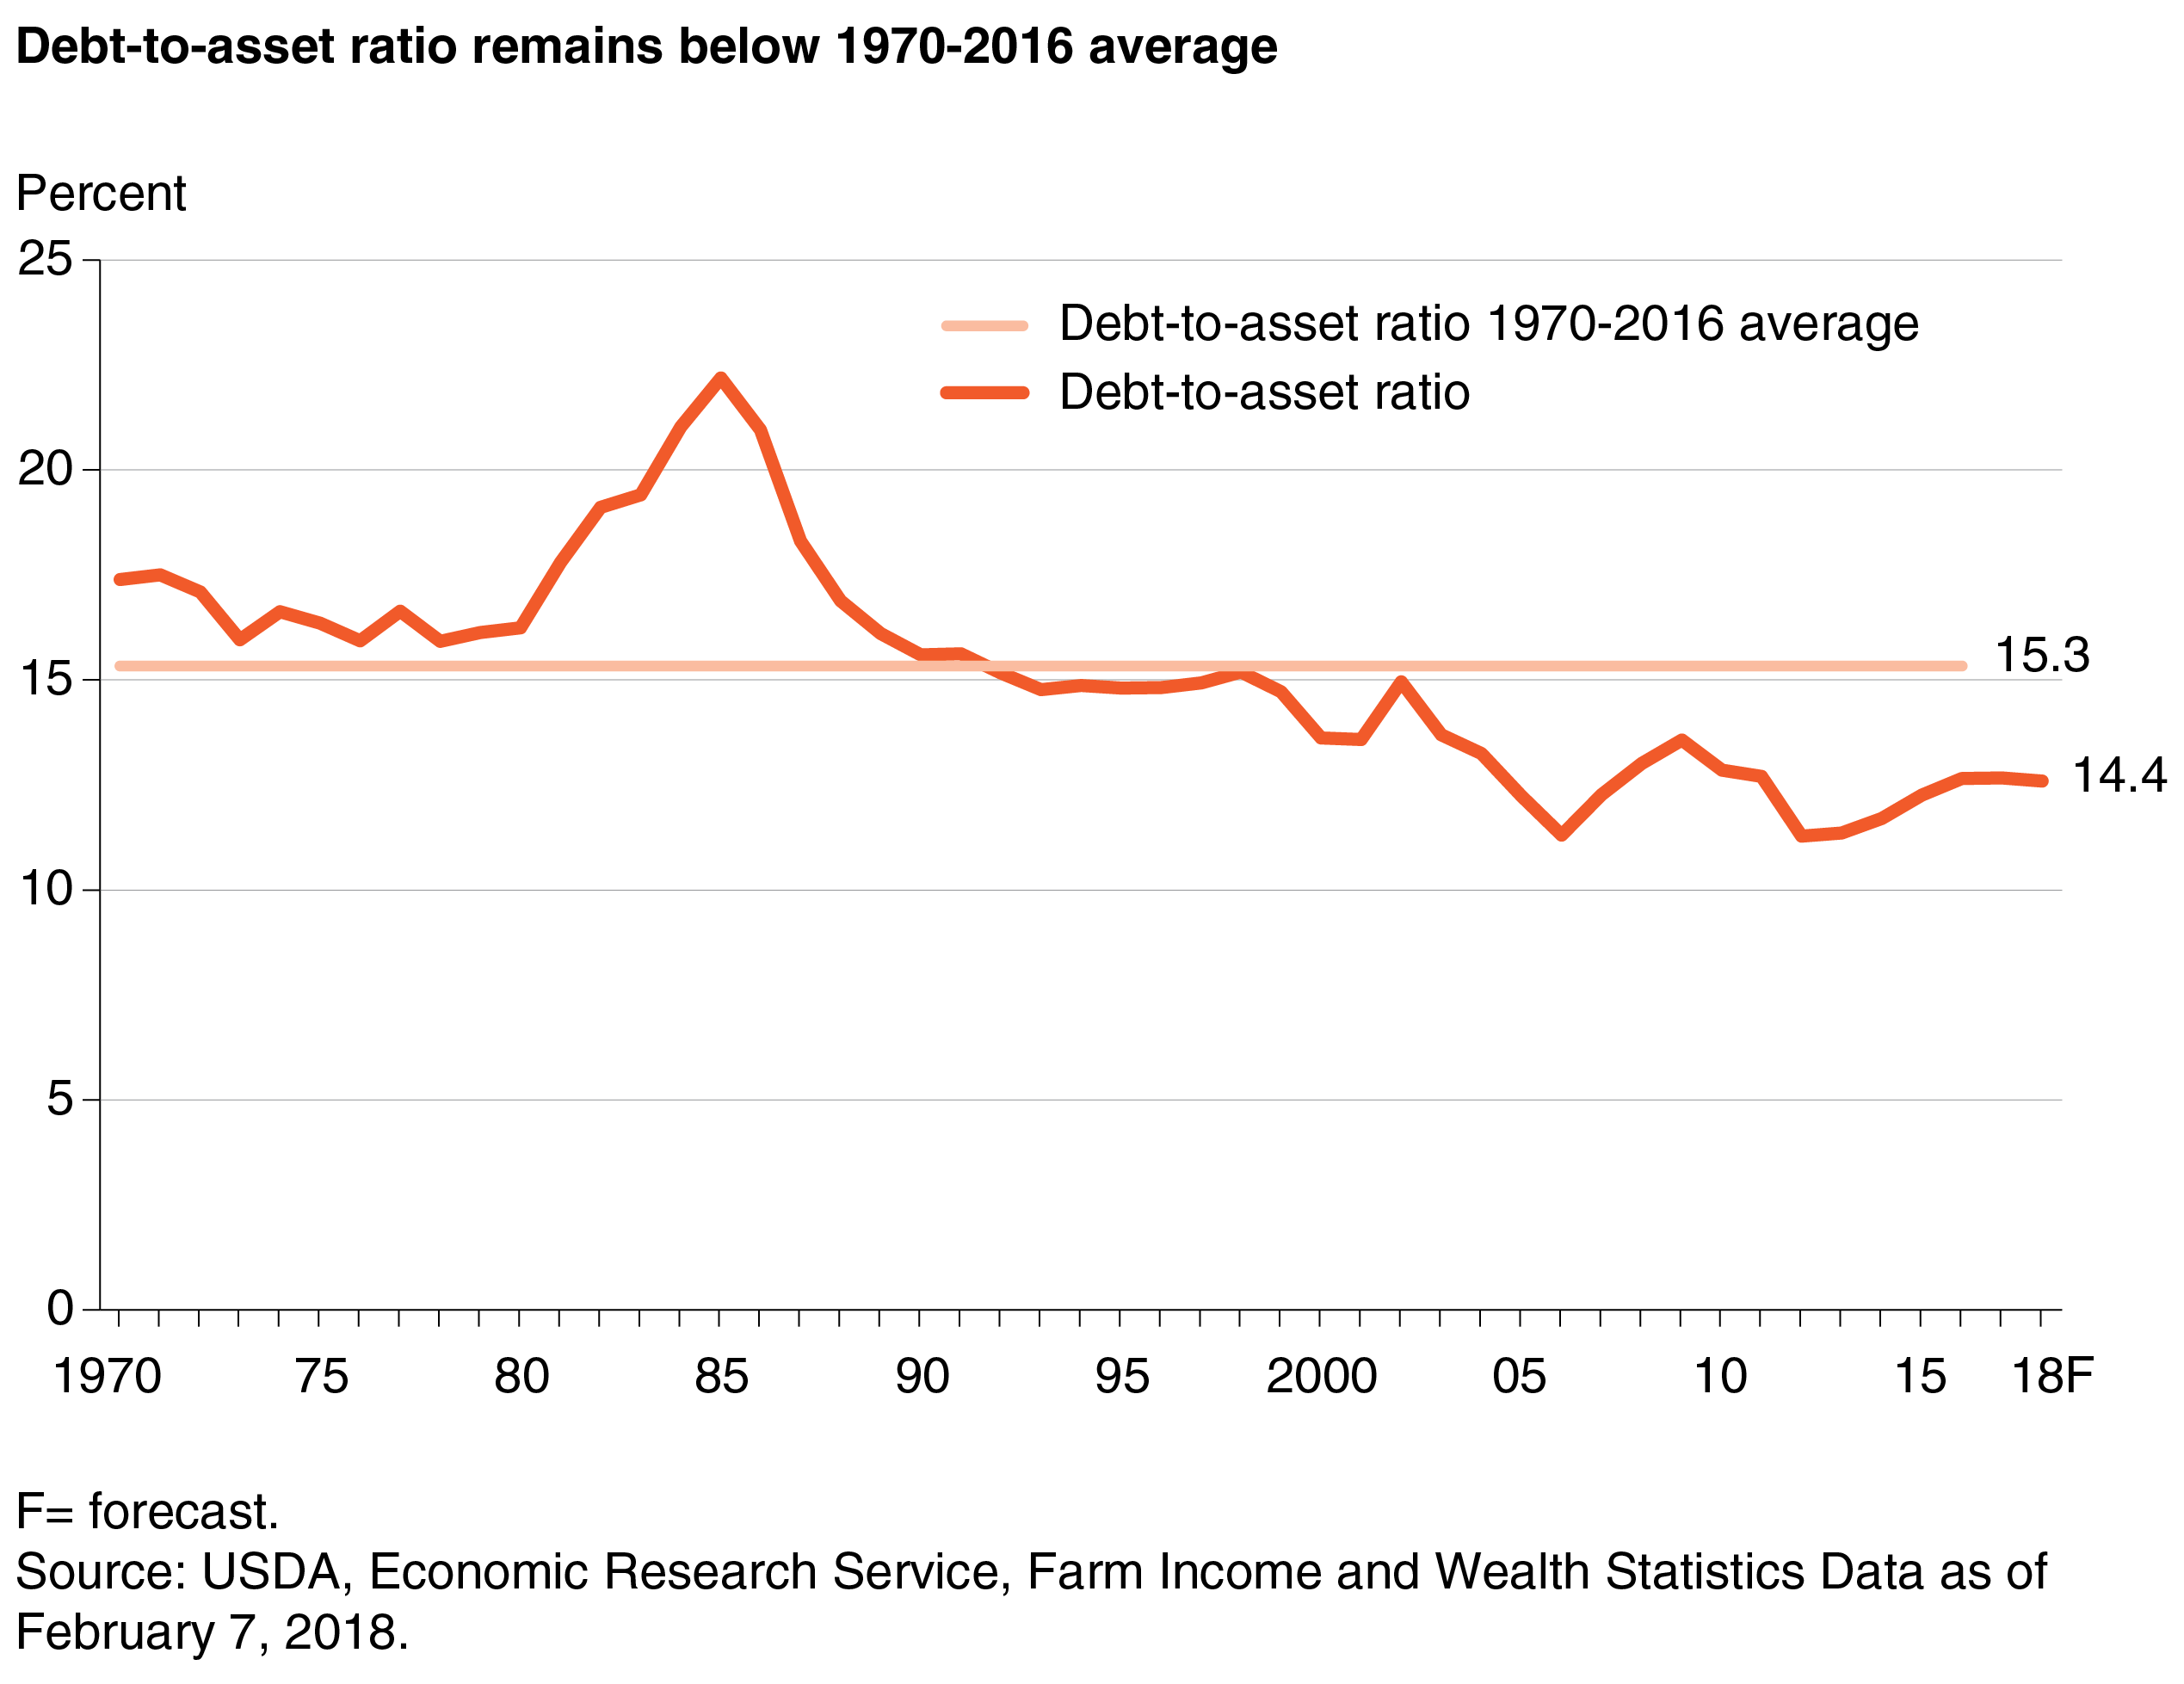
- The farm sector’s debt-to-asset ratio, a key indicator of financial solvency, reached a historic low in 2012 and has remained low since then by historic standards.
- If farm income remains near current levels, projected interest expense-to-farm earnings ratios suggest that the farm sector is unlikely to face extensive debt repayment challenges by 2019.
Following a steep decline in agricultural commodity prices, the past several years have seen a weaker market for farmland and an uptick in interest rates. At the same time, farm sector income has declined and farm interest expenses have increased. Lower commodity prices in the near future could likely further reduce farm receipts, making it more difficult for some farmers to meet their loan obligations and pay for production expenses. Higher interest rates could compound this problem by increasing loan service obligations for farmers with variable interest rate loans. Farmers who made substantial investments in machinery or land when commodity prices and farm incomes were high could face a drop in liquidity and elevated risks of financial insolvency. How vulnerable might the farm sector be to a further decline in commodity prices or rise in interest rates? This article examines the financial health of the U.S. farm sector by comparing measures of financial performance relative to their historic levels and to past periods of extreme financial stress.
Net Cash Farm Income Has Fallen to Near Long-Run Average Levels
Farm sector net cash income is annual income from cash receipts, cash farm-related income, and Government farm program payments minus cash expenses paid during the year. Farm sector net cash farm income is a measure of the profitability of farming and, hence, the ability of farmers to meet their loan obligations, invest in new machinery, remain in production, expand their operations, and provide for family living expenses. Beginning in 2010, inflation-adjusted farm sector net cash income rose to record highs, peaking in 2012. Much of this growth was due to commodity cash receipts, which increased 34 percent ($113.2 billion) from 2009 to 2014. This change in receipts was driven largely by higher commodity prices, reflecting increased domestic demand for biofuels and increased foreign demand for agricultural commodities, as well as higher corn and soybean prices due to a drought in the Midwest and Great Plains in 2012.
Following the high incomes in 2012 and 2013, the sector’s net cash farm income started to decline in 2014, fell more sharply in 2015, and continued to decline in 2016. During the 2016 growing season, increased plantings, combined with good weather, led to record U.S. farm production and added to large stocks on hand for many major commodities due to multiple consecutive years of high production levels. Slowing global demand, a strengthening dollar, and large inventories depressed crop as well as animal and animal product prices and contributed to the decline in 2016 net cash farm income. Incomes in 2017 and 2018 are forecast to remain near or just below 2016 levels.
From 2012 to 2016, farm sector net cash income fell 34 percent ($50.9 billion) to $97.5 billion, after adjusting for inflation. This is the largest multiyear decline since the 1970s in both absolute and percentage terms. Prices received by farmers for all major commodities fell, with many (such as prices for corn, wheat, and milk) down 30 percent or more from highs recorded just a few years earlier. From 2016 to 2018, inflation-adjusted net cash income is forecast to fall 5.5 percent ($5.4 billion). This decline reflects an expected drop in Government payments and commodity cash receipts.
The recent declines in net cash income for the farm sector are large in percentage terms. But, when viewed over a longer time horizon and after adjusting for inflation, net cash farm income is forecast to return near to the levels observed before the record growth from 2010 to 2013. The sector’s net cash income in 2018 is forecast to be 7 percent below the average across 1970-2016 and about 1 percent higher than the average net cash farm income from 2000 to 2009.
Incidence of Negative Farm Income
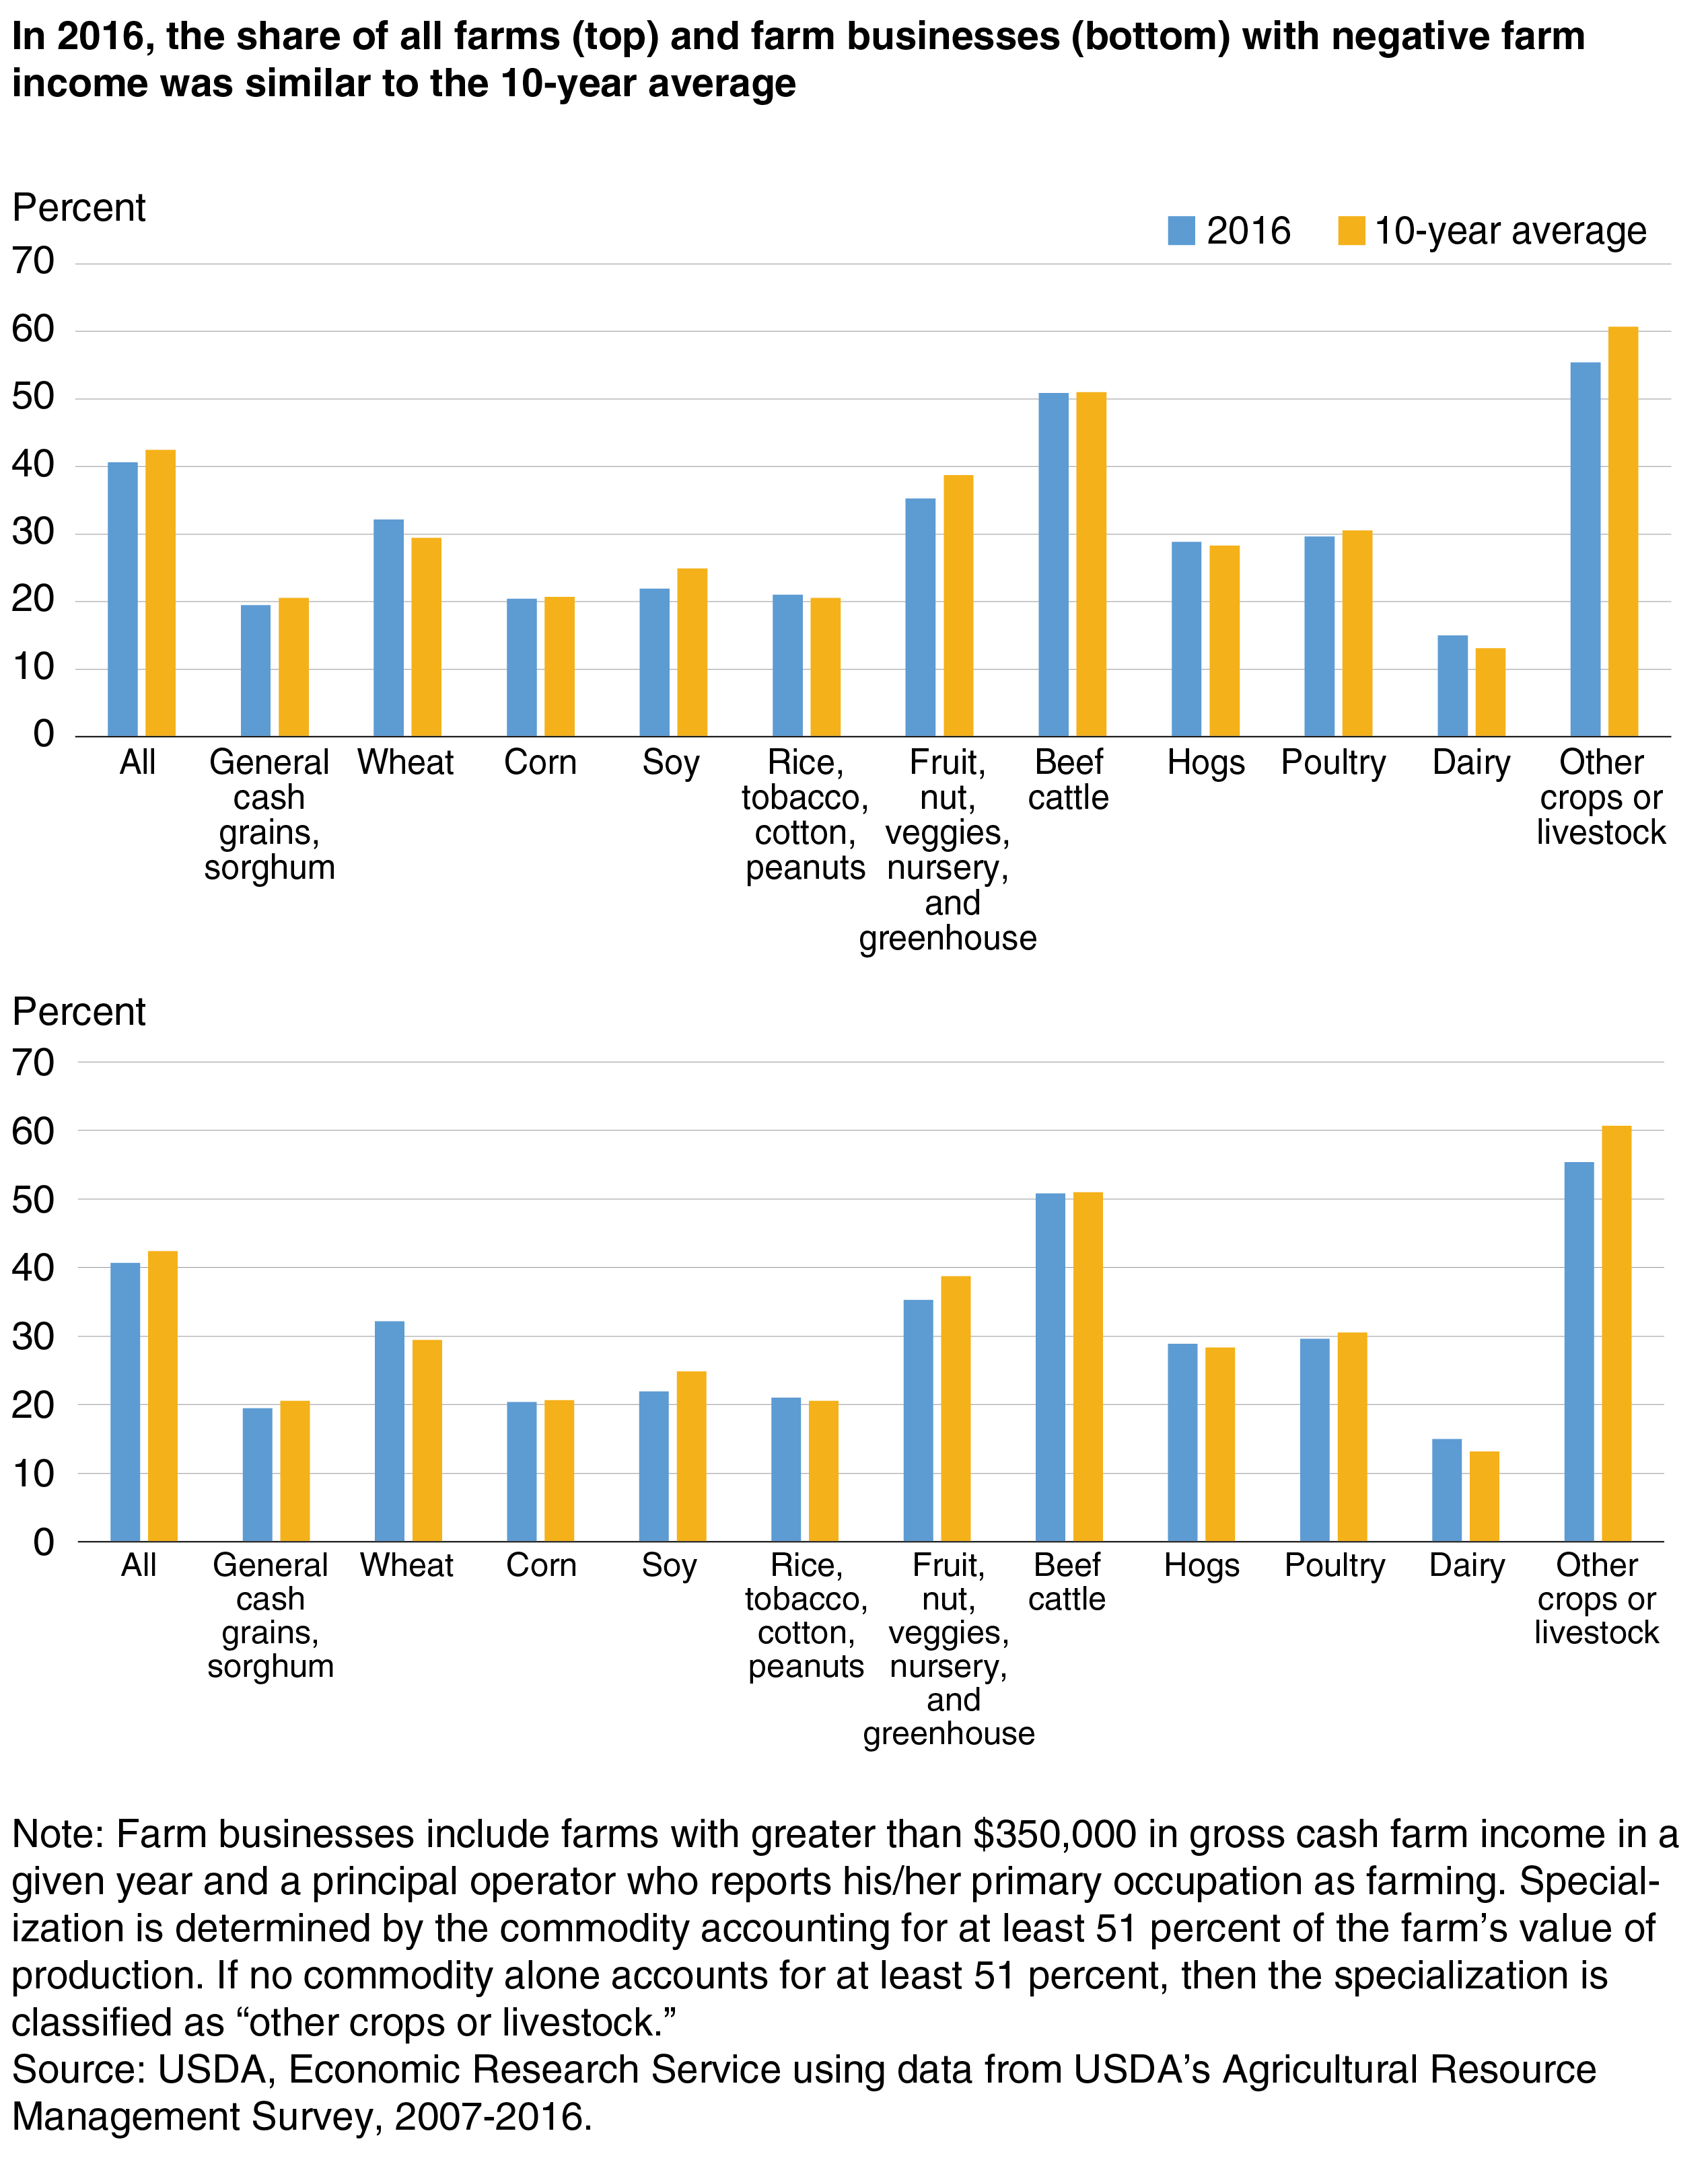
The incidence of negative farm income provides another measure of farm financial health. Farms that fail to earn positive returns because of crop failure, low commodity prices, or high production costs will be more susceptible to bankruptcy. Using the most recent data available from USDA’s Agricultural Resources Management Survey (ARMS), ERS analyzed the share of farms reporting negative farm income throughout the 10-year period 2007-16. Different farms tend to be surveyed in ARMS each year, but the data indicate that, in aggregate, 56 percent of all farms reported negative net cash farm income across the period, with the share increasing slightly since 2014. As expected, farm businesses (the roughly 40 percent of farms with gross cash farm income greater than $350,000 in a given year as well as farms in which the principal operator reports his/her primary occupation as farming) registered lower rates of negative income than did farms as a whole. Across the 10 years of data, 42 percent of farm businesses reported negative income.
Farms with different commodity specializations may fare differently when the overall farming sector strengthens or weakens. ERS examined more detailed ARMS data to determine the farm specializations more likely to have negative farm incomes overall and to identify any apparent patterns in 2016, compared to the average across 2007-16. The data show considerable variability across farm specializations over time, compared to the average for “all farms.” “Other crops or livestock” farms, where no commodity is the dominant contributor to the total value of production, had the highest rates of negative incomes. Beef cattle farms and poultry farms had the next highest rates. Dairy farms had the lowest rate of negative incomes across all farm types. Some of the variation across specialization categories stemmed from idiosyncratic trends in commodity prices—some commodities saw prices increase or decrease more than others over the study period. And some of the variation was attributed to differences in farm structure—larger operations are more likely to earn high and positive farm income than smaller operations because they are able to spread the fixed costs of machinery and other inputs over a larger amount of production. For farm businesses, the rates of negative farm income follow the same relative ranking as with all farms, though the rates were generally lower, reflecting the fact that farm businesses are larger operations.
Despite the recent sharp decline in farm income, the share of farms with negative income in 2016 remained about the same as the average share in 2007-16. Among all farms, 5 of the 11 commodity specialization categories saw an increase in the rate of negative farm income in 2016, compared to the average rate in 2007-16. Overall, the share of all farms with negative income was about 3 percentage points lower in 2016 than the 10-year average. The data suggest that recent low farm prices are not causing a surge in the number of farms experiencing negative income.
Farm Debt, Interest Expenses and Financial Solvency
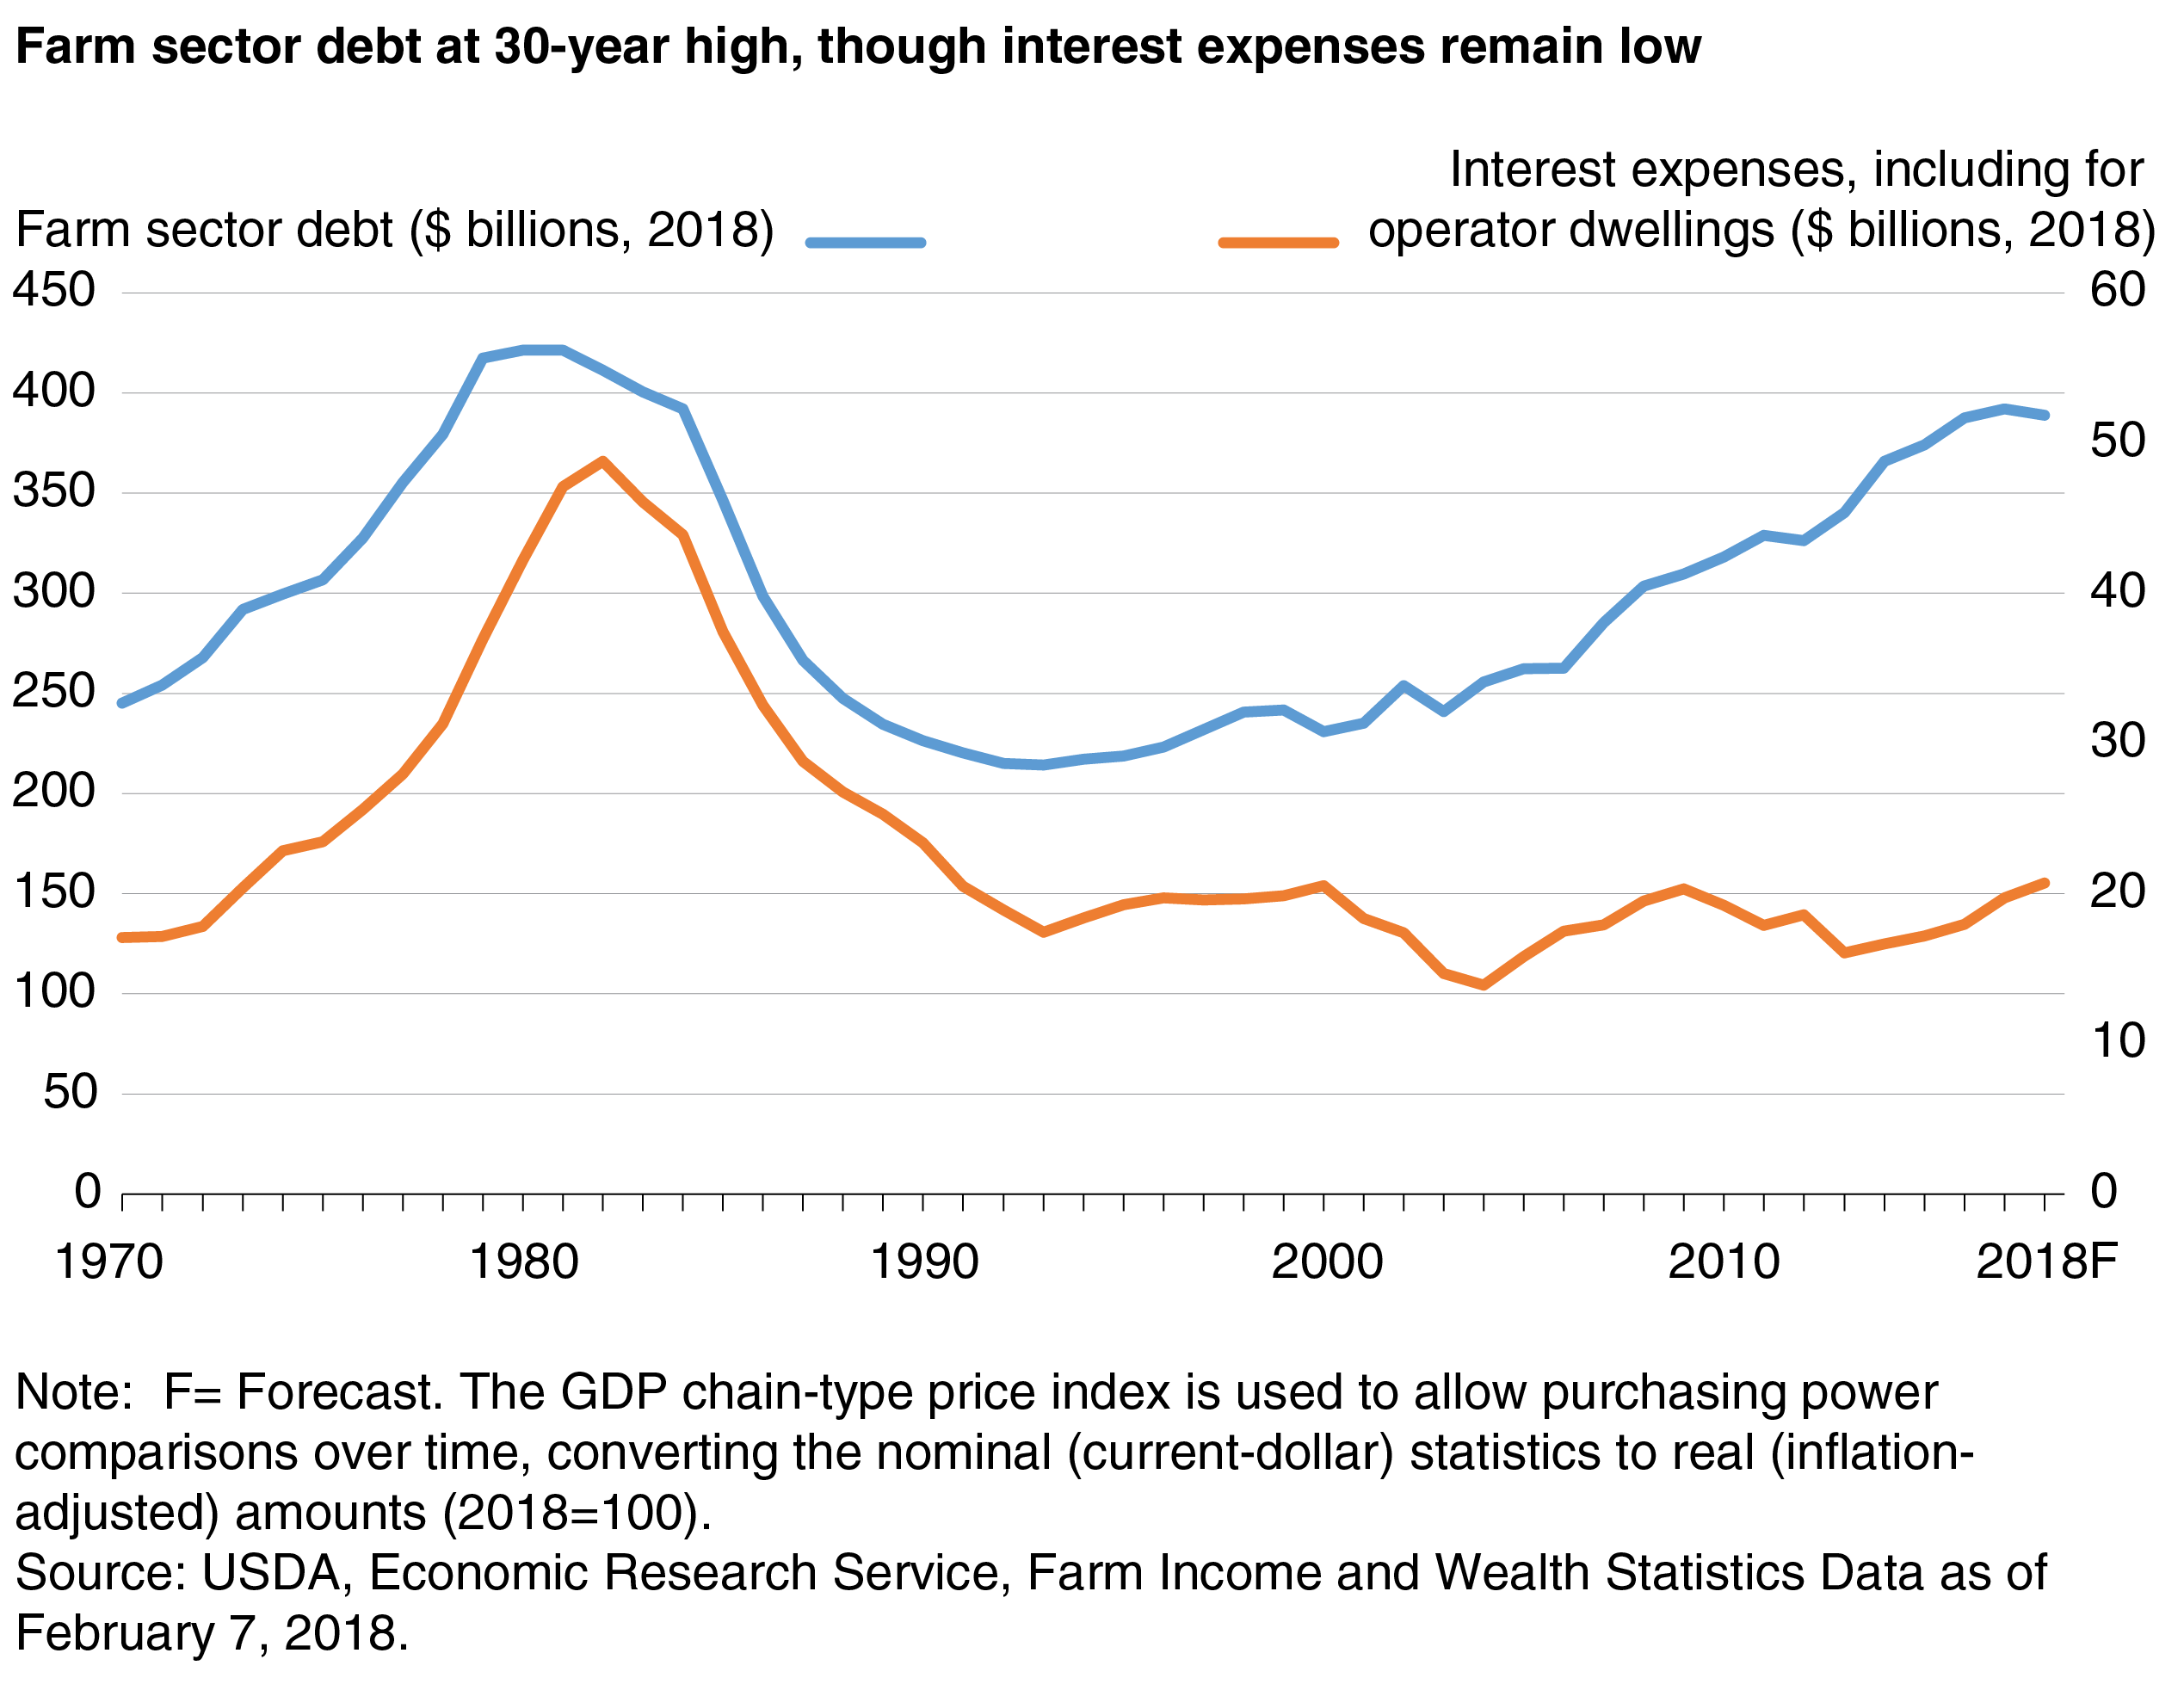
Since the farm crisis of the 1980s, much attention has been paid to farm sector debt and interest expenses. In the 1970s, farmers increased their borrowing to purchase land, equipment, and other inputs in order to take advantage of high commodity prices. At the same time, the economy was experiencing high inflation rates and rising interest rates. High levels of debt and rising interest rates caused the farm sector’s debt and interest expenses to reach record levels by 1980. In the decade that followed, commodity and farmland prices fell, and many farmers who were heavily in debt went out of business.
Do recent trends in debt and interest payments suggest the farm sector may soon face another pending farm crisis? Farm sector debt has reached levels near the peak levels of the late 1970s and early 1980s. From 1994 to 2016, inflation-adjusted farm debt increased by 79 percent, or 3 percent per year on average. ERS forecasts farm debt to increase 1 percent in 2017 and then decline 1 percent in 2018. Total farm sector debt in 2016 is 8 percent ($34 billion) below the peak in 1980 in inflation-adjusted terms.
Despite the large increase in farm debt over the past decades, interest expenses have remained relatively stable since about 1990 due to declining interest rates. From 1994 to 2016, interest expenses decreased 2 percent, or 0.2 percent per year on average in real (inflation-adjusted) terms. However, in recent years, interest expenses have trended upward as interest rates have increased. Between 2014 and 2018, interest expenses are forecast to increase 24 percent in real terms. Interest expenses are now above their average levels but well below levels reached in the 1980s. Interest expenses in 2018 are forecast to be 9 percent above the 30-year average, 13 percent above the 10-year average, but 58 percent below the peak in 1982.
The debt-to-asset ratio—total farm debt divided by total farm assets—is another indicator of the financial health of the agricultural sector. The debt-to-asset ratio is a measure of a farm business’s leverage and is considered an indicator of bankruptcy risk. Farms with a high debt-to-asset ratio are generally more highly leveraged and have less ability to cover potential financial liabilities through the sale of assets, leading to a greater risk of default.
In the 1970s, farms borrowed heavily to expand production in response to rising commodity prices. Beginning in the early 1980s, higher interest rates, which raised borrowing costs, and lower commodity prices led to a large number of farm bankruptcies. Farm real estate, which accounts for over 80 percent of farm sector asset values, fell over 40 percent in inflation-adjusted value between 1981 and 1987. The high levels of farm debt combined with falling land values caused the debt-to-asset ratio to spike during the mid-1980s. The high debt-to-asset ratio during this period indicates that many farmers were financially stressed.
In contrast to the 1980s, recent decades have seen farm assets appreciate more rapidly than debt. From 1994 to 2016, farm sector assets grew in value by 110 percent, or 5 percent annually, driven by strong growth in land values up to around 2014. As a result, the farm sector’s debt-to-asset ratio has fallen since the mid-1980s and reached a historic low in 2012. Since then, the debt-to-asset ratio has trended upward and is now above its 10-year average, though, it remains low by historic standards. In 2018, the debt-to-asset ratio is forecast to remain below the 1970-2016 average.
While the farm sector as a whole has a debt-to-asset level in line with historic norms, the aggregate statistics mask substantial variation in leverage across commodity specializations. Data on operations specializing in cotton, corn, soybean, and poultry reveal that an increasing share of farms are forecast to be highly leveraged (a debt-to-asset ratio greater than 40 percent) between 2013 and 2018. Among these farm types, poultry operations have the greatest share of operations that are financial vulnerable—with almost a third forecast to be highly leveraged in 2017 and 2018. In contrast, less than an eighth of operations specializing in corn or soybeans will be highly leveraged. Of the farm types considered, cotton farmers saw the greatest percentage-point increase in leverage: between 2013 and 2018, the share that is highly leveraged is expected to increase from 11 to 22 percent.
Debt Repayment Capacity
While the debt-to-asset ratio remains low by historical standards, declining farm income and rising interest rates suggest some farmers may not be able to repay their outstanding debt in the years ahead. Beginning in December 2015, the Federal Reserve changed its policy course on interest rates and began to gradually increase the Federal funds rate. If interest rates increase, farmers will pay more for new loans and for variable rate credit. Higher interest costs and lower commodity prices could make it difficult for some borrowers to service their debt, which could result in higher loan delinquency and default rates.
The ratio of interest expenses to earnings before interest, taxes, and capital consumption (interest-to-EBITC) is a measure of a farm business’s ability to pay its interest expenses on its outstanding debt out of its earnings. High interest rates and low farm income caused the interest-to-EBITC ratio to peak at 36 percent in 1983. This coincided with higher rates of farm bankruptcies and loan defaults. After 1983, the interest-to-EBITC ratio fell below the 1970-2016 average level of 16 percent and reached a low of 8 percent in 2013. Since then, falling income and rising interest rates have again caused the ratio to climb, though the 2018 forecast of 15 percent remains below the long-run average. A 15-percent EBITC means that 15 percent of net farm earnings are spent on interest payments.
A recent ERS study examined the ability of the farm sector to repay debt by analyzing projections of the interest-to-EBITC ratio under various interest rate and cash flow assumptions. Findings show that if the current cash flow was assumed to remain constant but interest rates were assumed to gradually increase at a consensus forecast rate, the predicted interest-to-EBITC ratio would increase to about 18 percent by 2019. This indicates an increase in financial stress but at levels well below those during the farm crisis of the 1980s.
The results of the analysis suggest the expected interest rate increases will not result in large increases in financial stress if cash flows remain near current levels. However, a decline in farm income could lead to greater financial stress. Future reductions in commodity prices or increases in farm input expenses would lower farm profitability and exacerbate debt repayment challenges. The analysis estimated that if cash flows declined by 30 percent relative to those in 2016, the interest-to-EBITC could reach 25-26 percent by 2019, depending on the degree to which interest rates increase.
Conclusion
Since 2013, commodity prices have fallen from record highs. With the drop in farm income, land prices have stopped climbing and have even fallen in some regions of the country. In addition, interest rates have recently begun to increase, raising borrowing costs for new and variable rate loans. These trends indicate that U.S. agriculture is entering a less prosperous and potentially vulnerable period. However, current indicators of farm financial health do not suggest that the downturn is as severe as the farm crisis of the 1980s. Net cash farm income for the farm sector has fallen by one-third since 2013, but it is currently not far below the average post-2000 levels. While the share of farm businesses with negative net cash farm income varies substantially across commodity specialization categories, the share with negative net farm income in 2016 was similar to the average share in 2007-16. And even though inflation-adjusted farm debt increased 79 percent from 1994 to 2016, interest expenses have remained relatively stable due to declining interest rates. In contrast to the 1980s, recent decades have seen farm assets appreciate more rapidly than debt, so the farm sector’s debt-to-asset ratio remains low by historic standards. If farm income remains near current levels and interest rates increase as currently forecast, projected interest expense-to-farm earnings ratios suggest that the farm sector is unlikely to face extensive debt repayment challenges by 2019. However, if farm income falls substantially, more farmers will find it difficult to meet their debt obligations.
On July 26, 2018, the Amber Waves article “Current Indicators of Farm Sector Financial Health” was reposted to correct data for farm sector net cash income in the first sentence of the fourth paragraph. The first chart was also corrected.
This article is drawn from:
- Farm Income and Wealth Statistics. (n.d.). U.S. Department of Agriculture, Economic Research Service.
- “How Sensitive Is the Farm Sector’s Ability to Repay Debt to Rising Interest Rates?” Ryan Kuhns and Kevin Patrick. (2018). Choices, Quarter 1.


