Pesticide Use Peaked in 1981, Then Trended Downward, Driven by Technological Innovations and Other Factors
- by Jorge Fernandez-Cornejo, Craig Osteen, Richard Nehring and Seth J. Wechsler
- 6/2/2014
Pesticides, including herbicides, insecticides, and fungicides, have contributed to substantial increases in crop farm productivity over the past five decades. Properly applied, pesticides contribute to higher yields and improved product quality by controlling weeds, insects, nematodes, and plant pathogens. In addition, herbicides reduce the amount of labor, machinery, and fuel used for mechanical weed control. However, pesticides may possess toxic properties, so their use often prompts concern about human health and environmental consequences.
Pesticide use changed considerably between 1960 and 2008 (the most recent year for which complete data are currently available). Rapid growth in pesticide use characterized the first 20 years of this period. The total quantity of pesticides applied to the 21 crops analyzed grew from 196 million pounds of pesticide active ingredients (a.i.) in 1960 to 632 million pounds in 1981, largely because the percentage of planted acres treated with herbicides for weed control increased rapidly. In addition, the total planted acreage of corn, wheat, and, in particular, soybeans increased from the early 1960s to the early 1980s, which further increased herbicide use.
Since 1980, most acres planted with major crops have been treated with herbicides, including over 90 percent of corn, cotton, and soybean acres, leaving limited potential for increased herbicide use. As a result, the application of improved active ingredients with new modes of action and lower per-acre application rates resulted in a slight downward trend in pesticide use since the 1981 peak, to 516 million pounds in 2008.
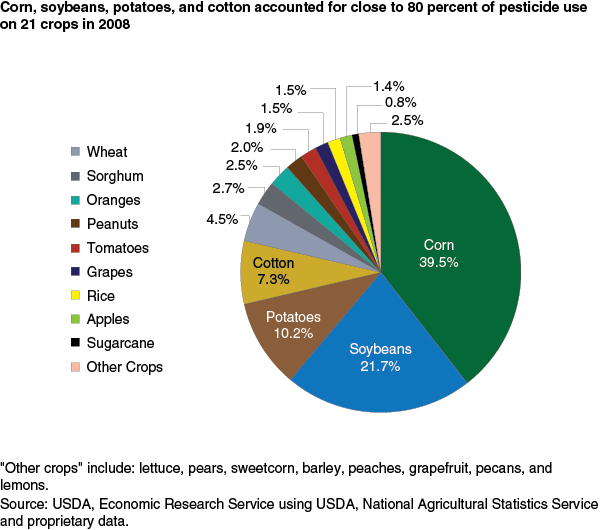
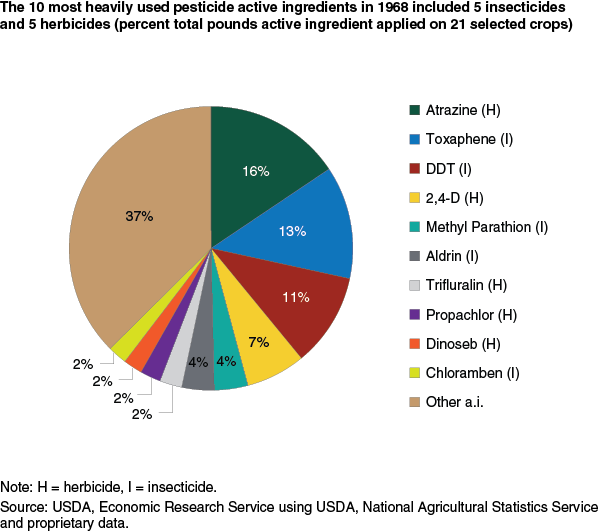
In 2008, corn, soybeans, cotton, wheat, and potatoes accounted for about 80 percent of the quantity of pesticide (measured in pounds of a.i.) applied to the 21 crops examined. Corn received the largest share, about 39 percent in 2008; however, this represents a drop from corn’s peak share of about 50 percent in the mid-1980s. Soybean production had the next largest share in 2008 at 22 percent, near its all-time high share of 25 percent in 1983. Potatoes’ share of pesticide use rose significantly in the 1990s and reached about 10 percent by 2008. Cotton accounted for just over 7 percent in 2008, down significantly from its 40 percent share in the early 1960s. The quantity of pesticide applied to cotton has trended downwards since 1972 due to the replacement of DDT and other older insecticides with more effective products (requiring the use of smaller quantities), the eradication of the boll weevil, and the adoption of insect resistant (Bt) cotton (that contain genes from the soil bacterium Bacillus thuringiensis that produce a protein toxic to specific insects). Wheat’s share was less than 5 percent in 2008, but it has varied between 2 and 5 percent from 1960 to 2008.
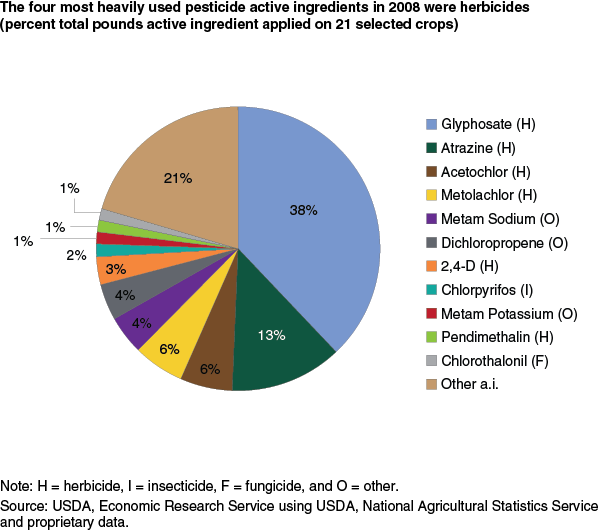
The pesticide types applied by U.S. farmers for the 21 crops analyzed also changed considerably between 1960 and 2008. Insecticides accounted for 58 percent of the quantity of pesticides applied in 1960, but only 6 percent in 2008. Herbicide applications increased from 18 percent in 1960 to 76 percent in 2008. Notably, the four most heavily used active ingredients in 2008 were glyphosate, atrazine, acetochlor, and metolachlor, all herbicides. Fungicides’ share of pesticide use has remained at 7 percent or less since 1971, down from 11-13 percent in the early 1960s. The most prominent fungicides used in 2008 were chlorothalonil, copper compounds, and mancozeb. Other pesticides—including soil fumigants, desiccants, harvest aids, and plant growth regulators—accounted for 13 percent in 2008. The most used, in terms of pounds applied, were metam sodium, dichloropropene, and metam potassium, which are soil fumigants used for such soil pests as weeds, plant pathogens, and nematodes.
Changes in pesticide use have been driven by changes in pest pressures, environmental and weather conditions, crop acreages, agricultural practices, and the cost-effectiveness of pesticides and other practices in protecting crop yields and quality. Pesticide use was also influenced by environmental, health, and pesticide regulations and access to land-grant extension personnel and crop consultants. Technological innovations in pest management, including genetically engineered crops, have also had a major influence on pesticide use trends.
Since 1996, the adoption of herbicide tolerant corn, cotton, and soybeans has increased the use of glyphosate in place of other herbicides. This increase in glyphosate use, along with an increase in corn acreage, has increased total pesticide use since 2002. On the other hand, the adoption of insect-resistant (Bt) corn and cotton has reduced the acreage treated with conventional insecticides and quantities applied to those crops. However, emerging pest management concerns include the development of glyphosate-resistant weed populations, which could increase use of other herbicides and weed control costs, and the development of Bt resistance in western corn rootworm, cotton bollworm, and fall armyworm, which might reduce the future efficacy of Bt corn and cotton.
This article is drawn from:
- Nehring, R., Osteen, C., Wechsler, S.J., Martin, A., Vialou, A. & Fernandez-Cornejo, J. (2014). Pesticide Use in U.S. Agriculture: 21 Selected Crops, 1960-2008. U.S. Department of Agriculture, Economic Research Service. EIB-124.


