Shopping For, Preparing, and Eating Food: Where Does the Time Go?
- by Margaret Andrews and Karen Hamrick
- 12/1/2009
Eating requires both income to purchase food and time to prepare and consume it. Food spending tends to rise with a household’s income. However, the opposite is true for time devoted to preparing food. Individuals in lower income households, especially participants in USDA’s Supplemental Nutrition Assistance Program (SNAP, formerly known as the Food Stamp Program), spend more time preparing and serving food at home than higher income households.
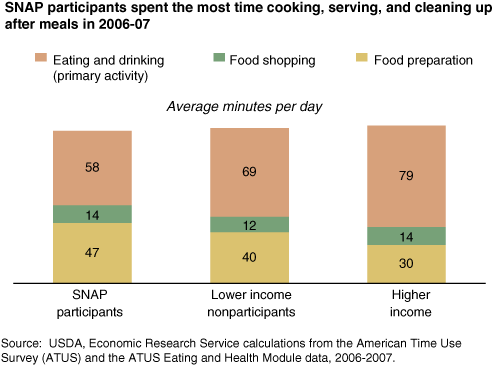
ERS researchers used data from the 2006 and 2007 American Time Use Surveys (ATUS) and the ATUS Eating and Health Module to compare the time patterns of individuals age 18 and older in households with incomes above and below 185 percent of the poverty line. Lower income households were divided into SNAP participants and nonparticipants. SNAP participants spent an average of 47 minutes per person per day cooking, serving, and cleaning up after meals—57 percent more time than higher income individuals and 18 percent more than lower income nonparticipants.
Earlier ERS analyses using only ATUS data found that, for women, food preparation time fell as they spent more time working outside the home. The same was true for SNAP households in 2006-07—employed female participants spent, on average, 36 percent less time preparing food than nonemployed SNAP participants. USDA program data show that only about 30 percent of SNAP households report earned income, suggesting that SNAP households, as a group, likely have more time to devote to cooking. And they have a greater need—SNAP participants cannot spend their benefits on restaurant or carryout meals. They also have less money than higher income households to spend on time-saving prepared foods.
SNAP participants, low-income nonparticipants, and higher income individuals averaged about the same amount of time per day—12 to 14 minutes per person—in the combined category of grocery shopping, other food shopping, and related travel. (Shopping times for the three groups are not statistically different.)
The time use data also revealed that SNAP participants and low-income nonparticipants spent less time eating and drinking than people in higher income households. SNAP participants averaged 58 minutes per person per day eating and drinking, compared with 69 minutes for lower income, nonparticipants and 79 minutes for the higher income group. (The eating and drinking category of the survey refers only to those occasions where food consumption was reported as the “primary” or main activity, and includes related travel and waiting times.)
This article is drawn from:
- Eating and Health Module (ATUS). (n.d.). U.S. Department of Agriculture, Economic Research Service.


