Nonmetro Poverty: Assessing the Effect of the 1990s
- by Dean Jolliffe
- 9/1/2003
The 1990s ushered in many changes in America that may have either aided or burdened the poor in nonmetropolitan (nonmetro) areas. The Personal Responsibility and Work Opportunity Reconciliation Act (PRWORA) of 1996 was designed to move poor people from welfare to work by imposing work requirements and a 5-year lifetime limit on Federal benefits. The law also limited who was eligible to receive assistance. These changes in welfare policy affected the poor both adversely (by reducing benefits) and positively (by providing stronger incentives toward achieving self-sufficiency). The overall effect of these two opposing forces on poverty is the subject of contentious debate.
Unprecedented economic growth and demographic shifts during the 1990s formed the backdrop for welfare policy changes. Between 1993 and 2000, the economy grew by 4 percent annually, versus 2.7 percent during the 20 years prior to 1993. As the U.S. economy boomed in the 1990s, so, too, did nonmetro population growth—over 10 percent during the 1990s, compared with 3 percent in the 1980s.
What effect did these major demographic and economic changes as well as government policy have on poverty? During the 1990s, the nonmetro poverty rate declined fairly steadily from a high of 17.1 percent in 1993 to a record low of 13.4 percent in 2000. However, with the end of the economic expansion, the nonmetro poverty rate crept back up to 14.2 percent in 2001. Poverty in metro areas followed a similar pattern, declining from a high of 14.6 percent in 1993 to a low of 10.8 percent in 2000, and edging up to 11.1 percent in 2001.
Degree of Urbanization Aligned With Degree of Poverty
Metro counties are commonly characterized as densely populated central cities and suburbs, and nonmetro counties as sparsely populated small towns and open countryside. This distinction oversimplifies the many differences across metro and nonmetro areas. Some metro counties have relatively small populations and are adjacent to rural areas, and some nonmetro counties contain urban areas but still qualify as nonmetro (see “What’s Nonmetro?”).
A more comprehensive classification—separating metro areas into highly and less urbanized counties (using 1 million population as the cutoff) and nonmetro areas into somewhat urbanized (with urban population of 20,000 or more) and more rural counties (with smaller or no urban population)—reveals important differences in poverty. Throughout the 1990s, highly urbanized metro areas had the lowest incidence of poverty and the more rural nonmetro areas had the highest, indicating that poverty is higher on average in the least populated areas. The greatest reduction in poverty in the 1990s occurred in the least populated rural areas. Poverty declined from 17.9 percent in 1989 to 14.9 percent in 1999 in the more rural nonmetro areas while it increased slightly in the more urban non-metro areas over this period.
Nonmetro West Grows, As Do Its Poor
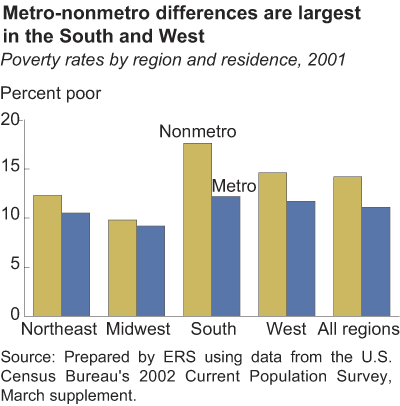
In 2001, 7.5 million nonmetro people were poor (14.2 percent of the nonmetro population), as were 25.4 million metro people (11.1 percent) (see “Who’s Poor?”). Nonmetro and metro poverty rates differ substantially across U.S. regions. In the Midwest, nonmetro and metro poverty rates differ by less than 1 percentage point. On the other hand, nonmetro poverty is more than 5 percentage points higher than metro poverty in the South, where more than 40 percent of the U.S. nonmetro population live. More than one in six persons in the nonmetro South are poor, while less than one in eight persons living in the metro South are poor.
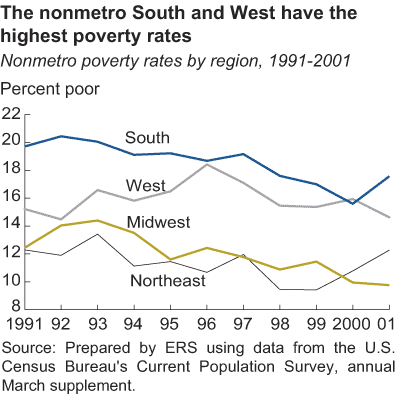
Over the last 10 years, the regional pattern of nonmetro poverty has changed significantly. At the beginning of the 1990s, nonmetro poverty in the West, Northeast, and Midwest was at or below 15 percent, while poverty in the South was around 20 percent. Throughout the rest of the decade, the nonmetro poverty rate declined on average in the South and Midwest, while the rate remained about the same in the West and Northeast. By the end of the 1990s, the gap between the South and the West in the level of nonmetro poverty had significantly narrowed, and their poverty rates were higher than the rates in the Northeast and Midwest. The relative deterioration of the economic well-being of the nonmetro West is noteworthy because its population grew significantly during most of the 1990s, fed largely by Hispanics. Between 1990 and 1997, the population of the nonmetro West increased 15.5 percent while the rest of the nonmetro U.S. increased 5.2 percent.
Dimensions of Poverty
Race and Ethnicity
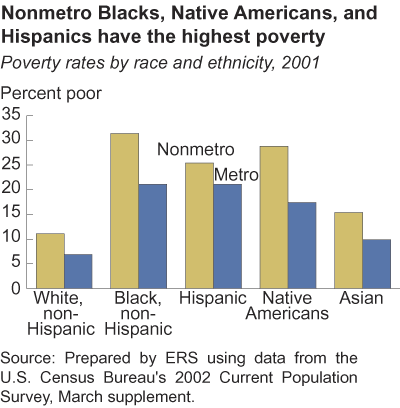
Poverty is more prevalent among some racial and ethnic groups than others. The nonmetro poverty rates in 2001 for non-Hispanic Blacks (31.4 percent) and Native Americans (28.8 percent) were more than twice the overall nonmetro poverty rate. The nonmetro–metro disparity is also greatest for these two groups, with nonmetro poverty more than 10 percentage points higher. The nonmetro poverty rate for Hispanics was lower (25.4 percent) than for Blacks or American Indians, but still more than twice the rate for non-Hispanic Whites (11.1 percent) in 2001. High Hispanic poverty is particularly compelling because Hispanics are the fastest growing minority group in the U.S., increasing 70 percent between 1990 and 2000 in nonmetro areas. Hispanic population growth results from both high birth rates and high migration rates into nonmetro areas during the 1990s.
According to the 2000 Census, racial and ethnic minorities comprise 17 percent of nonmetro residents and are growing more dispersed geographically. Because more than one out of every four nonmetro Hispanics, Blacks, and Native Americans live in poverty, understanding racial differences in poverty is becoming increasingly important in designing nonmetro programs and policies. Federal programs target assistance to these groups through outreach and community programs. For example, the Food Distribution Program on Indian Reservations provides food to low-income households living on Indian reservations as well as to Native American families living in designated areas near reservations. Additionally, the Food Stamp Program distributes informational brochures in Spanish and 19 other languages.
Family Structure
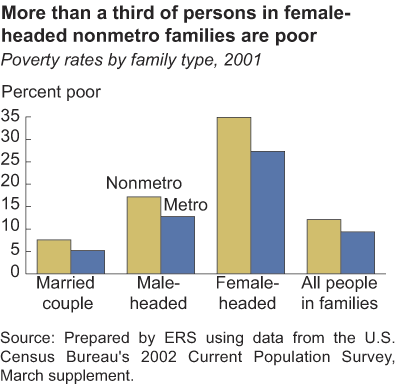
Family structure has a significant bearing on poverty. Over three-quarters of all nonmetro families are headed by a married couple, and about 15 percent are headed by a single female. Nonmetro families headed by a married couple have the lowest incidence of poverty (7.6 percent), while more than one out of every three nonmetro persons living in female-headed families is poor. In contrast, metro family structure is comprised of more female-headed families (18 percent) and a lower percentage of married-couple families (76 percent).
There are certainly many reasons for the differences in poverty rates by family structure, but one reason for the low poverty rates for married-couple families is the greater likelihood of having at least one wage earner. However, that factor alone does not fully explain the lower incidence of poverty in married-couple families. When only working families (at least one working adult present) are considered, female-headed families still have a poverty rate that is more than four times greater than the poverty rate for families headed by a married couple.
This stark difference in poverty rates across these two types of families may even understate differences in economic well-being. Consider two families, both with three people, where one family is headed by a married couple with one child, and the other is headed by a single mother with two children. Both have approximately the same poverty threshold. However, the married couple heading a poor family can share the responsibilities, anxieties, and scheduling burdens of raising their child under difficult financial conditions. The single mother, who needs to care for twice as many children, will likely bear the difficulties alone or with help from relatives and friends.
Now assume that no one is employed in either of the two families. Access to even a low-paying job might well lift the poor married-couple family out of poverty, as one adult could work while the other could tend to the child and housework. In contrast, if the single mother were to become employed, she would then need to manage her housework during nonworking hours and incur the costs of child care during her working hours. The costs of child care might well prevent this family from escaping poverty. Hence, programs to alleviate poverty must be mindful of these circumstances.
Ability To Work
Different age groups require different types of assistance and/or services. The elderly poor are more likely to need assistance with nutrition, health care, and medical expenses, including elder care and medications. Poor working-age adults are the most likely to benefit from job training programs, food stamps, and tax credits. Nonmetro poverty rates for adults and the elderly have been similar throughout the last decade, and in fact were the same in 2001 (12.2 percent).
Nonmetro child poverty rates, in contrast, stood at 20.2 percent in 2001 and eclipsed adult and elderly rates throughout the 1990s. Federal programs targeted to assist poor children include free school breakfasts and lunches and larger tax credits for households with children (the Earned Income Tax Credit). In addition, educational programs like Head Start are intended to help poor children attain a quality education and increase the likelihood of high school graduation and college attendance. Such programs may pay long-term dividends since children from poor families are less likely to graduate from high school, and low educational attainment increases the chance of their remaining poor as adults. In 2002, 41 percent of poor adults in nonmetro areas had not completed high school, and only 23 percent had any schooling after high school. In comparison, only 18 percent of nonmetro adults above the poverty line had not completed high school while 43 percent had some schooling after high school.
Depth of Poverty Often Hidden From View
Up to this point, all poor people have been grouped together without regard to their relative level of poverty. This ignores the fact that a poor family with income equal to half the poverty line has more extreme needs than a poor family just a few dollars short of the poverty line. The latter family is more likely to have sufficient assets and personal skills to right itself with a modest amount of assistance. On the other hand, a family living in severe poverty, with income less than half the poverty line, might require a more significant infusion of help to acquire work and socialization skills, child care, and care with daily activities like transportation in addition to financial assistance. In 2001, 37.7 percent of the nonmetro poor had incomes less than half the poverty line, versus 41.8 percent of the metro poor.
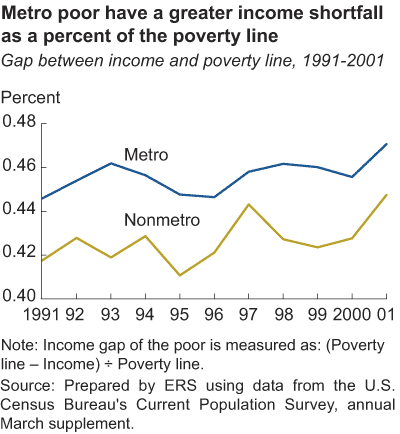
Another way to examine the relative well-being of the poor is to measure their average income shortfall (or the average difference between income and the poverty line). Since the poverty line is adjusted by family size, the income shortfall is expressed as a percentage of each family’s poverty line. In 2001, the nonmetro poor had an average income shortfall equal to 44.8 percent of the poverty line, while the average shortfall for the metro poor was greater at 47.1 percent. This gap persisted throughout the 1990s and widened at times, suggesting that the metro poor are worse off on average than the nonmetro poor.
Still, throughout the history of recording poverty rates, the incidence of nonmetro poverty has been consistently higher than metro poverty rates. As such, poverty reduction programs and policies would be well served to include components that focus on nonmetro areas. An additional focus suggested by data would be on people living in the South and West, racial/ethnic minorities, children, and female-headed families.
This article is drawn from:
- Rural Poverty & Well-Being. (n.d.). U.S. Department of Agriculture, Economic Research Service.
- Jolliffe, D. (2003). Comparisons of Metropolitan-Nonmetropolitan Poverty During the 1990's. U.S. Department of Agriculture, Economic Research Service. RDRR-96.


