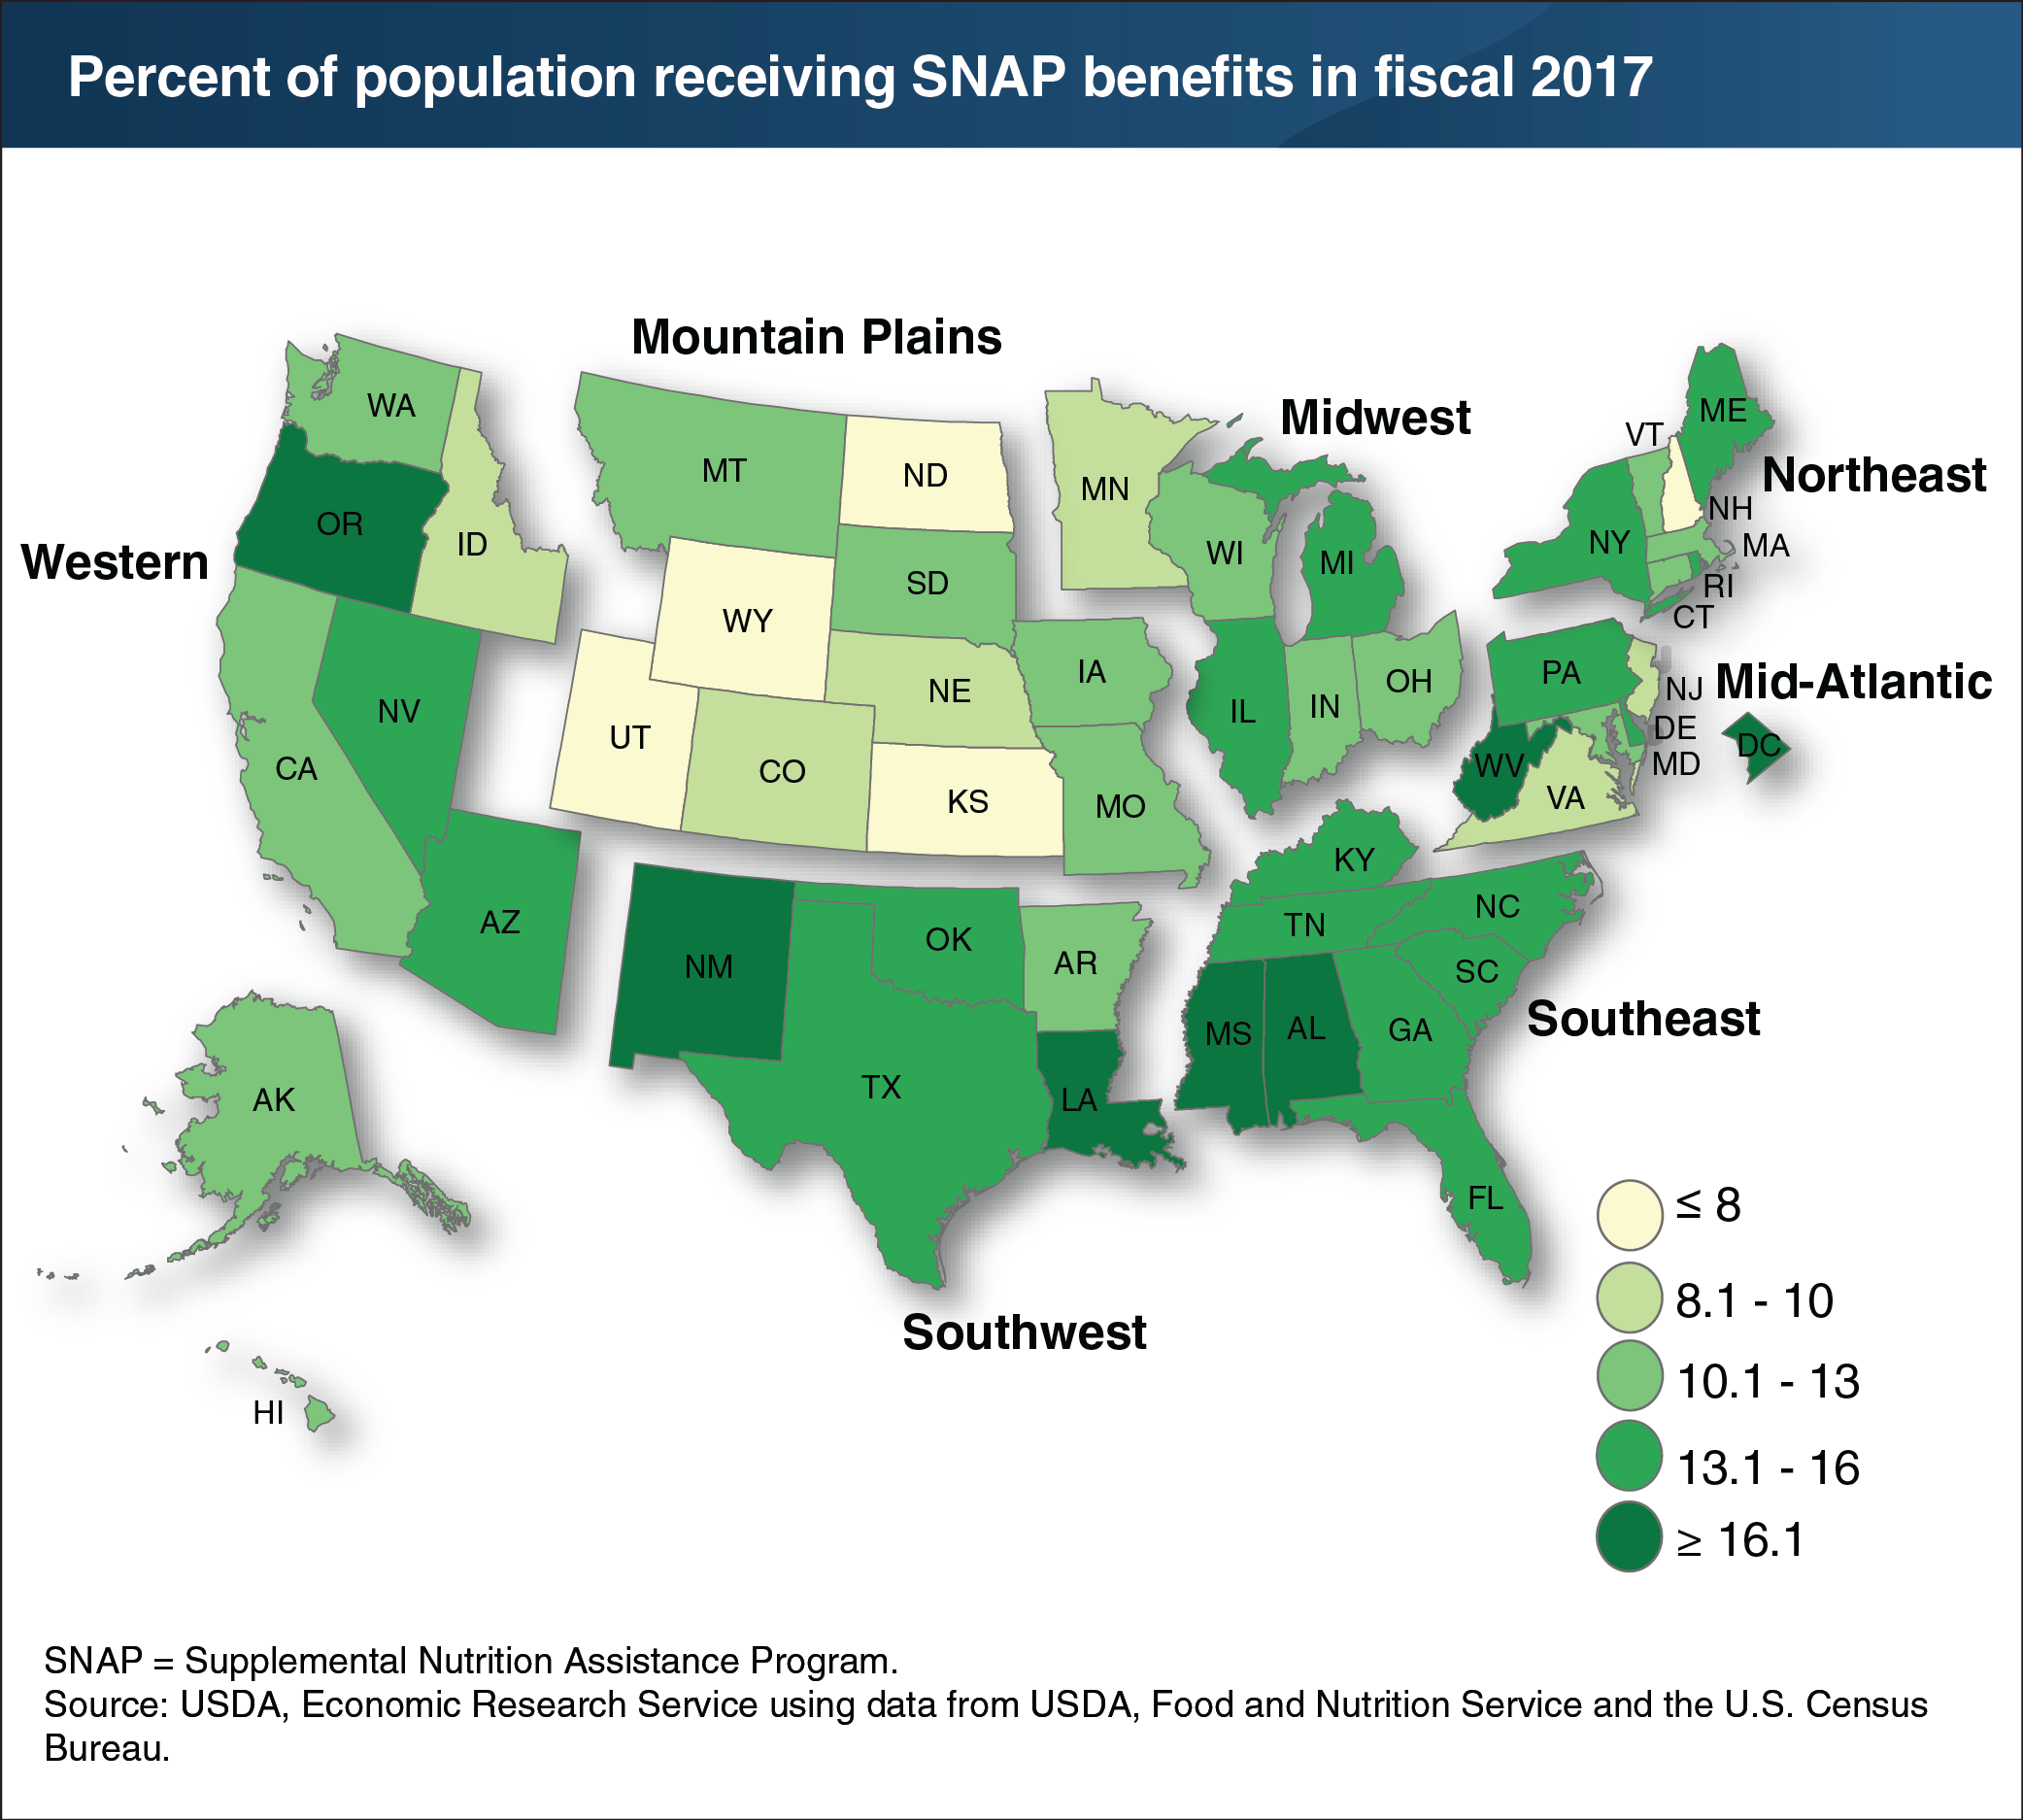
Percent of residents participating in SNAP varies across States
- by Alex Smith and Laura Tiehen
- 9/14/2018

The Supplemental Nutrition Assistance Program (SNAP)—USDA’s largest food assistance program—provided assistance to 42 million low-income individuals in the United States in 2017. These individuals accounted for 12.9 percent of the U.S. population, down from 13.7 percent in 2016. The share of Americans participating in SNAP has declined each year since 15.1 percent participated in 2013. In 2017, the State shares of residents receiving SNAP benefits ranged from 22.1 percent in New Mexico to 5.7 percent in Wyoming. Differences in the State shares reflect differences in economic conditions, need, and program policies. Among seven FNS-defined regions nationwide, in 2017, the Southeast region had the highest average share of residents receiving SNAP benefits at 15.1 percent, and the Mountain Plains region had the lowest average share of residents receiving SNAP at 9.6 percent. This chart appears in “Participation in SNAP Varies Across States But Is Generally Decreasing” in the September 2018 issue of ERS’s Amber Waves magazine.


