Decline in 2015 forecast for U.S. net cash farm income reflects lower receipts for livestock, crops
- by Ryan Kuhns and Kevin Patrick
- 12/22/2015

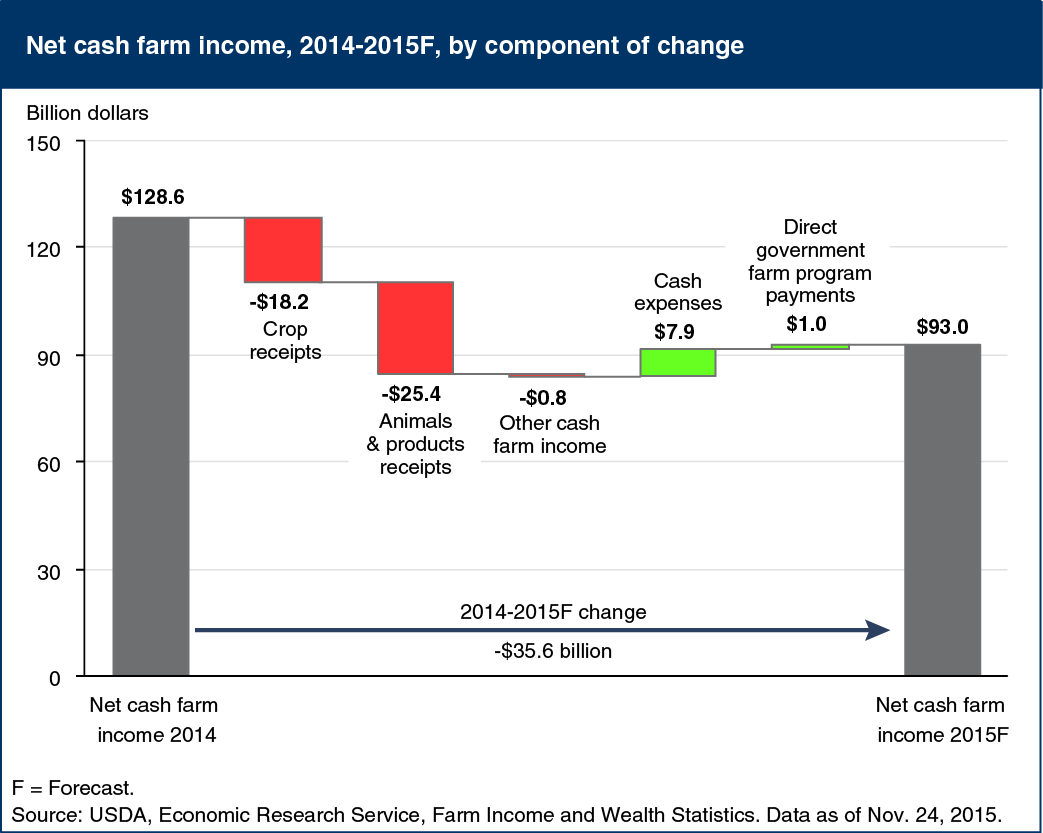
U.S. net cash farm income (NCFI)—the funds available to farm operators to meet family living expenses and pay down debt—is forecast to decline in 2015. This would be the second consecutive year of decline for NCFI, after reaching recent highs in 2012 and 2013. NCFI is expected to drop by $35.6 billion (28 percent) to $93 billion in 2015. If realized, the 2015 forecast would be the lowest since 2009, and $14.7 billion (in real terms) below the previous 10-year average. The drop in NCFI reflects a broad decline in commodity receipts. Crop receipts are expected to decrease by $18.2 billion from 2014, led by projected declines in receipts for corn ($8.6 billion) and soybeans ($5.7 billion). Livestock receipts are expected to decline by $25.4 billion, with the largest decreases in receipts expected for dairy ($13.9 billion), hogs ($6.6 billion), and broilers ($4.4 billion). Partially offsetting reduced cash receipts, total cash expenses are forecast to decrease by $7.9 billion in 2015, the first decline since 2009. Government payments are also projected to rise 10 percent ($1.0 billion) to $10.8 billion in 2015. This chart is based on information found in the 2015 Farm Sector Income Forecast, released November 24, 2015.


