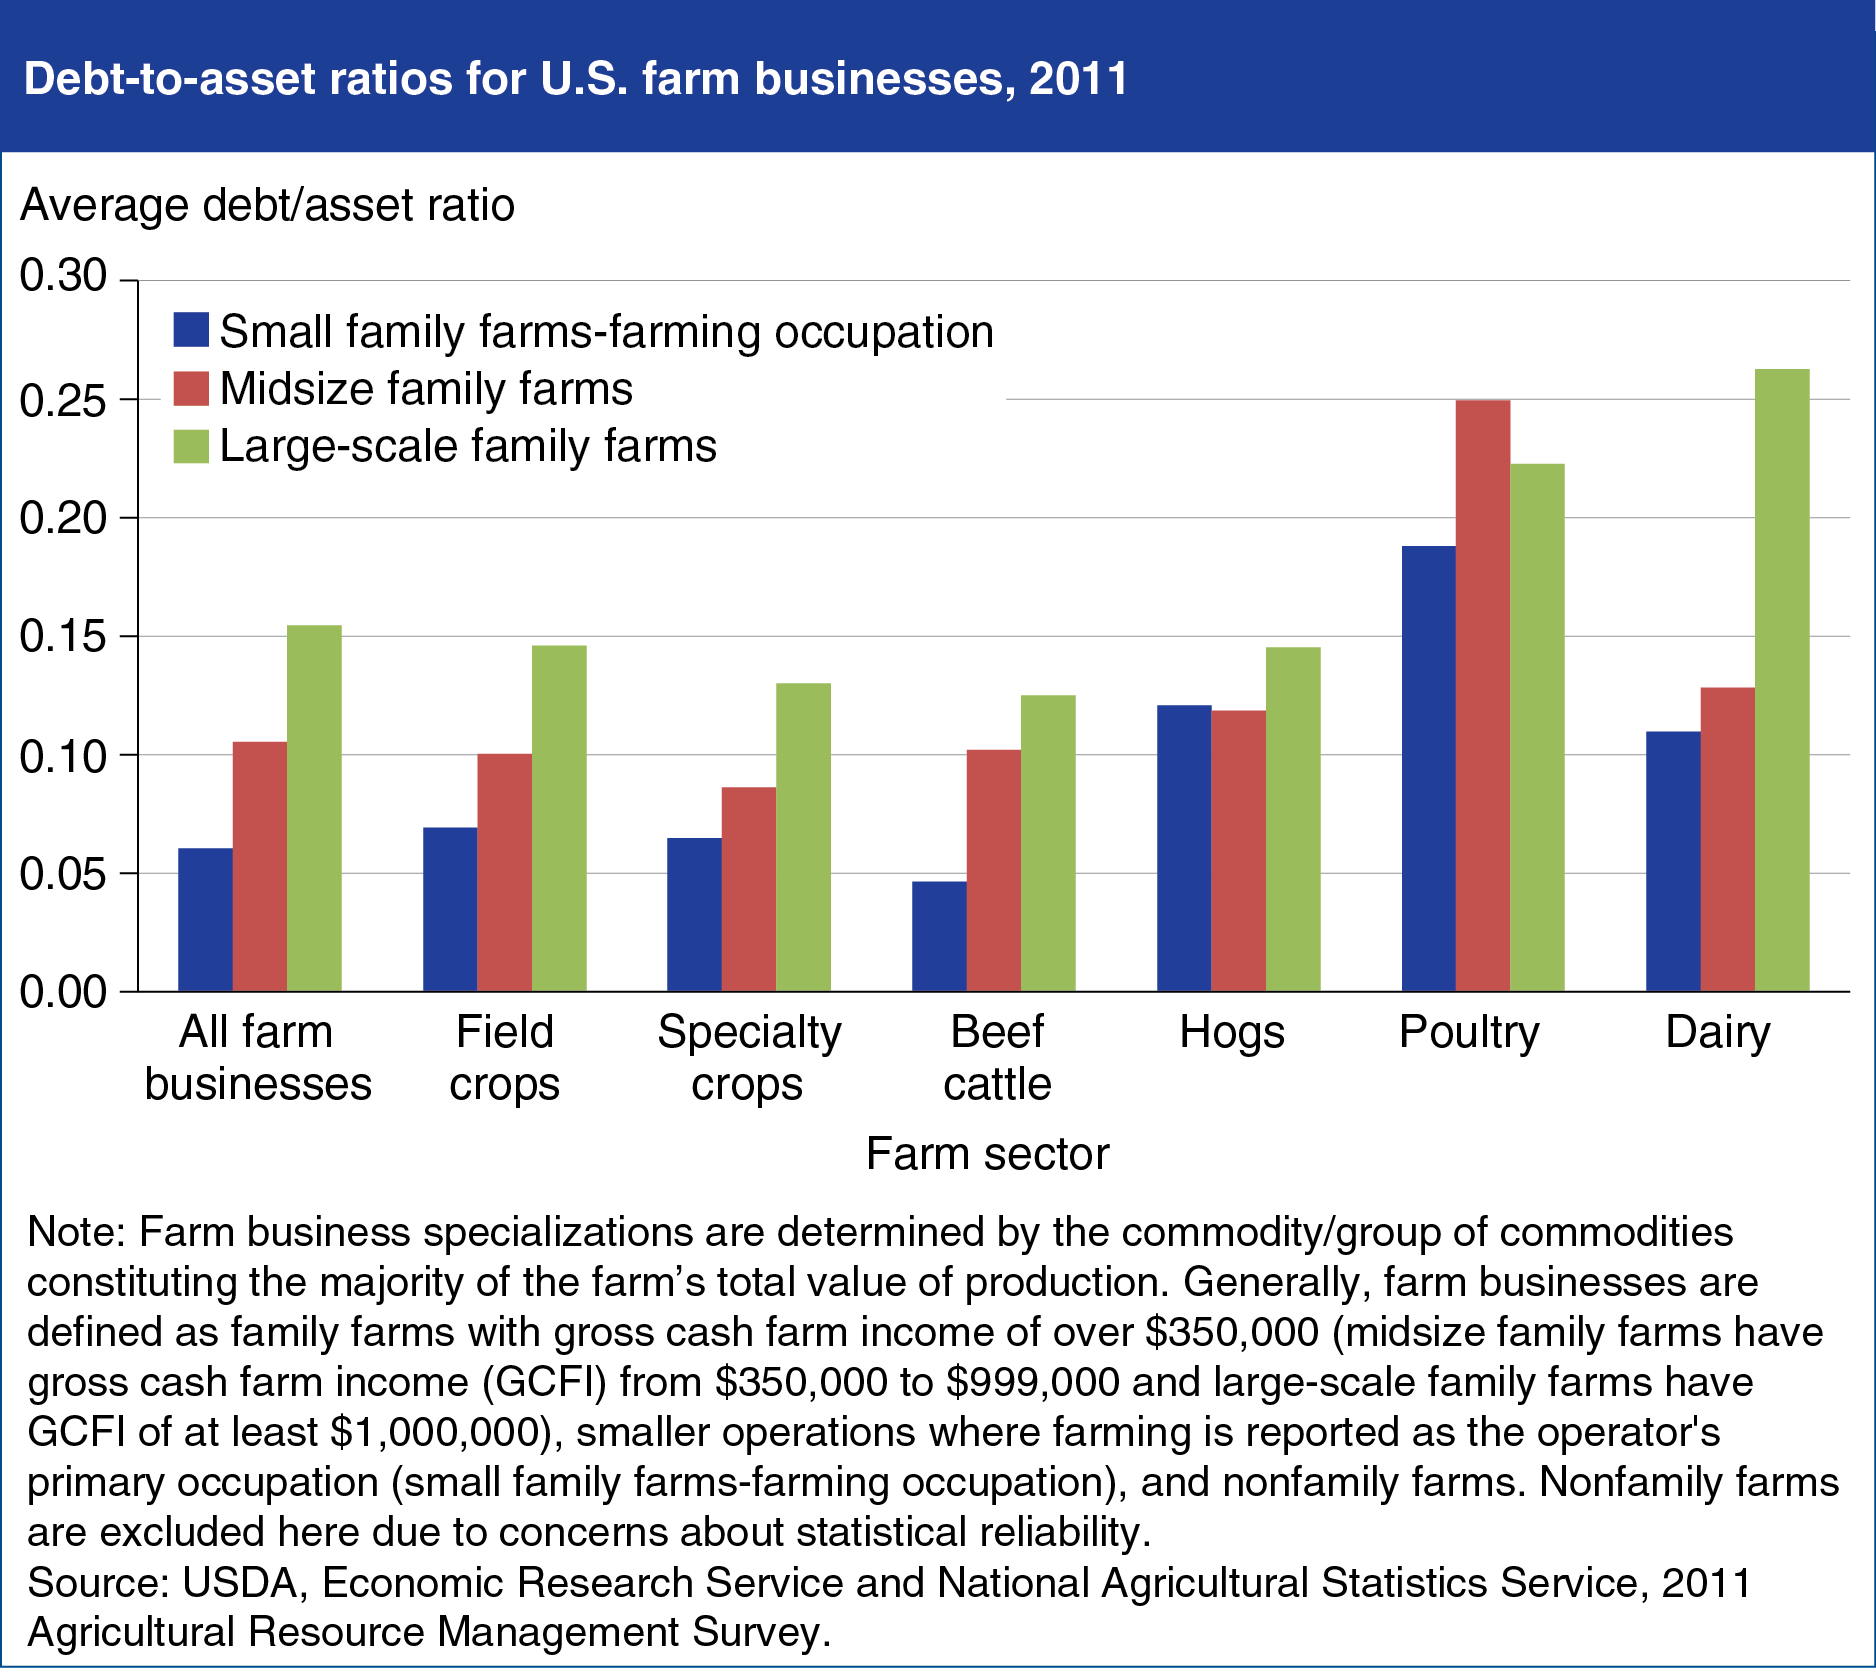
Poultry and dairy farm businesses typically have highest debt-to-asset ratios
- by Jennifer Ifft and Kevin Patrick
- 5/21/2014

Debt use varies with a farm’s commodity specialization, as financing requirements to manage a farm business differ by commodity. Debt-to-asset ratios are a key measure of a farm’s leverage, the degree to which farm assets are financed by debt. Although several measures are necessary to evaluate the financial health of a farm operation, the debt-to-asset ratio is a widely used measure of risk of loan default. Debt-to-asset ratios tend to increase as farm size increases, and they also vary by farm specialization. Large-scale family farms specializing in dairy, and all sizes of poultry farm businesses, are generally more leveraged than farms specializing in the production of other commodities. These specializations generally face higher capital costs, which contribute to increased debt use. Farm businesses specializing in field crops, specialty crops, and beef have the lowest debt-to-asset ratios. This chart is found in “Farm Businesses Well-Positioned Financially, Despite Rising Debt” in the April 2014 Amber Waves magazine.


