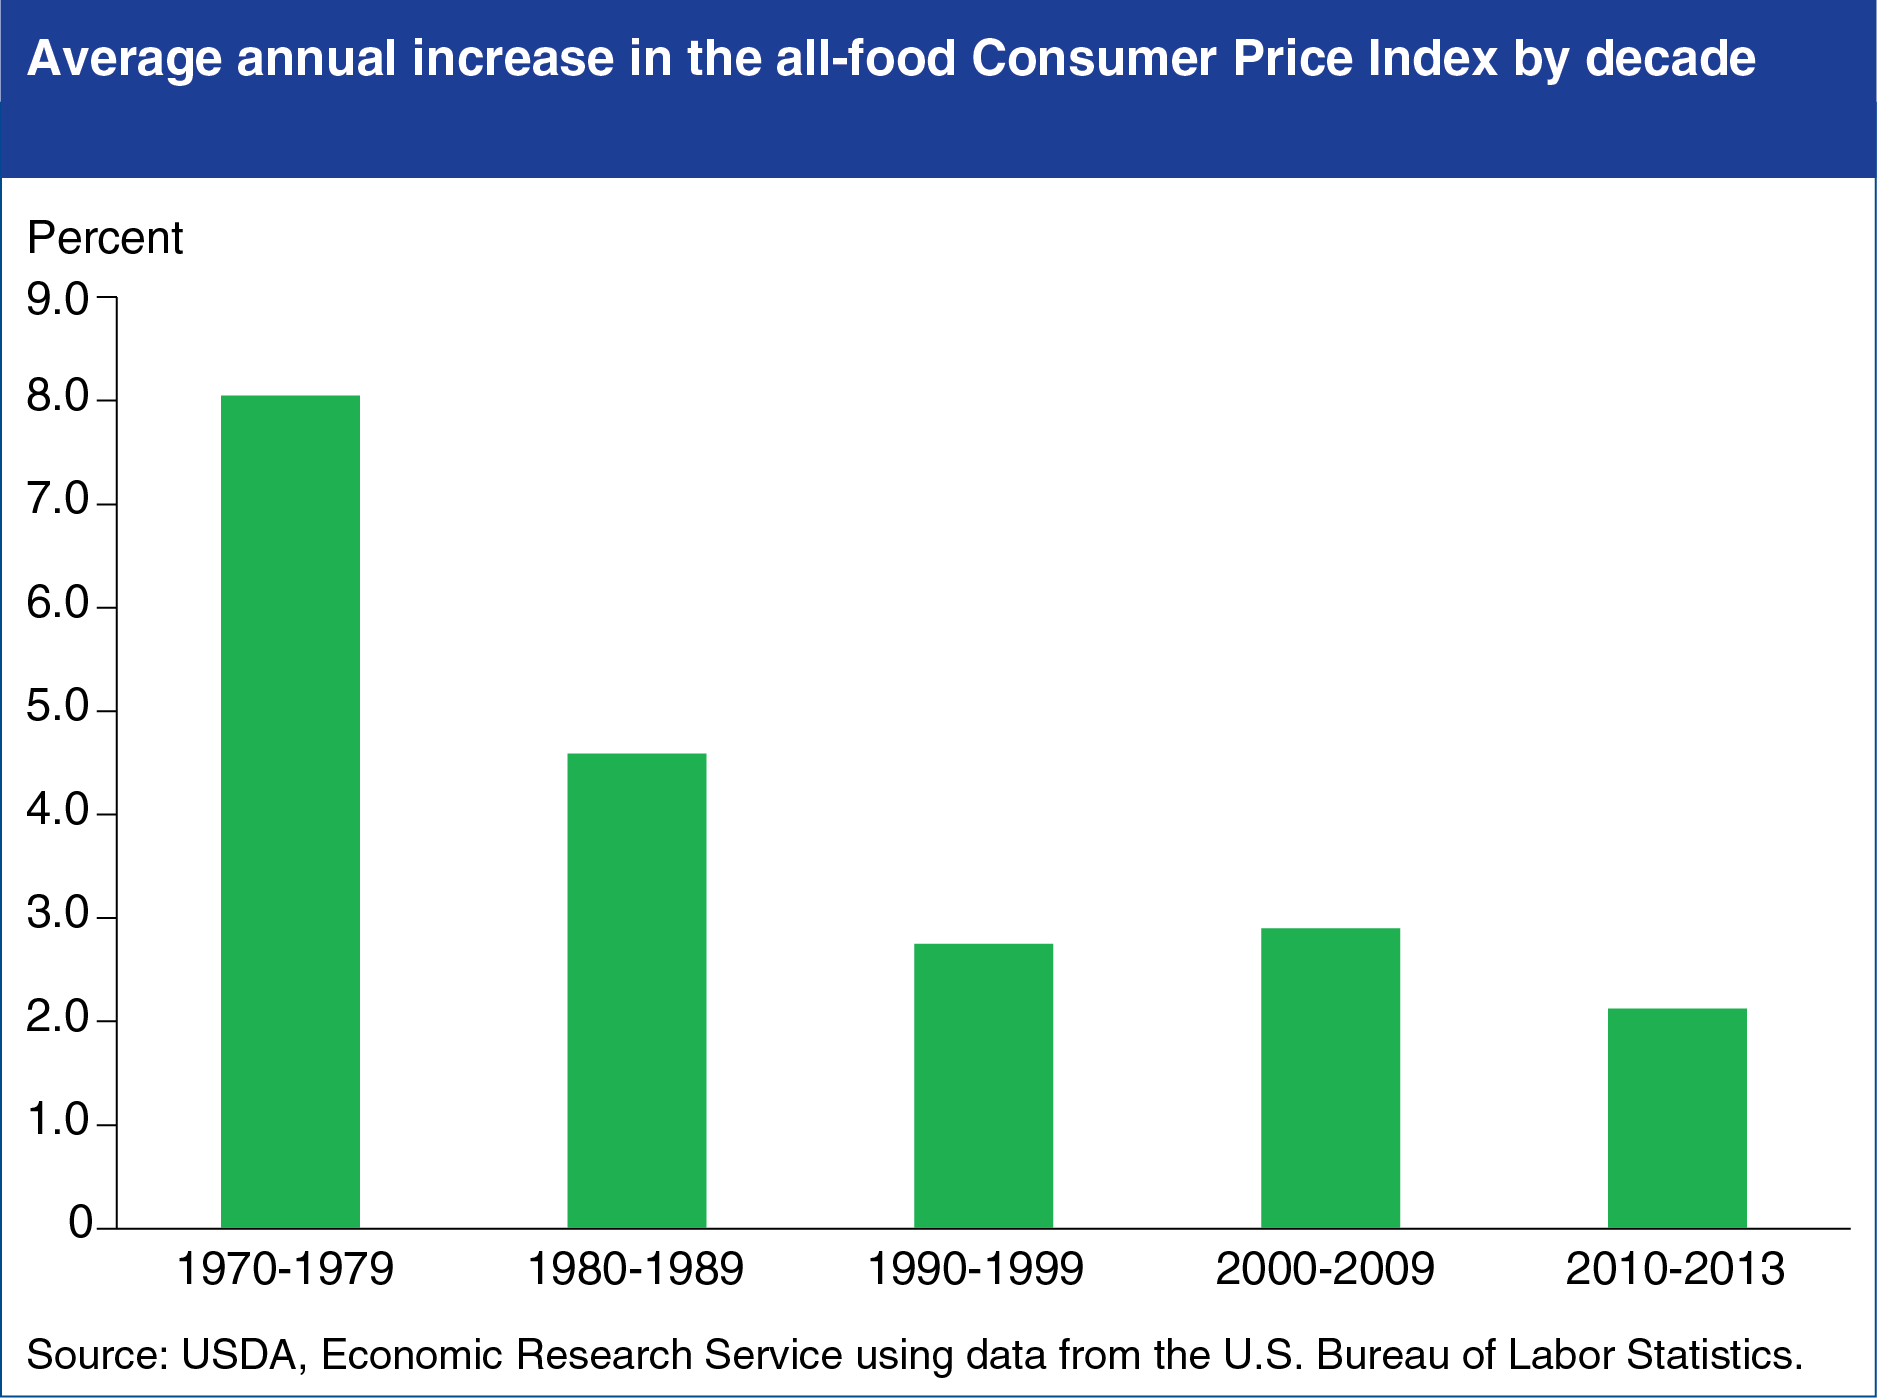
U.S. food price inflation has trended downward since the 1970s
- Contact: Website Administrator
- 5/7/2014

On average, food price inflation in the United States has been falling over the past several decades. Since 2010, food prices have risen by an average of 2.1 percent a year. By contrast, the 1970s saw the all-food Consumer Price Index (CPI) increase by an average of 8.1 percent annually, led by increases of 14.5 and 14.3 percent in 1973 and 1974, respectively. The 1970s were a time of high energy prices and high inflation for consumer goods, including food. In the 1980s, the all-food CPI increased by an average of 4.6 percent per year, and food prices rose 2 to 3 percent per year in the following two decades. Advancements in agricultural productivity contributed to falling inflation-adjusted prices for agricultural commodities during the 1980s and 1990s. In addition, enhanced agricultural trade has allowed the U.S. food supply to better respond to supply shocks. This chart appears in "Food Prices—Taking the Long-Term View" in ERS’s April 2014 Amber Waves magazine.

