

Editor's Pick 2013:<br>Nonmetro areas declined in population, 2011-12, perhaps for the first time
- by ERS
- 12/30/2013
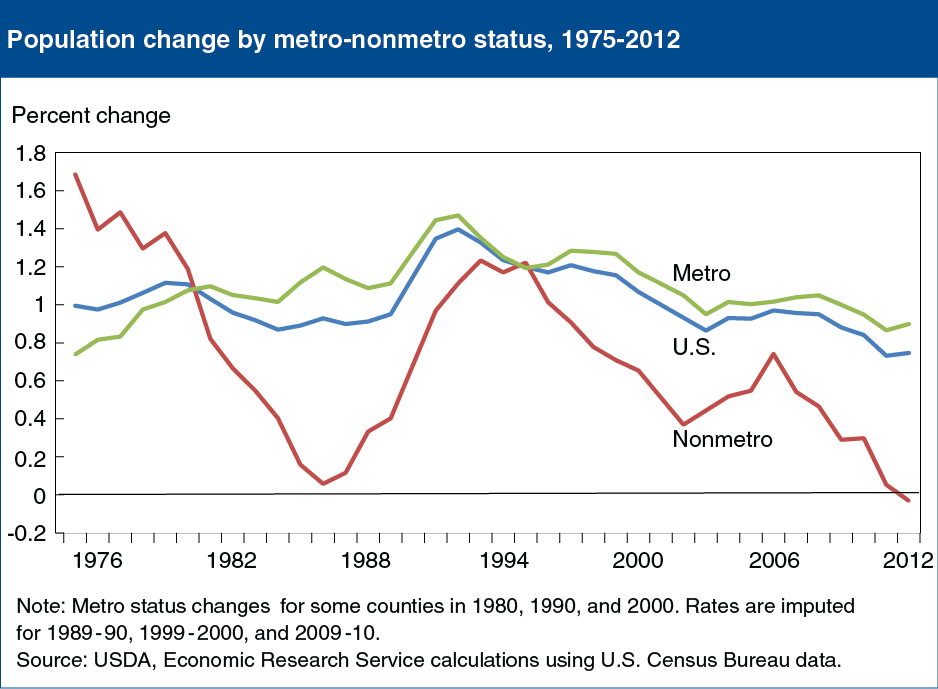
Nonmetro population has grown more slowly than metro population since the mid-1990s and the gap has widened considerably in recent years. Between July 2011 and July 2012, nonmetro population declined for the first time since annual county population estimates were first recorded in the 1960s. Historically, nonmetro population grew because natural increase (more births than deaths) always offset net migration loss (more people moving out than moving in). But falling birth rates and an aging population have steadily dampened the natural increase in nonmetro population over time. Nonmetro net migration rates, which tend to fluctuate in response to economic conditions, last peaked in 2006 just prior to the housing mortgage crisis before falling dramatically. New population estimates are subject to revision, the rate of population decline for this single year is quite small, and the trend may be short-lived. Nonetheless, 2011-12 marks the first year with estimated net migration losses exceeding natural increase in nonmetro areas. This chart is based on County-level Data Sets. Originally published on Tuesday, April 9, 2013.