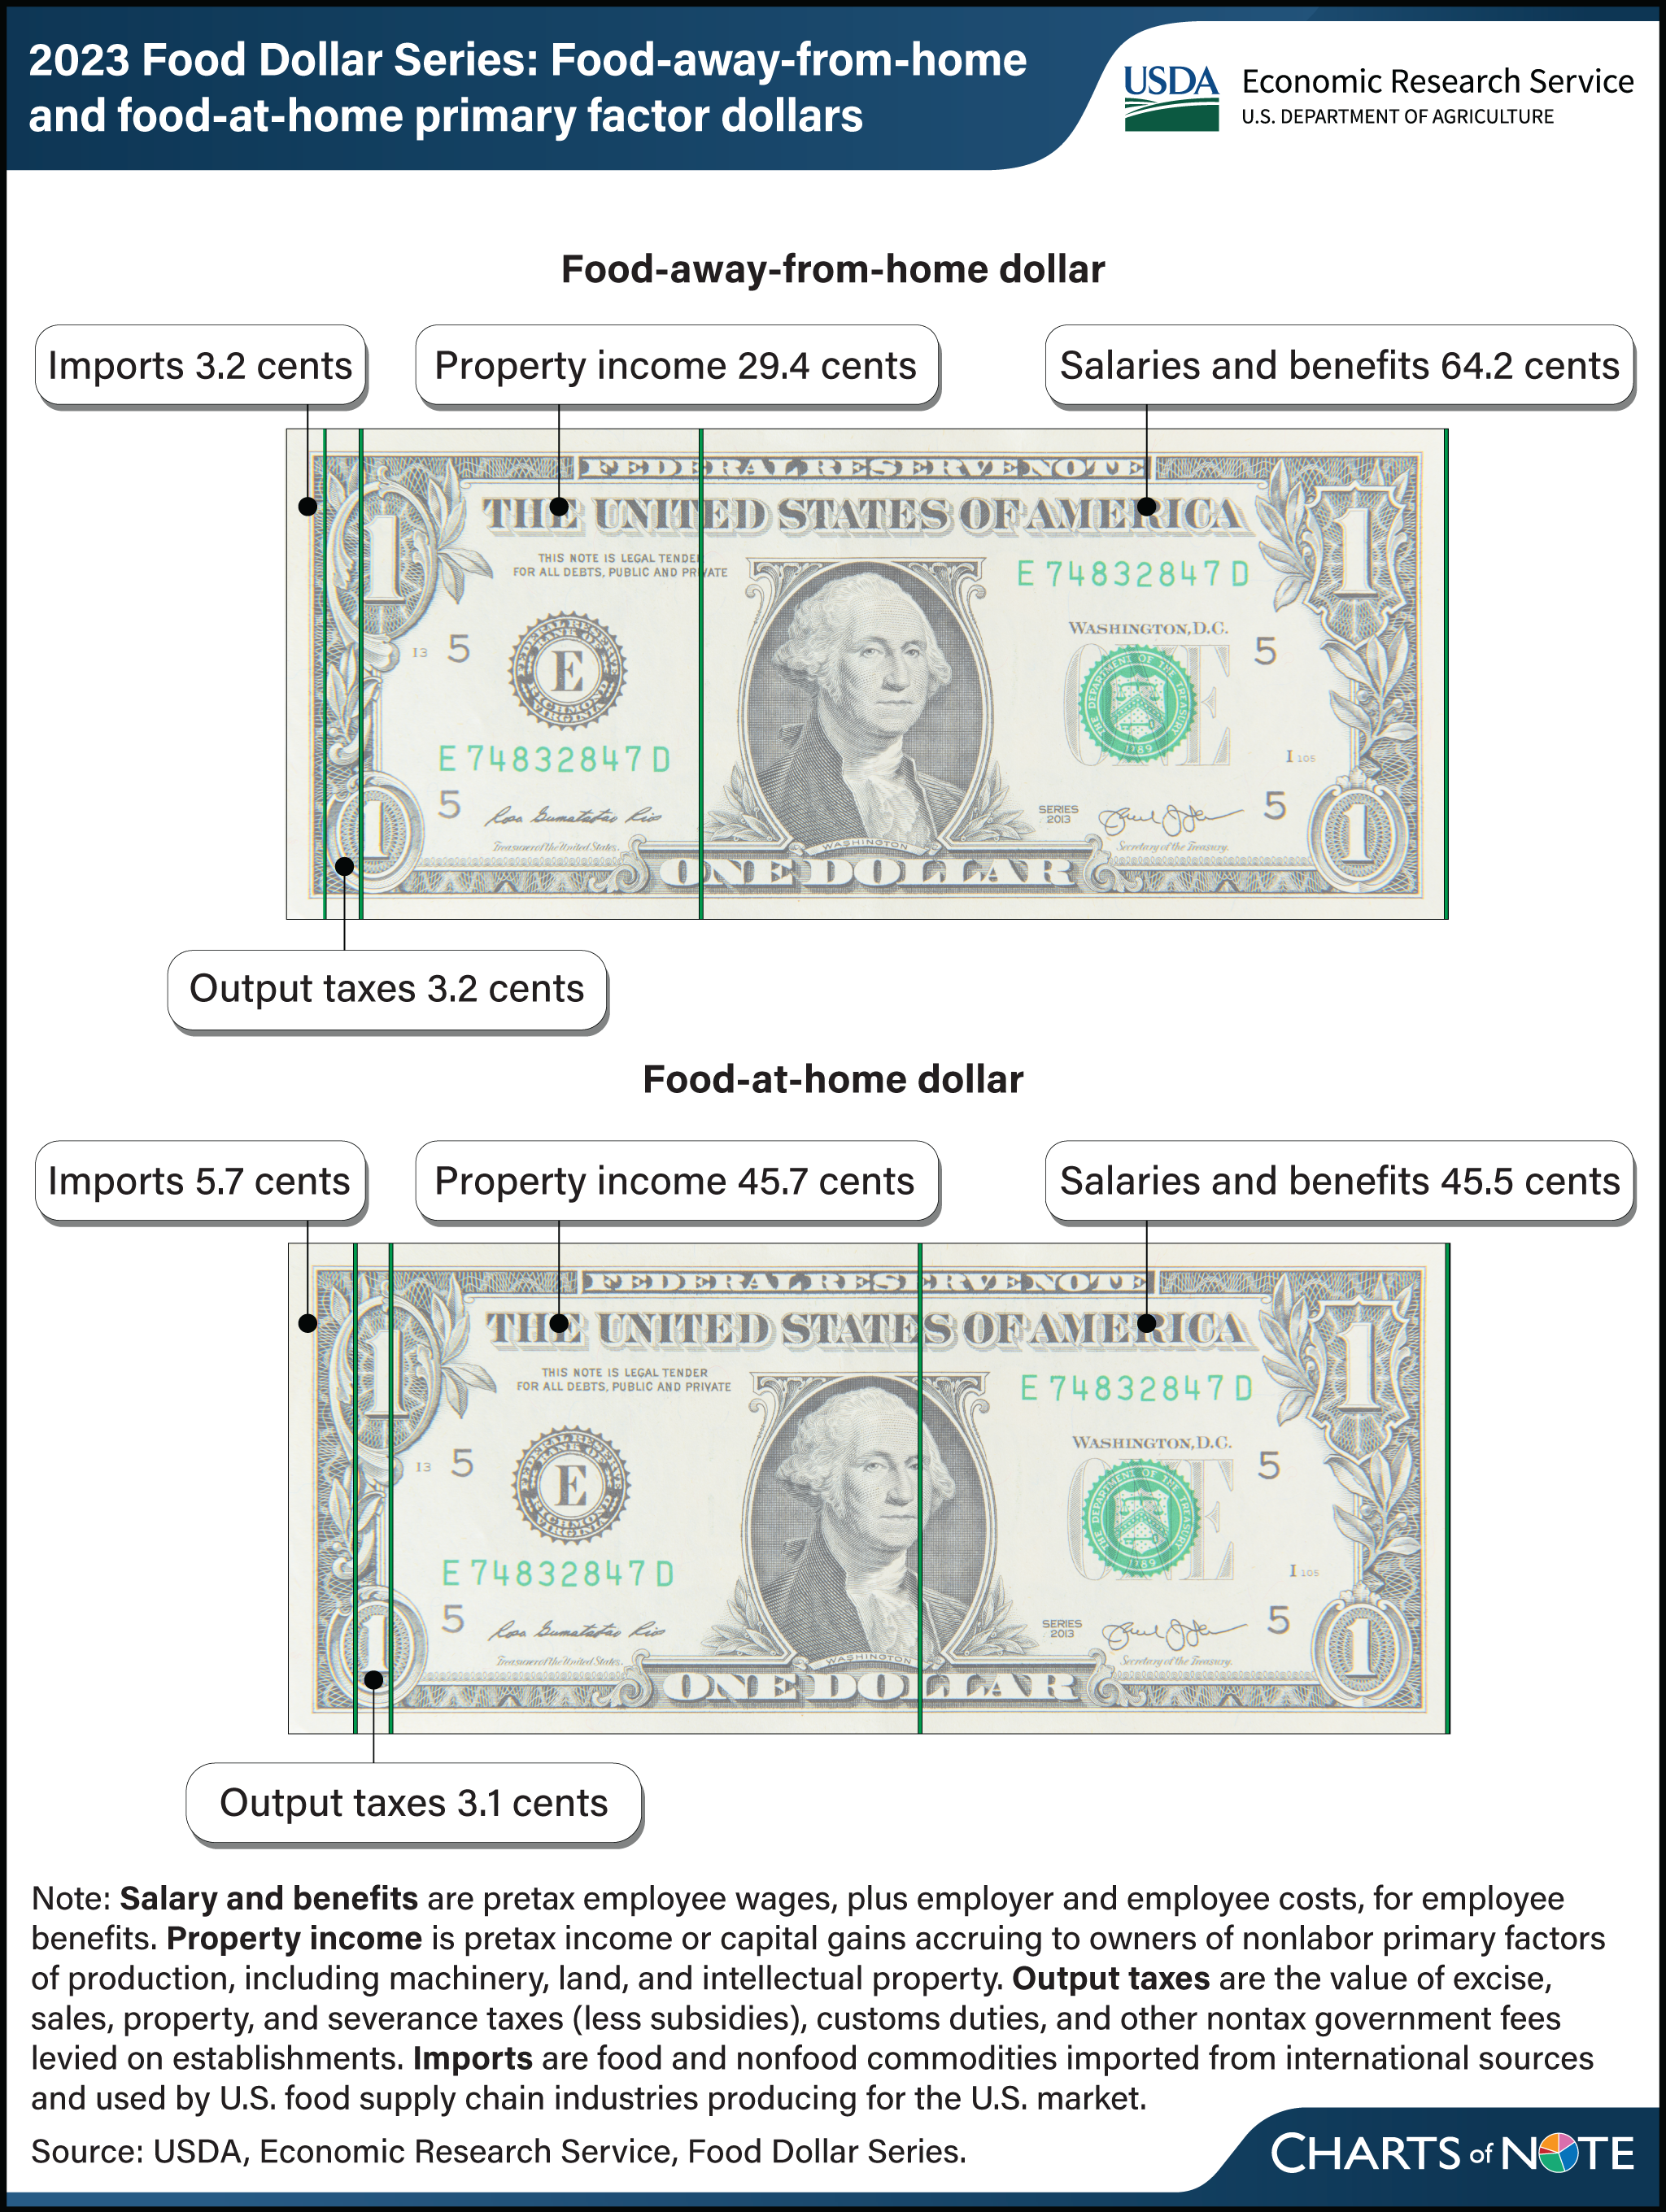
Food-away-from-home labor costs were almost 20 cents per dollar higher than food-at-home in 2023
- by Quinton Baker and James Chandler Zachary
- 4/2/2025

In 2023, labor costs accounted for about 64 cents of each dollar spent on food-away-from-home meals, which are meals prepared for immediate consumption at establishments such as restaurants. Those labor costs represent the salaries and benefits paid to workers who make, process, and distribute the food, other goods, and services linked to meals away from home, and the meals themselves. By contrast, labor costs were about 46 cents of each dollar spent on food at home, which is purchased at one establishment but consumed elsewhere, such as at home. The difference is due to the additional labor involved in preparing and serving meals at restaurants and other eating and drinking establishments. The foodservices industry group, which includes restaurants, makes up the majority of the cost structure of the food-away-from-home value chain. The data for this chart are available for 1993 to 2023 in the USDA, Economic Research Service (ERS) Food Dollar Series, updated November 18, 2024. Find additional information in the ERS Amber Waves article ERS Food Dollar's Three Series Show Distributions of U.S. Food Production Costs, published in December 2023.

