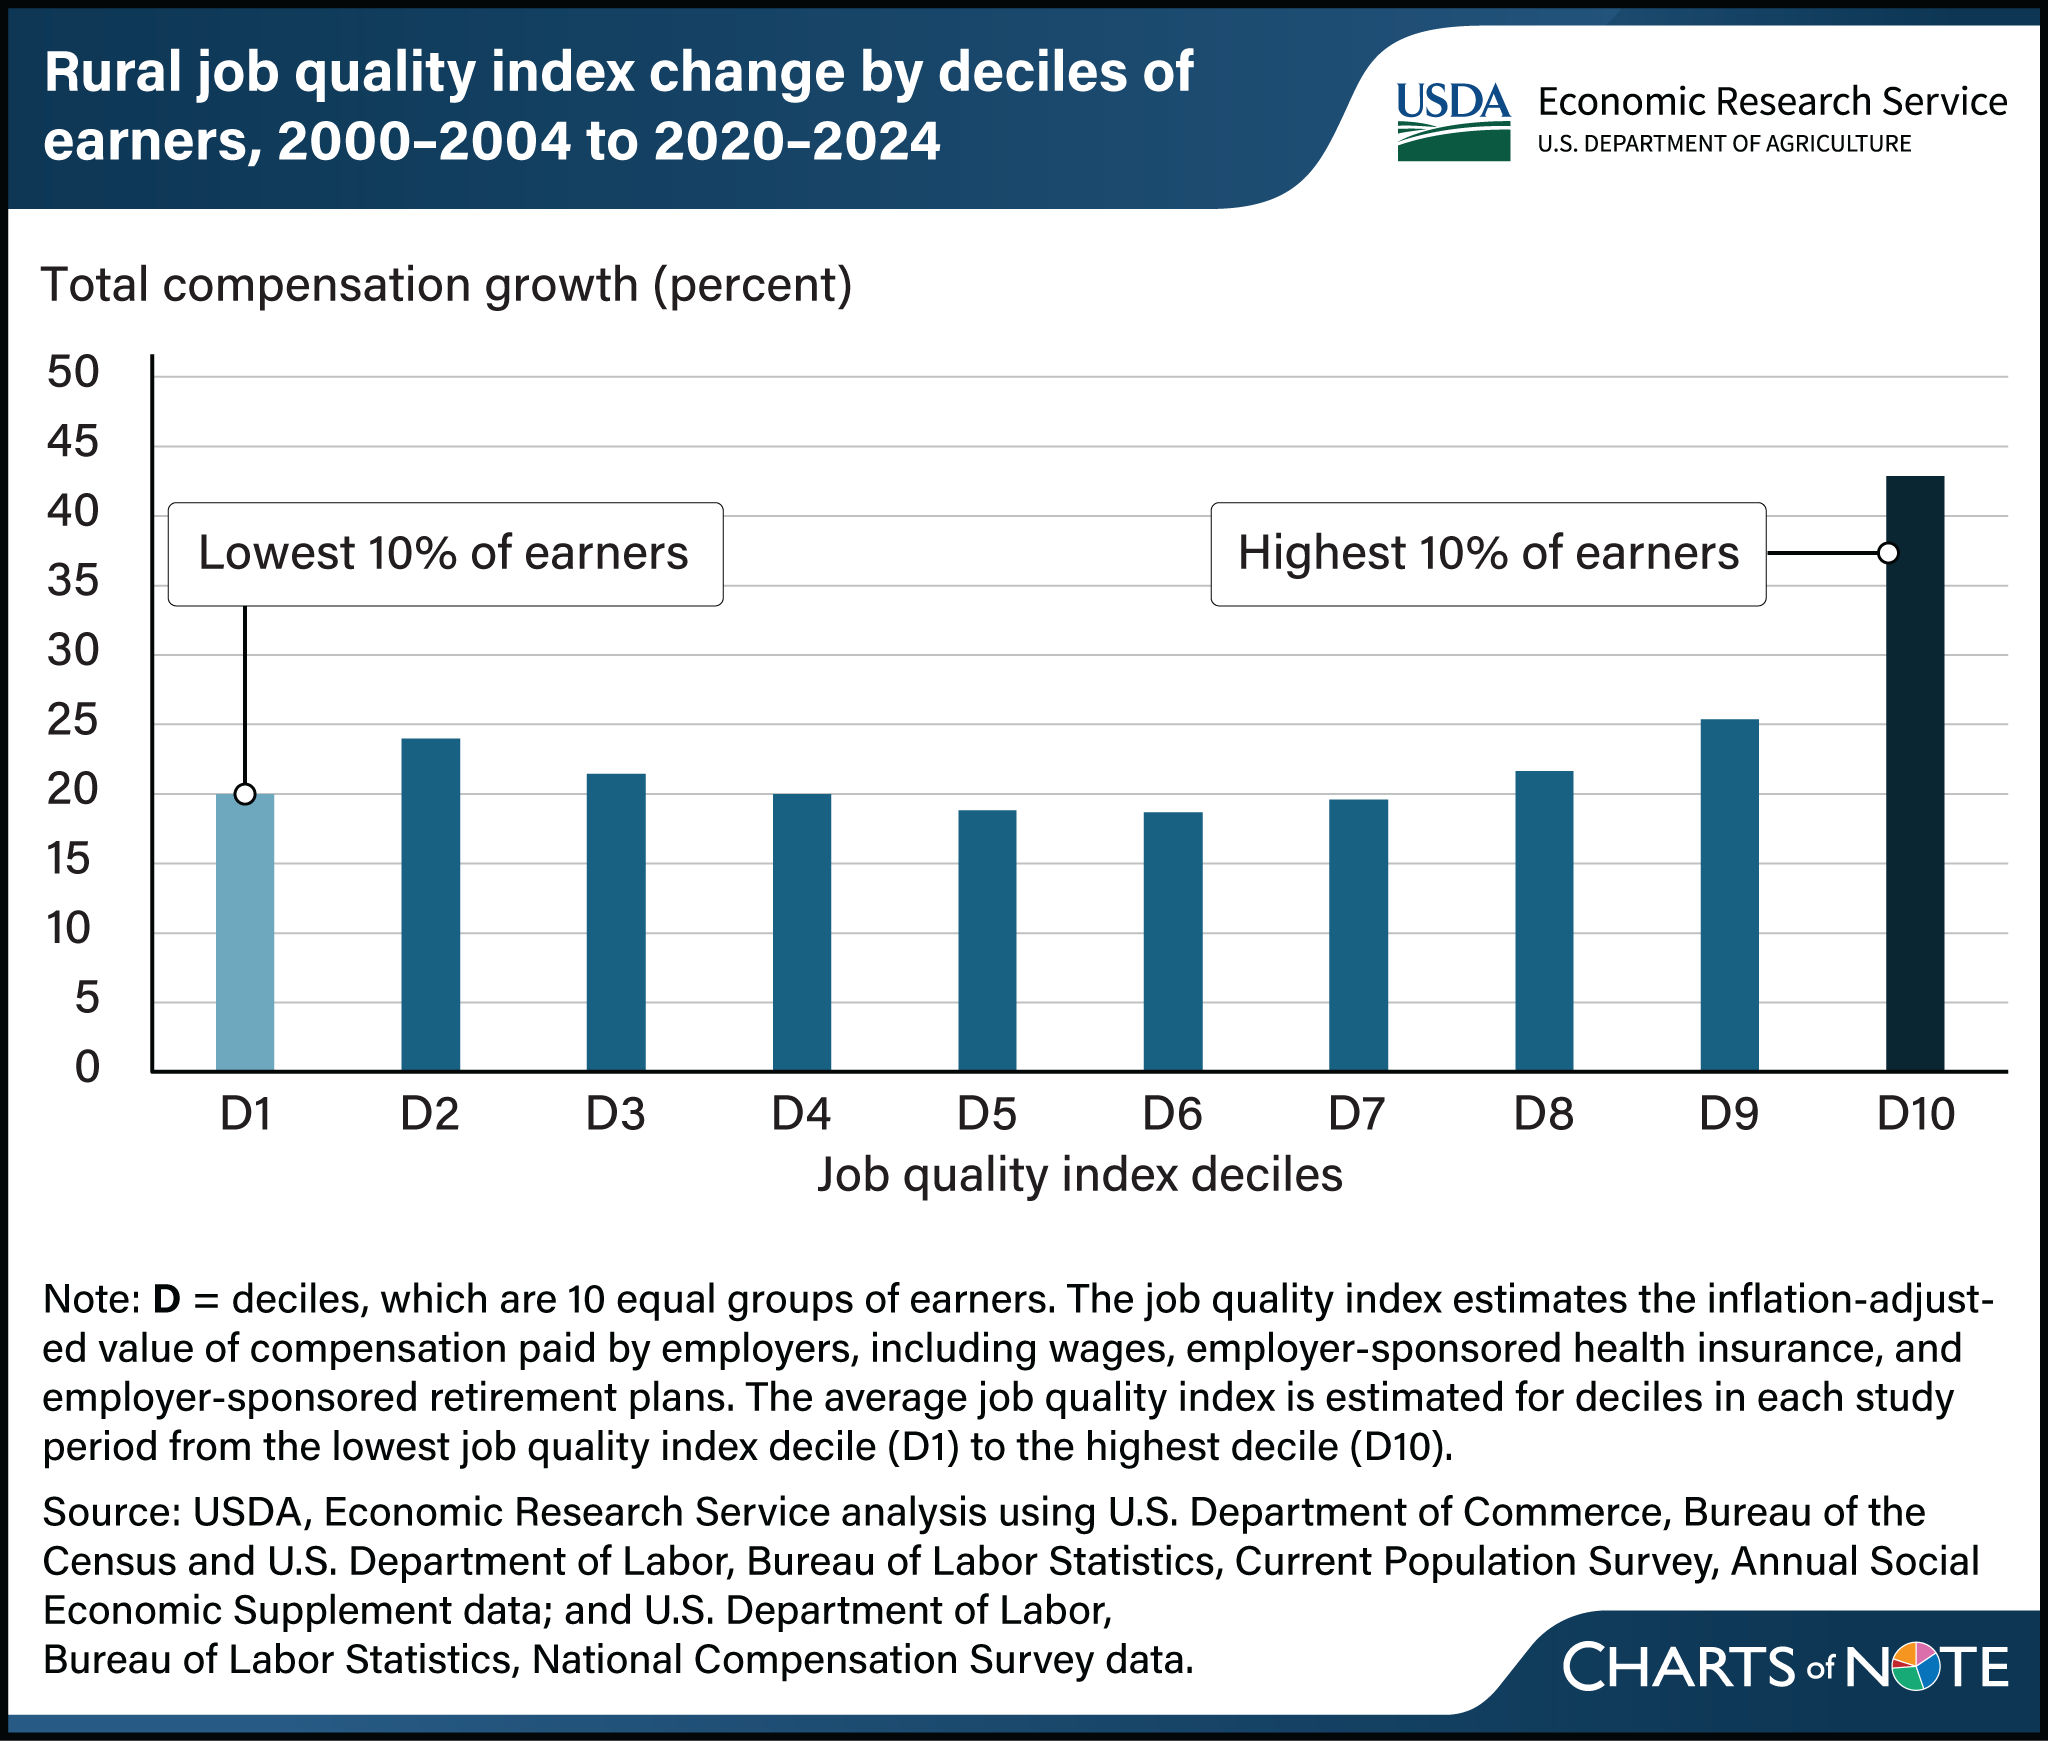
Compensation for top 10 percent of rural workers grew 43 percent between 2000–2004 and 2020–2024
- by Ephraim M. Nkonya and John Pender
- 4/1/2025

In order to better understand labor markets in rural areas and for ag-related industries, researchers with USDA, Economic Research Service (ERS) created a job quality index as an estimate of employers’ total costs for employees’ wages, health insurance coverage, and retirement benefits. They used this index to assess total compensation trends in rural areas in two time periods (2000–2004 and 2020–2024). The index shows that the real value (adjusted for inflation) of total compensation for rural workers in the top 10 percent of earners between the periods grew by nearly 43 percent, exceeding the growth of any other decile. The corresponding growth for workers in the bottom 10 percent of rural earners was 20 percent, in part because of an increase in the minimum wage in 13 States between 2022 and 2024. This chart updates one in the ERS report Trends and Patterns of Job Quality in the United States, published in January 2025.

