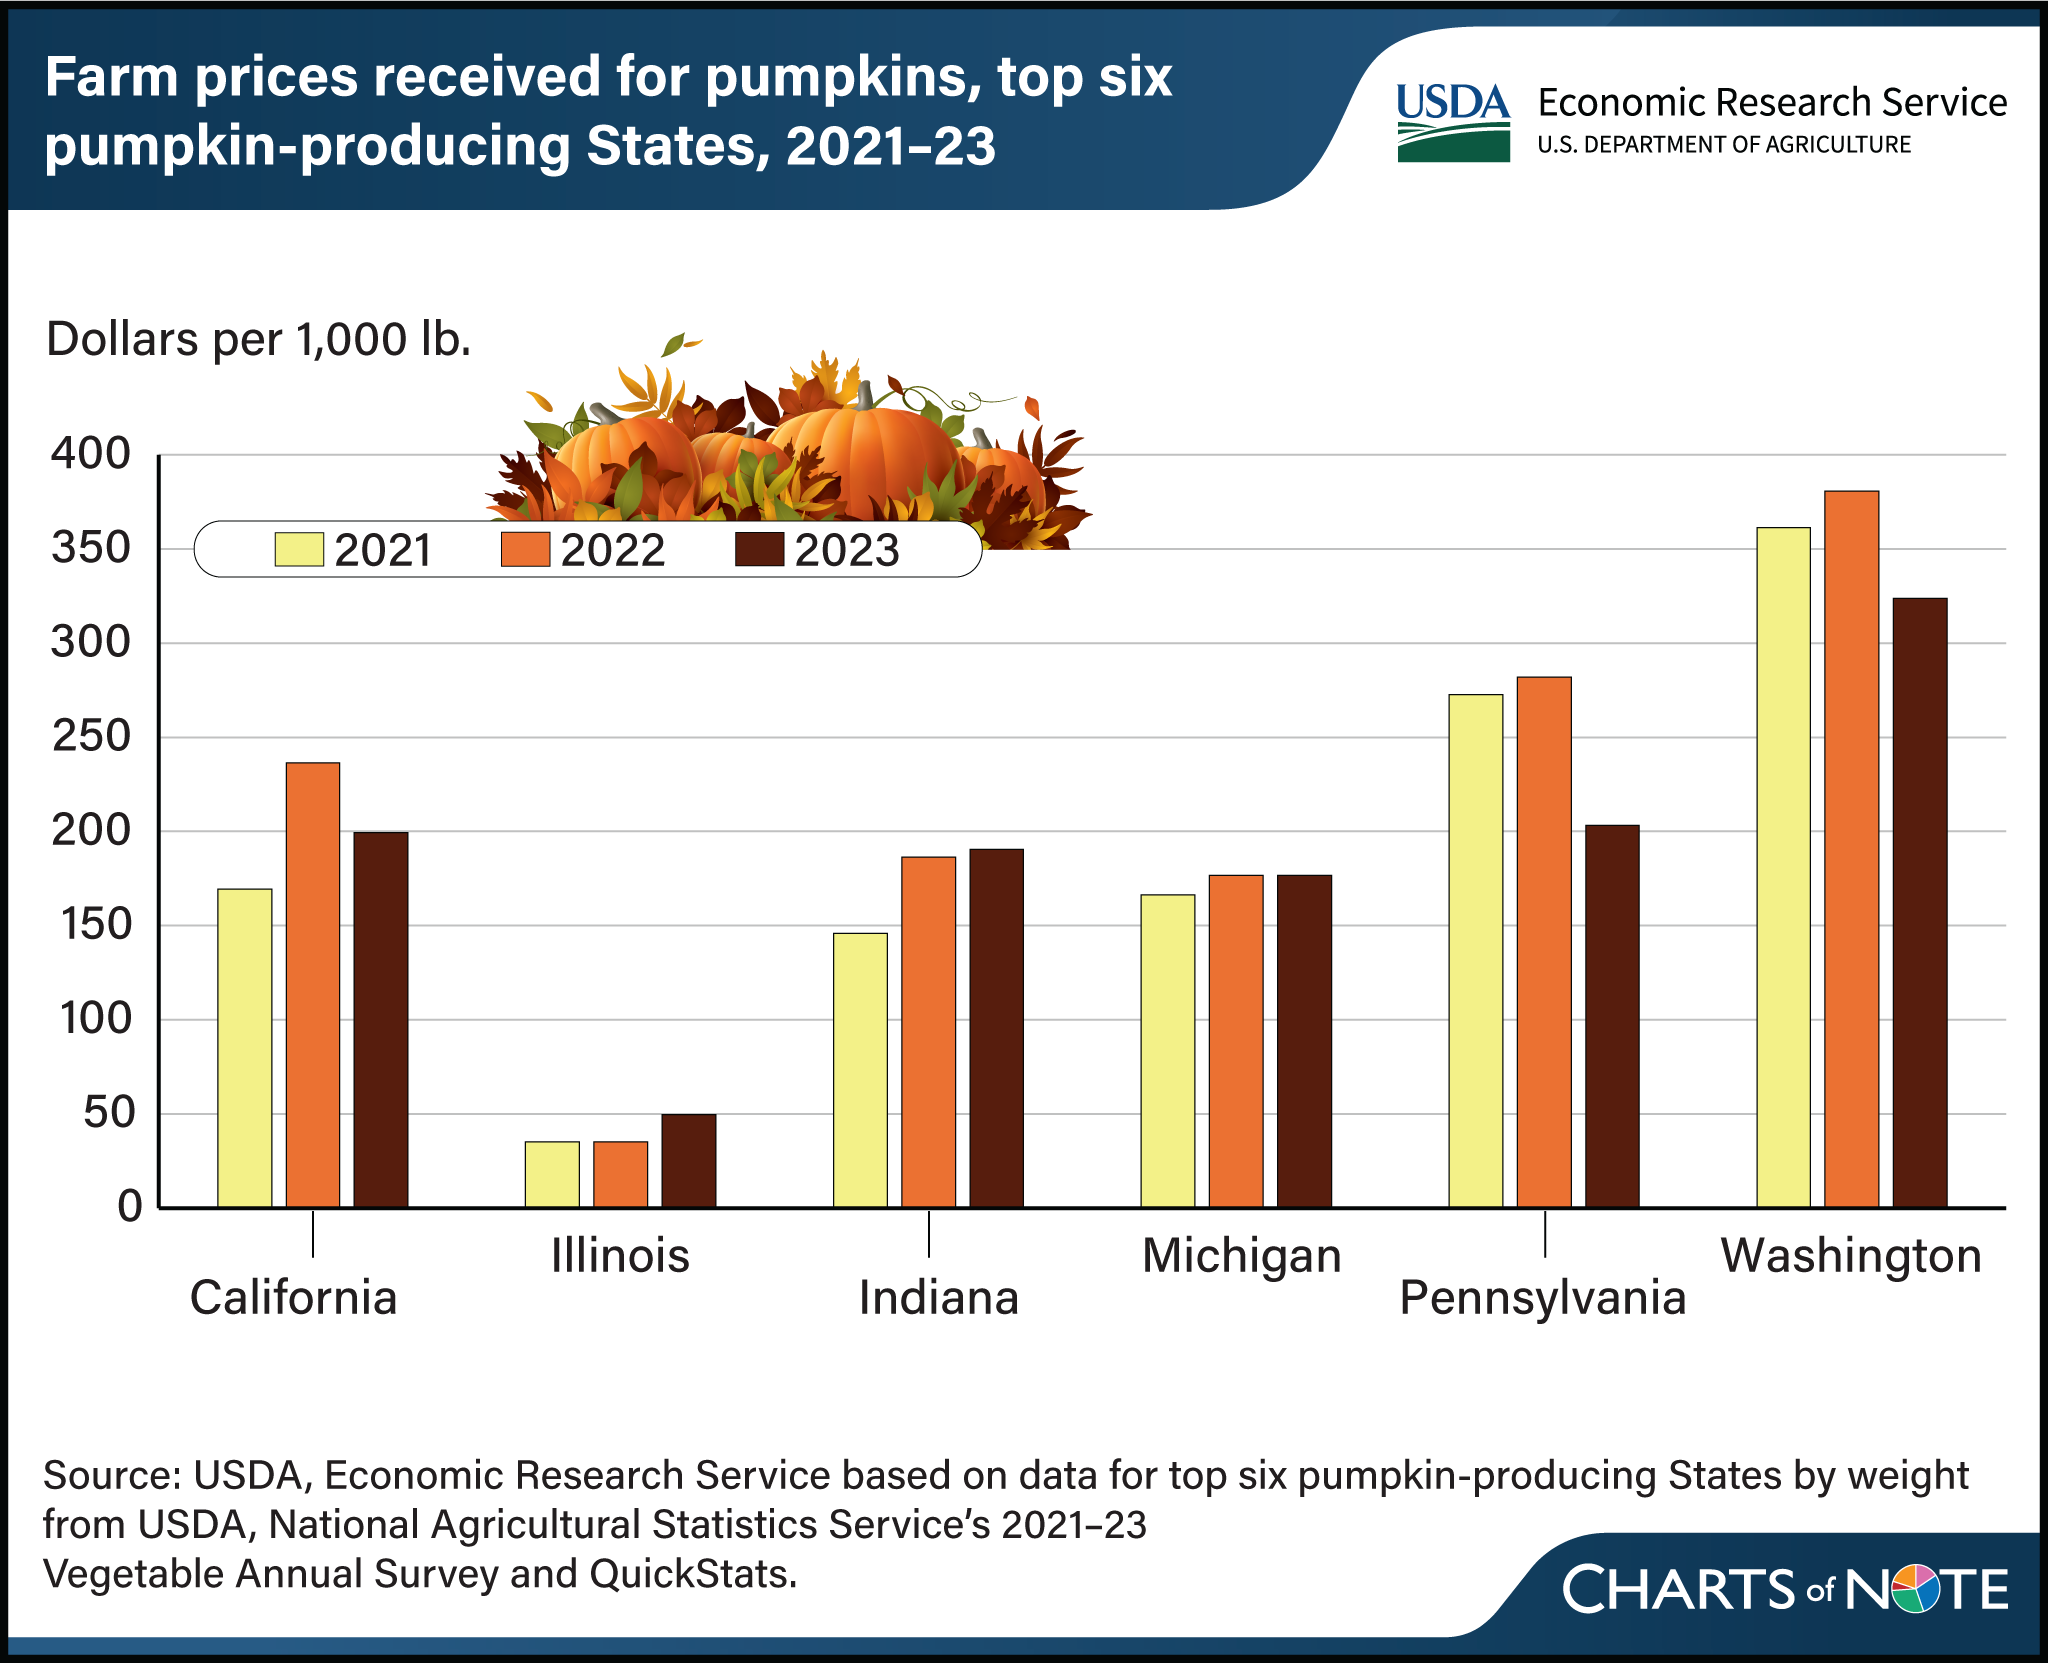
Farm prices received for pumpkins vary widely by State
- by Gregory Astill
- 10/24/2024

Pumpkins are native to the Americas, and their cultivation has been dated back to 7,000 BCE in what is now Mexico. Today, pumpkins are grown commercially in every U.S. State, with uses ranging from cooking and baking to decorating and carving jack-o’-lanterns. Farm prices received can vary widely by State because of the type of pumpkins being grown and their intended use. About 85 percent of U.S. pumpkin acres harvested go to the fresh market, mostly for decorative purposes. The remaining 15 percent go to the processing market, which are used in food products, such as pumpkin puree, and are priced lower than decorative pumpkins. In Illinois, about 70 percent of pumpkin acres are harvested for processing. This means that Illinois growers consistently received the lowest prices, averaging $40 per 1,000 pounds of pumpkins during 2021 to 2023. In contrast, Washington growers consistently received the highest prices for their predominantly decorative pumpkins, averaging $355 per 1,000 pounds during 2021 to 2023. In 2023, prices in other top pumpkin-producing States averaged between $177 and $203 per 1,000 pounds of pumpkins, most of which were used for decorative purposes. This chart is drawn from USDA, Economic Research Service’s Trending Topics page, Pumpkins: Background & Statistics.

