Fruit and vegetable costs vary by type and form
- by Hayden Stewart and Jeffrey Hyman
- 10/1/2024

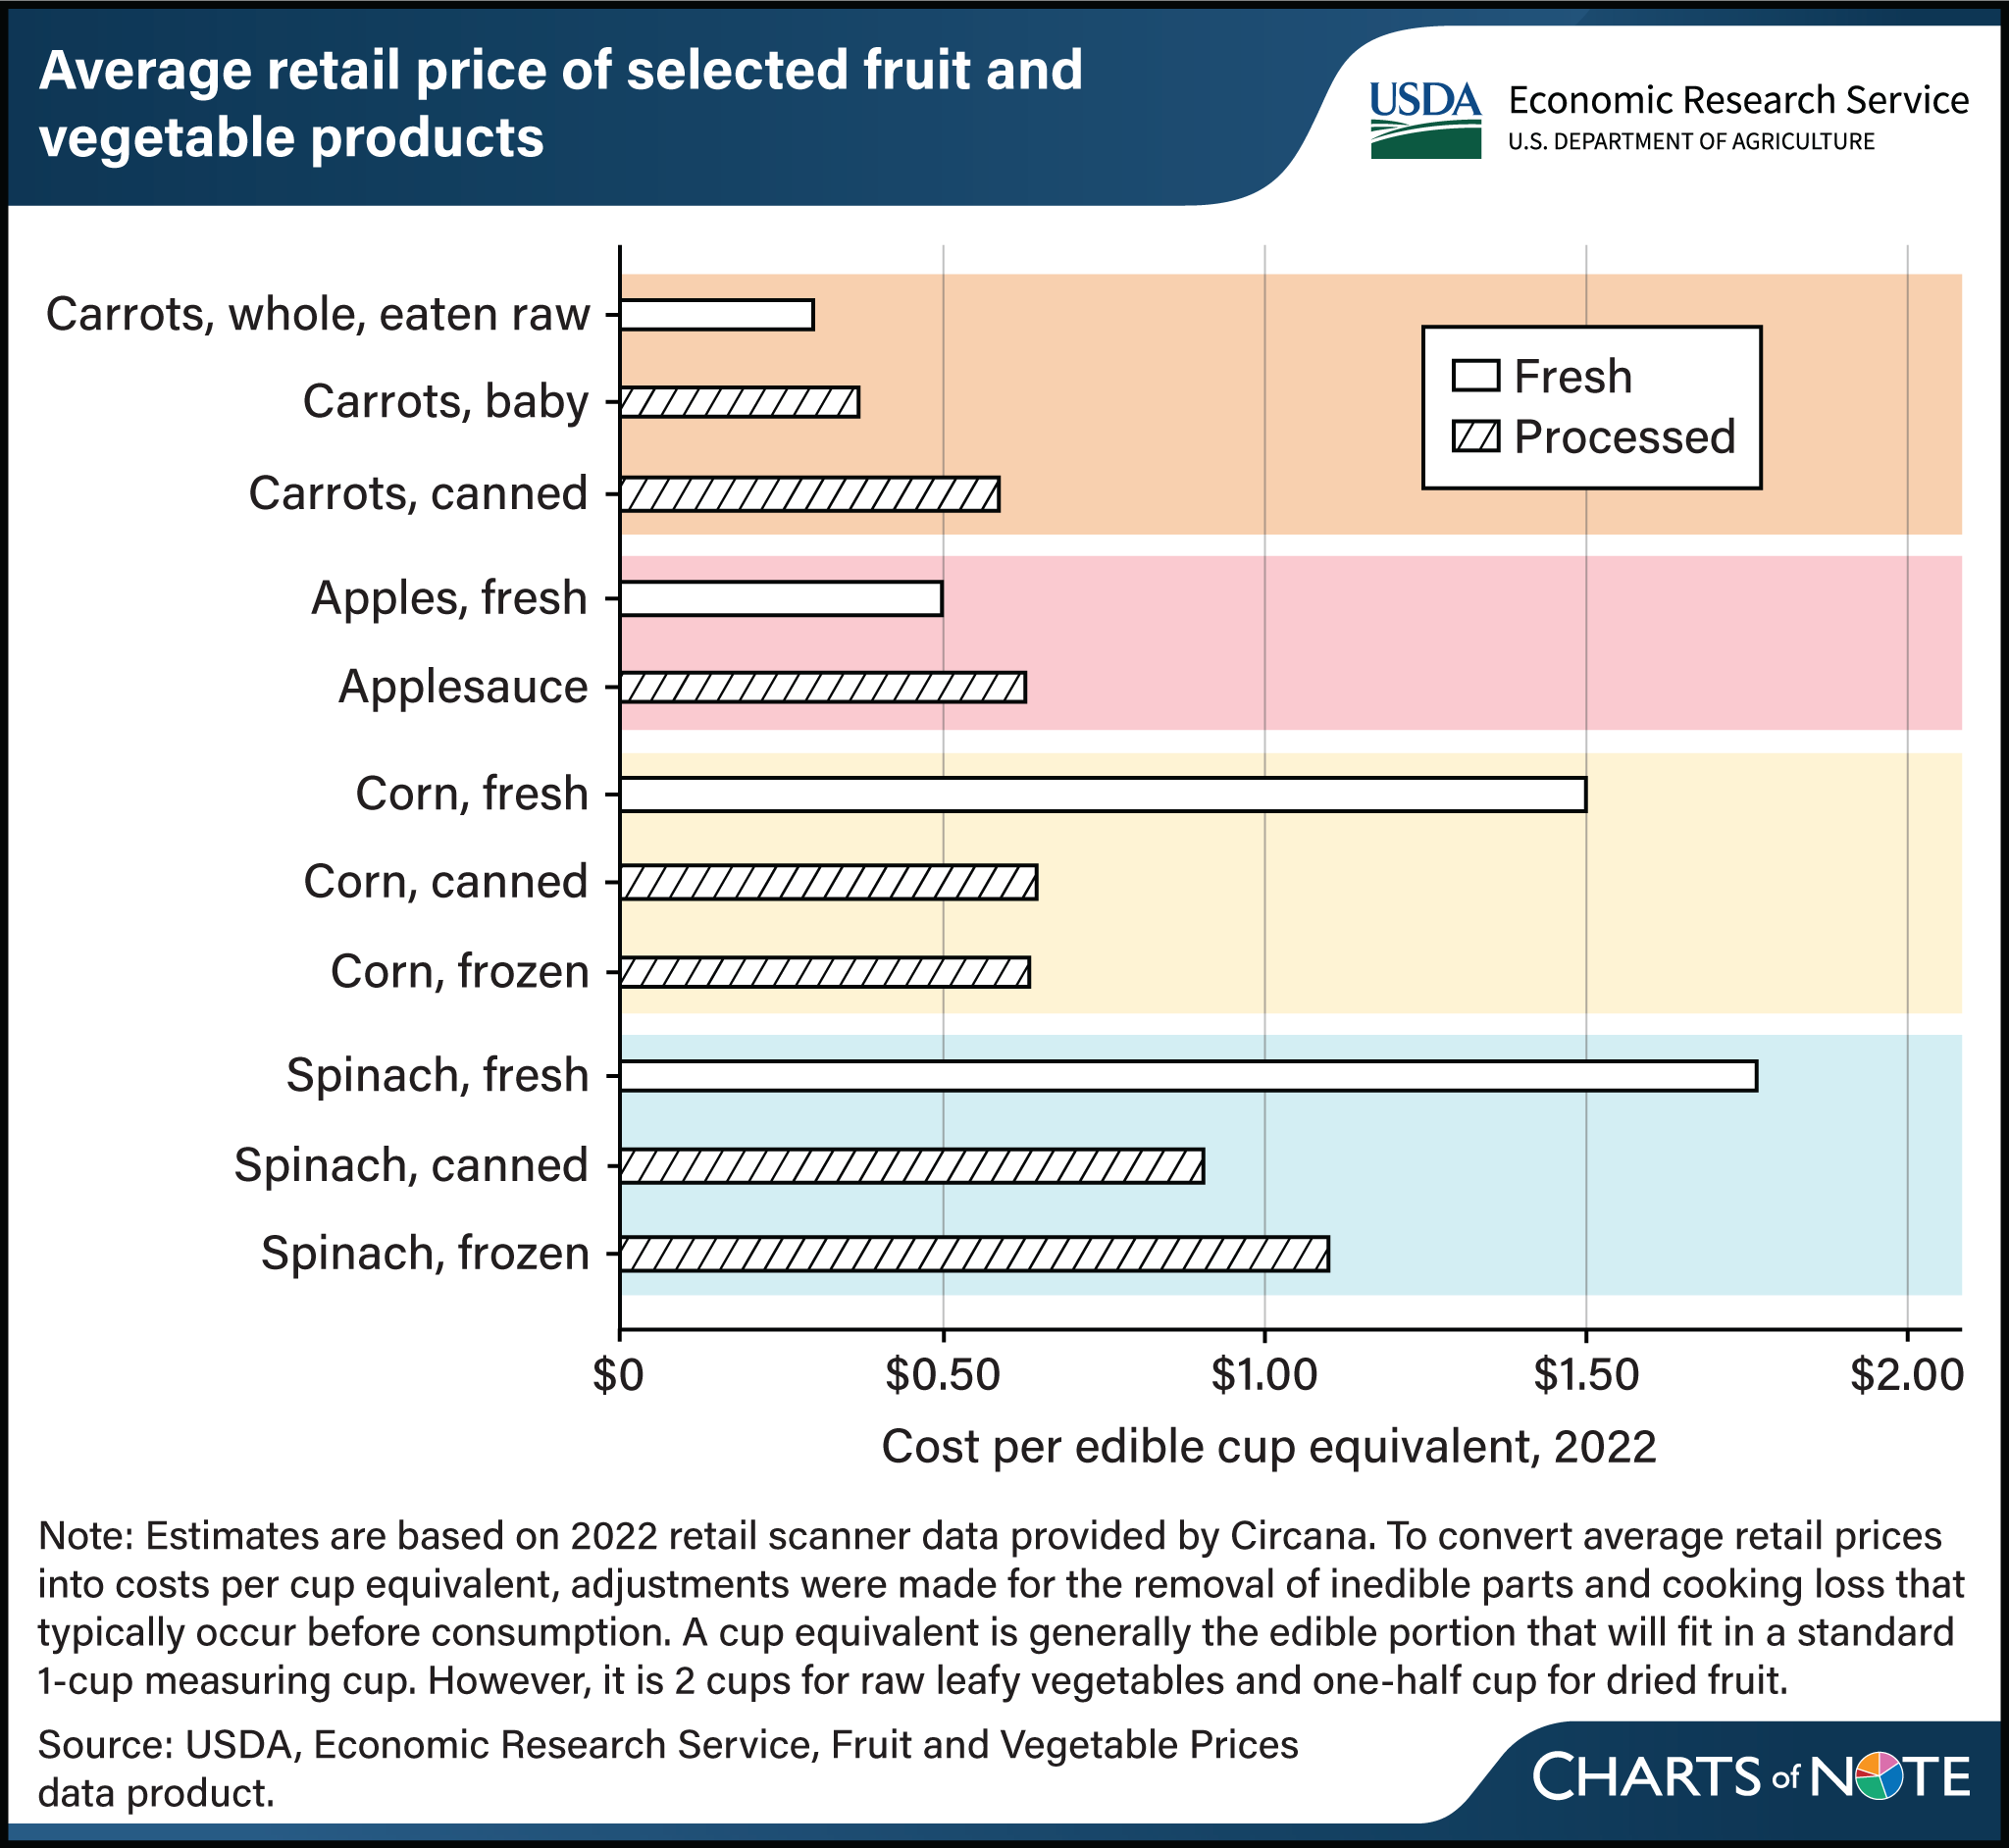
The Dietary Guidelines for Americans, 2020–25 defines fruits and vegetables to include fresh, canned, frozen, and dried products, as well as 100 percent juice. Eating or drinking a cup equivalent of all forms counts equally toward intake recommendations for both food groups. A cup equivalent is generally the edible portion—minus core, pits, and peel—that will fit in a 1-cup measuring cup. For lettuce and other raw leafy vegetables, a cup equivalent is 2 cups, and for raisins and other dried fruits, one-half cup. USDA, Economic Research Service researchers estimated national average retail prices paid in 2022 for 155 fresh and processed fruits and vegetables, all measured in cup equivalents. Neither fresh nor processed forms were consistently less expensive. While fresh carrots eaten raw ($0.30) cost less than canned carrots ($0.59) and fresh apples ($0.50) cost less than applesauce ($0.63), fresh corn ($1.50) was more expensive than frozen corn ($0.64) and fresh spinach ($1.77) was more expensive than frozen spinach ($1.10). Differences in retail prices may reflect prices received by growers, as well as differences in processing, handling, and spoilage costs, which can vary by form and product. This chart appears in the Amber Waves article Satisfying Fruit and Vegetable Recommendations Possible for Under $3 a Day, Data Analysis Shows, published September 2024.

