
Base acreage and direct payment rates vary by commodity
- by Economic Research Service
- 11/26/2012
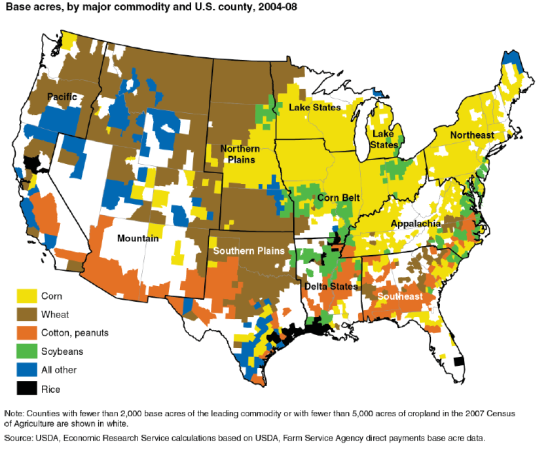
Direct payments are farm program payments that are based on historical cropping patterns of major commodities, or "base acres," with per-acre rates fixed in legislation and not linked to current production or market prices. Direct payments per acre vary significantly by commodity. In 2008, rice and peanuts received the largest direct payments per acre ($96.25 and $45.85, respectively). Rice base acres were predominant in a few counties along the Gulf Coast and in the Pacific region, while peanut base acres were concentrated in the Southeast. Corn, wheat, and soybeans accounted for more than 80 percent of total base acres in 2008, but received lower direct payments per acre ($24.39 per acre, $15.21 per acre, and $11.54 per acre, respectively). Corn base acres dominated in the Corn Belt, Lake States, the Northeast and Appalachia while wheat base acres were prevalent in the Northern and Southern Plains as well as parts of the Mountain region. This chart is found in the ERS report, Potential Farm-Level Effects of Eliminating Direct Payments, EIB-103, November 2012.