

Peeling Open U.S. Fruit Consumption Trends
- by Sabrina Young, Hayden Stewart, Anne T. Byrne, Linda Kantor and Diansheng Dong
- 2/27/2025
Highlights
- On average, U.S. consumers ate the same amount of whole and cut fruit in 2021 as they did in 2003 but drank less juice.
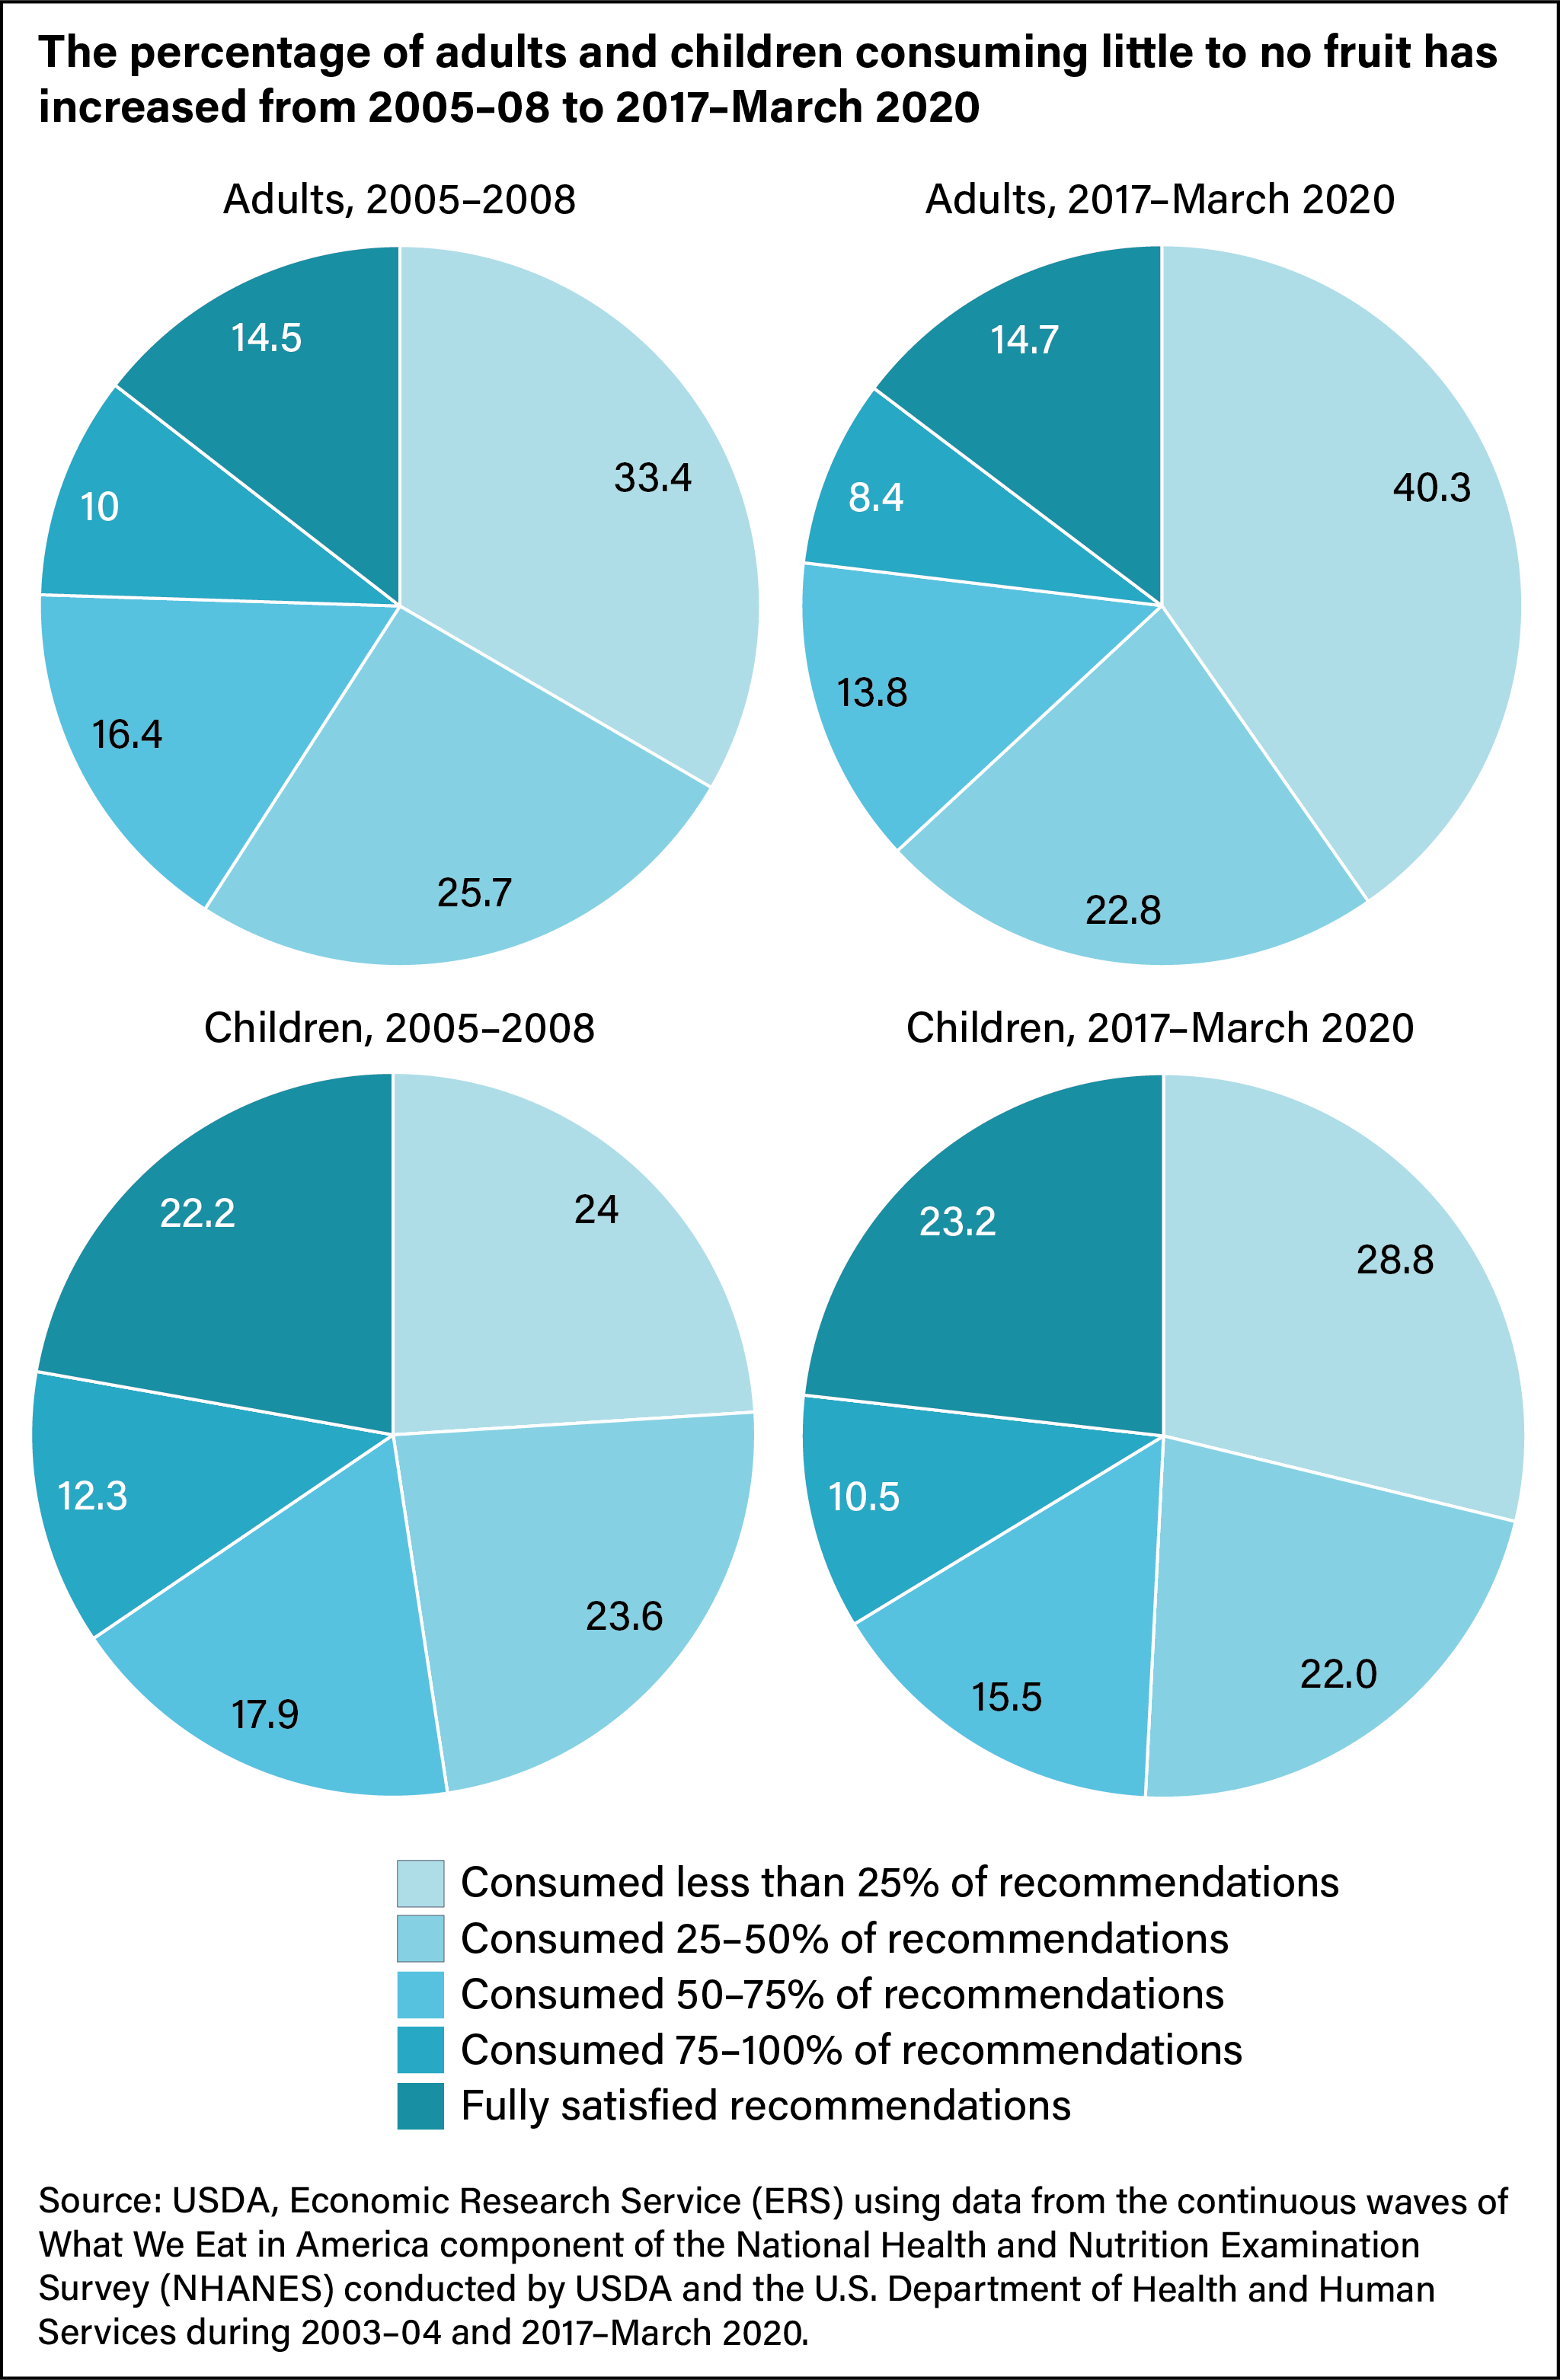
- The share of children and adults consuming little to no fruit increased between 2003–2004 and 2017–March 2020. The share for children rose 5 percentage points to 29 percent and for adults rose 7 percentage points to 40 percent.
- Health behaviors and health awareness are stronger predictors of fruit consumption than income and prices.
The Dietary Guidelines for Americans (DGA), 2020-2025 considers the underconsumption of a number of nutrients, including dietary fiber, potassium, calcium, and vitamin D as a public health concern. Fruit is a rich source of these nutrients.
For a healthful and nutritionally adequate diet, the DGA 2020-2025 advises individuals to consume about one cup-equivalent of fruit for every 1,000 calories, with some variations for children and adolescents based on sex and physical activity. For example, the guidelines recommend that adolescents 14–18 years old with an 1,800-calorie-a-day diet consume 1.5 cup equivalents of fruit a day and that members of the same age group with a 3,200-calorie diet consume 2.5 cup equivalents a day. USDA and the U.S. Department of Health and Human Services release a new version of the Dietary Guidelines every 5 years. Since 2005, recommendations for fruit have remained consistent.
About 80 percent of the U.S. population consumes less than the recommended amount of fruit. The DGA 2020–25 defines fruit to include fresh, canned, frozen, and dried products as well as 100-percent juice. Eating or drinking a cup equivalent of each fruit type counts equally toward recommendations, although juice should not account for more than half of total fruit intake. Juice retains many of the same nutrients as other forms of fruit but contains little dietary fiber.
Given the importance of this food group to diet quality and the extent of underconsumption, the USDA, Economic Research Service (ERS) recently examined U.S. fruit consumption patterns and trends.
Fruit Consumption Declined, Driven by Less Juice
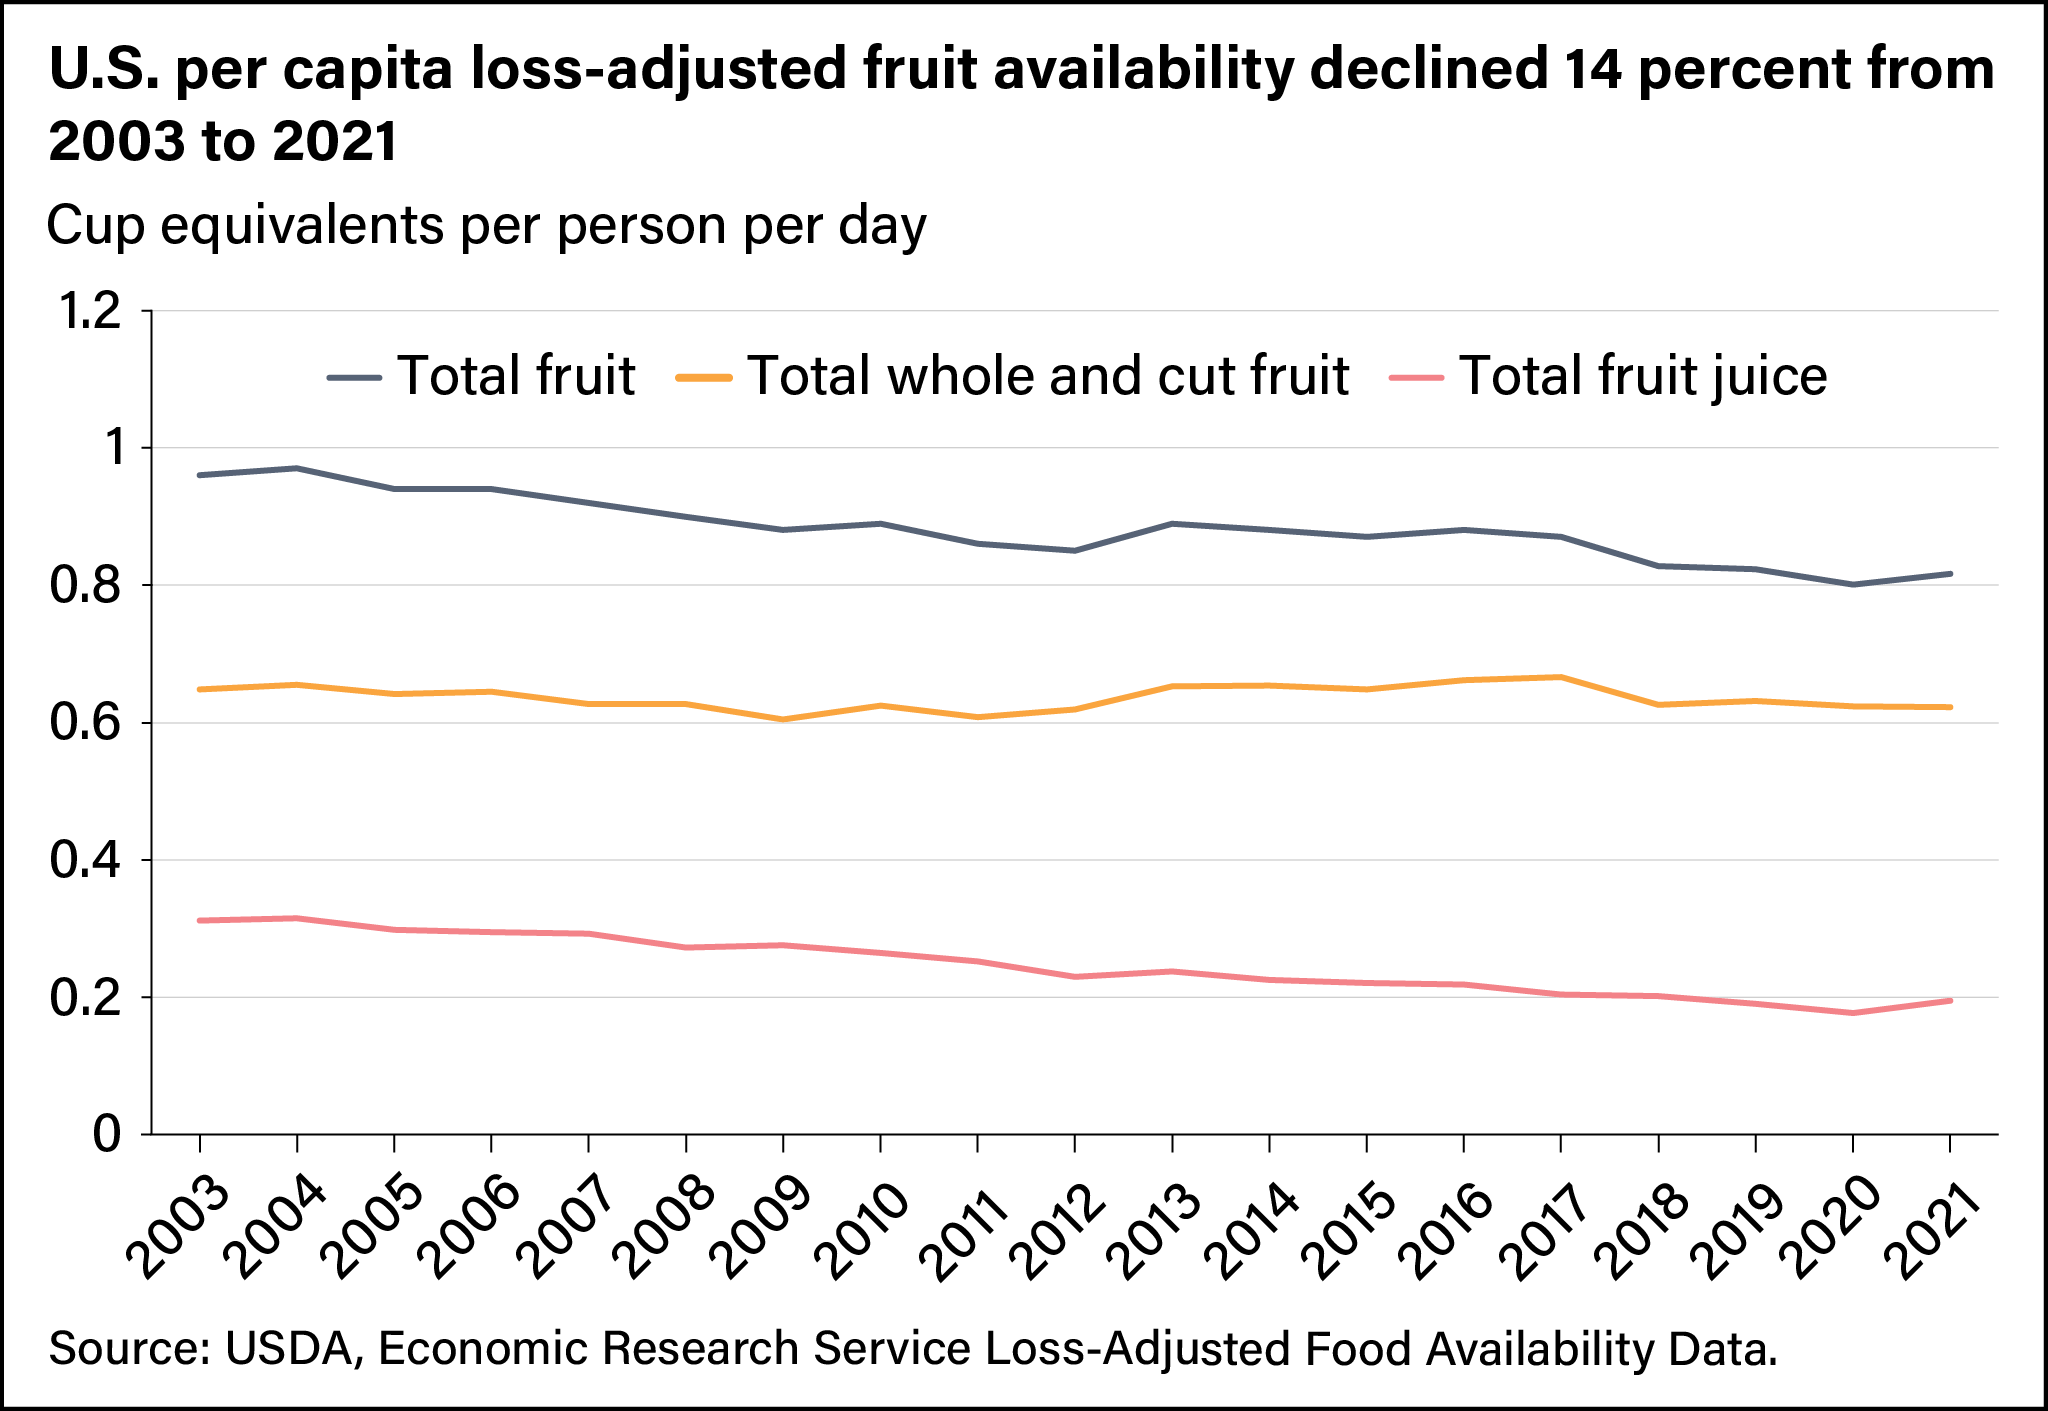
U.S. consumers have been eating and drinking less fruit, on average, since the turn of the 21st century. Estimates from the ERS Loss Adjusted Food Availability Data show per capita U.S. total fruit availability declined from 0.95 cup equivalents per person per day in 2003 to 0.82 cup equivalents per person per day in 2021, a 14-percent drop.
Loss-Adjusted Food Availability data can be used as a proxy for national consumption, with estimates going back to 1970 and available for total fruit as well as for fresh fruit, canned fruit, dried fruit, frozen fruit, and fruit juice. The ERS data measures the availability over time of more than 200 food commodities. Researchers use data on domestic production, imports, beginning stocks, exports, and measurable nonfood uses to estimate annual total supply for each commodity. ERS researchers then adjust the supply estimates down to account for food spoilage, plate waste, and other losses. Estimates of U.S. per capita consumption are calculated by dividing the amount of a commodity that is available for human consumption after adjustment by total population size.
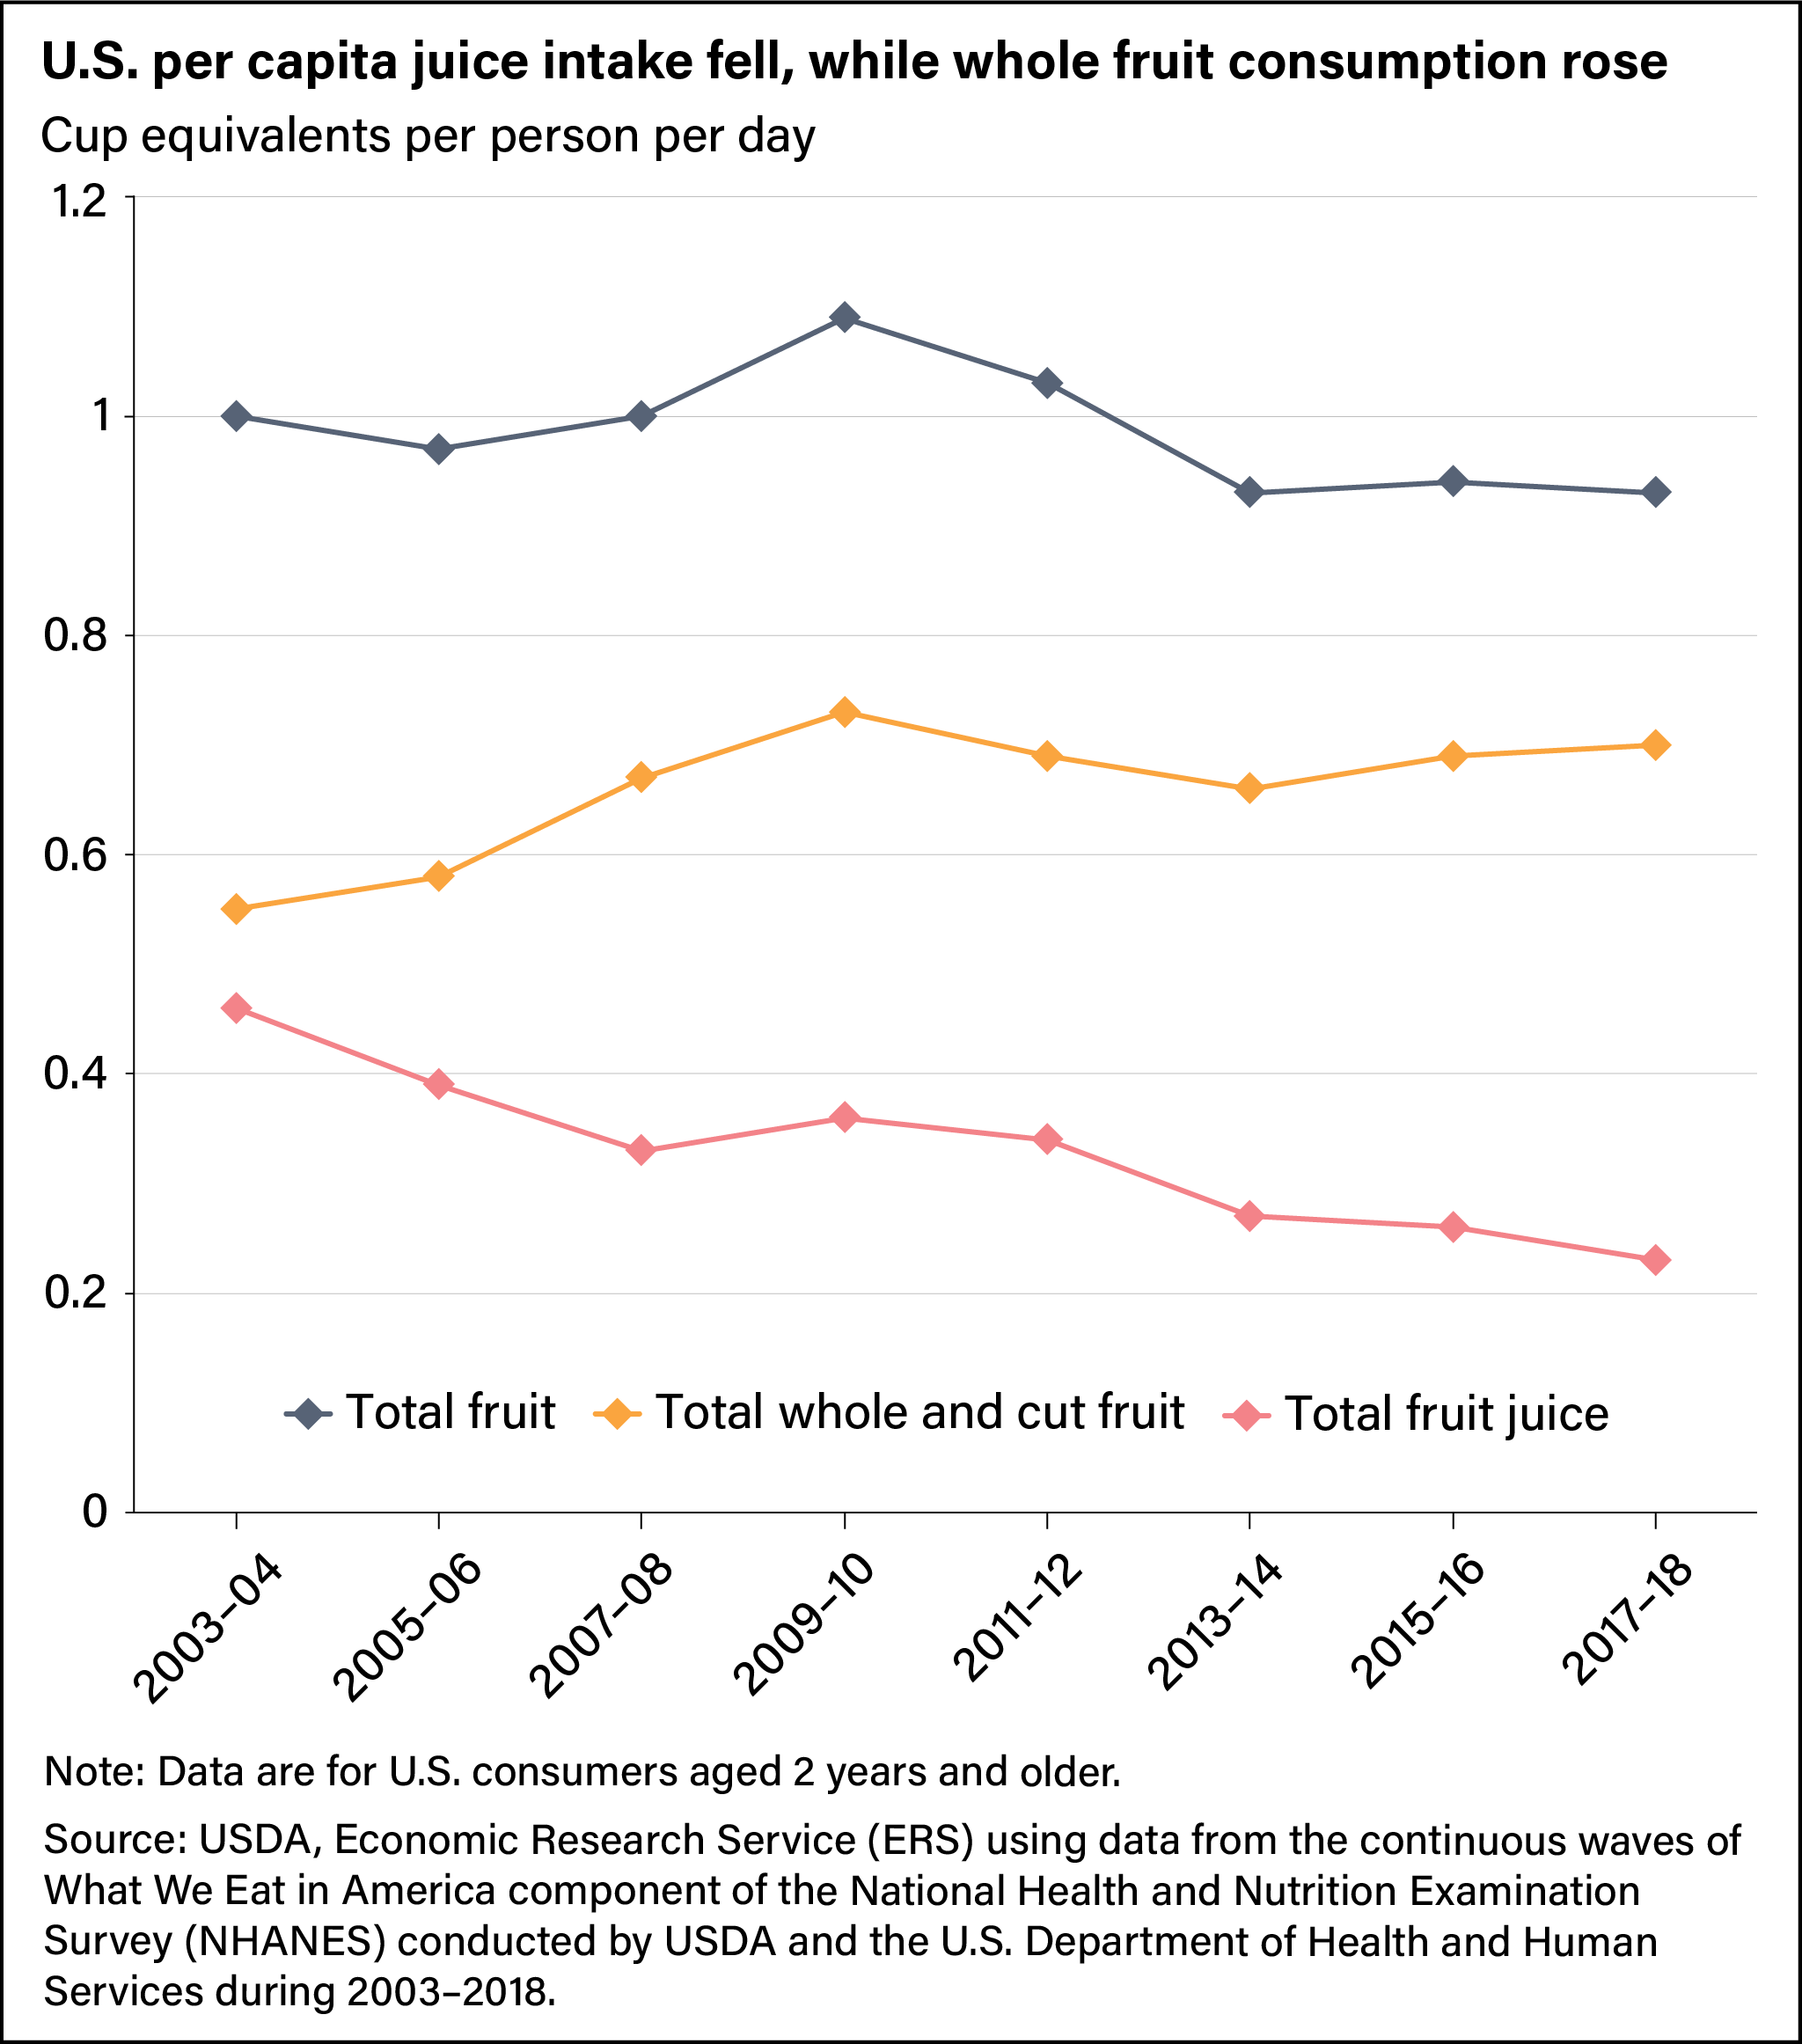
Data from the National Health and Nutrition Examination Survey (NHANES), collected at the individual level, similarly show total fruit intake in the United States declined 7 percent from 1 cup equivalent per person per day in 2003–04 to 0.93 cup equivalents per person per day in 2017–18. Participants in this survey are asked to report all foods and beverages they consumed over 2 nonconsecutive days, as well as their income, demographic details, and health status. Nutritionists use these data to study diet quality. About 5,000 individuals complete the NHANES each year of collection, and about 9,000 to 10,000 for every 2-year survey wave.
The ERS Loss-Adjusted Food Availability data product and NHANES both show U.S. consumers drank less fruit juice over time, on average. However, the ERS data show no change in the availability of fruit in whole and cut (fresh and nonjuice processed) forms, while NHANES data point to a small increase in whole and cut fruit intake. This increase tempered the drop in juice consumption, but overall trends still indicate that average total fruit consumption declined between 2003–04 and 2017–18 and remained far from Federal recommendations.
Children Ate More Fruit at School; Senior Adults Ate Less Fruit Overall
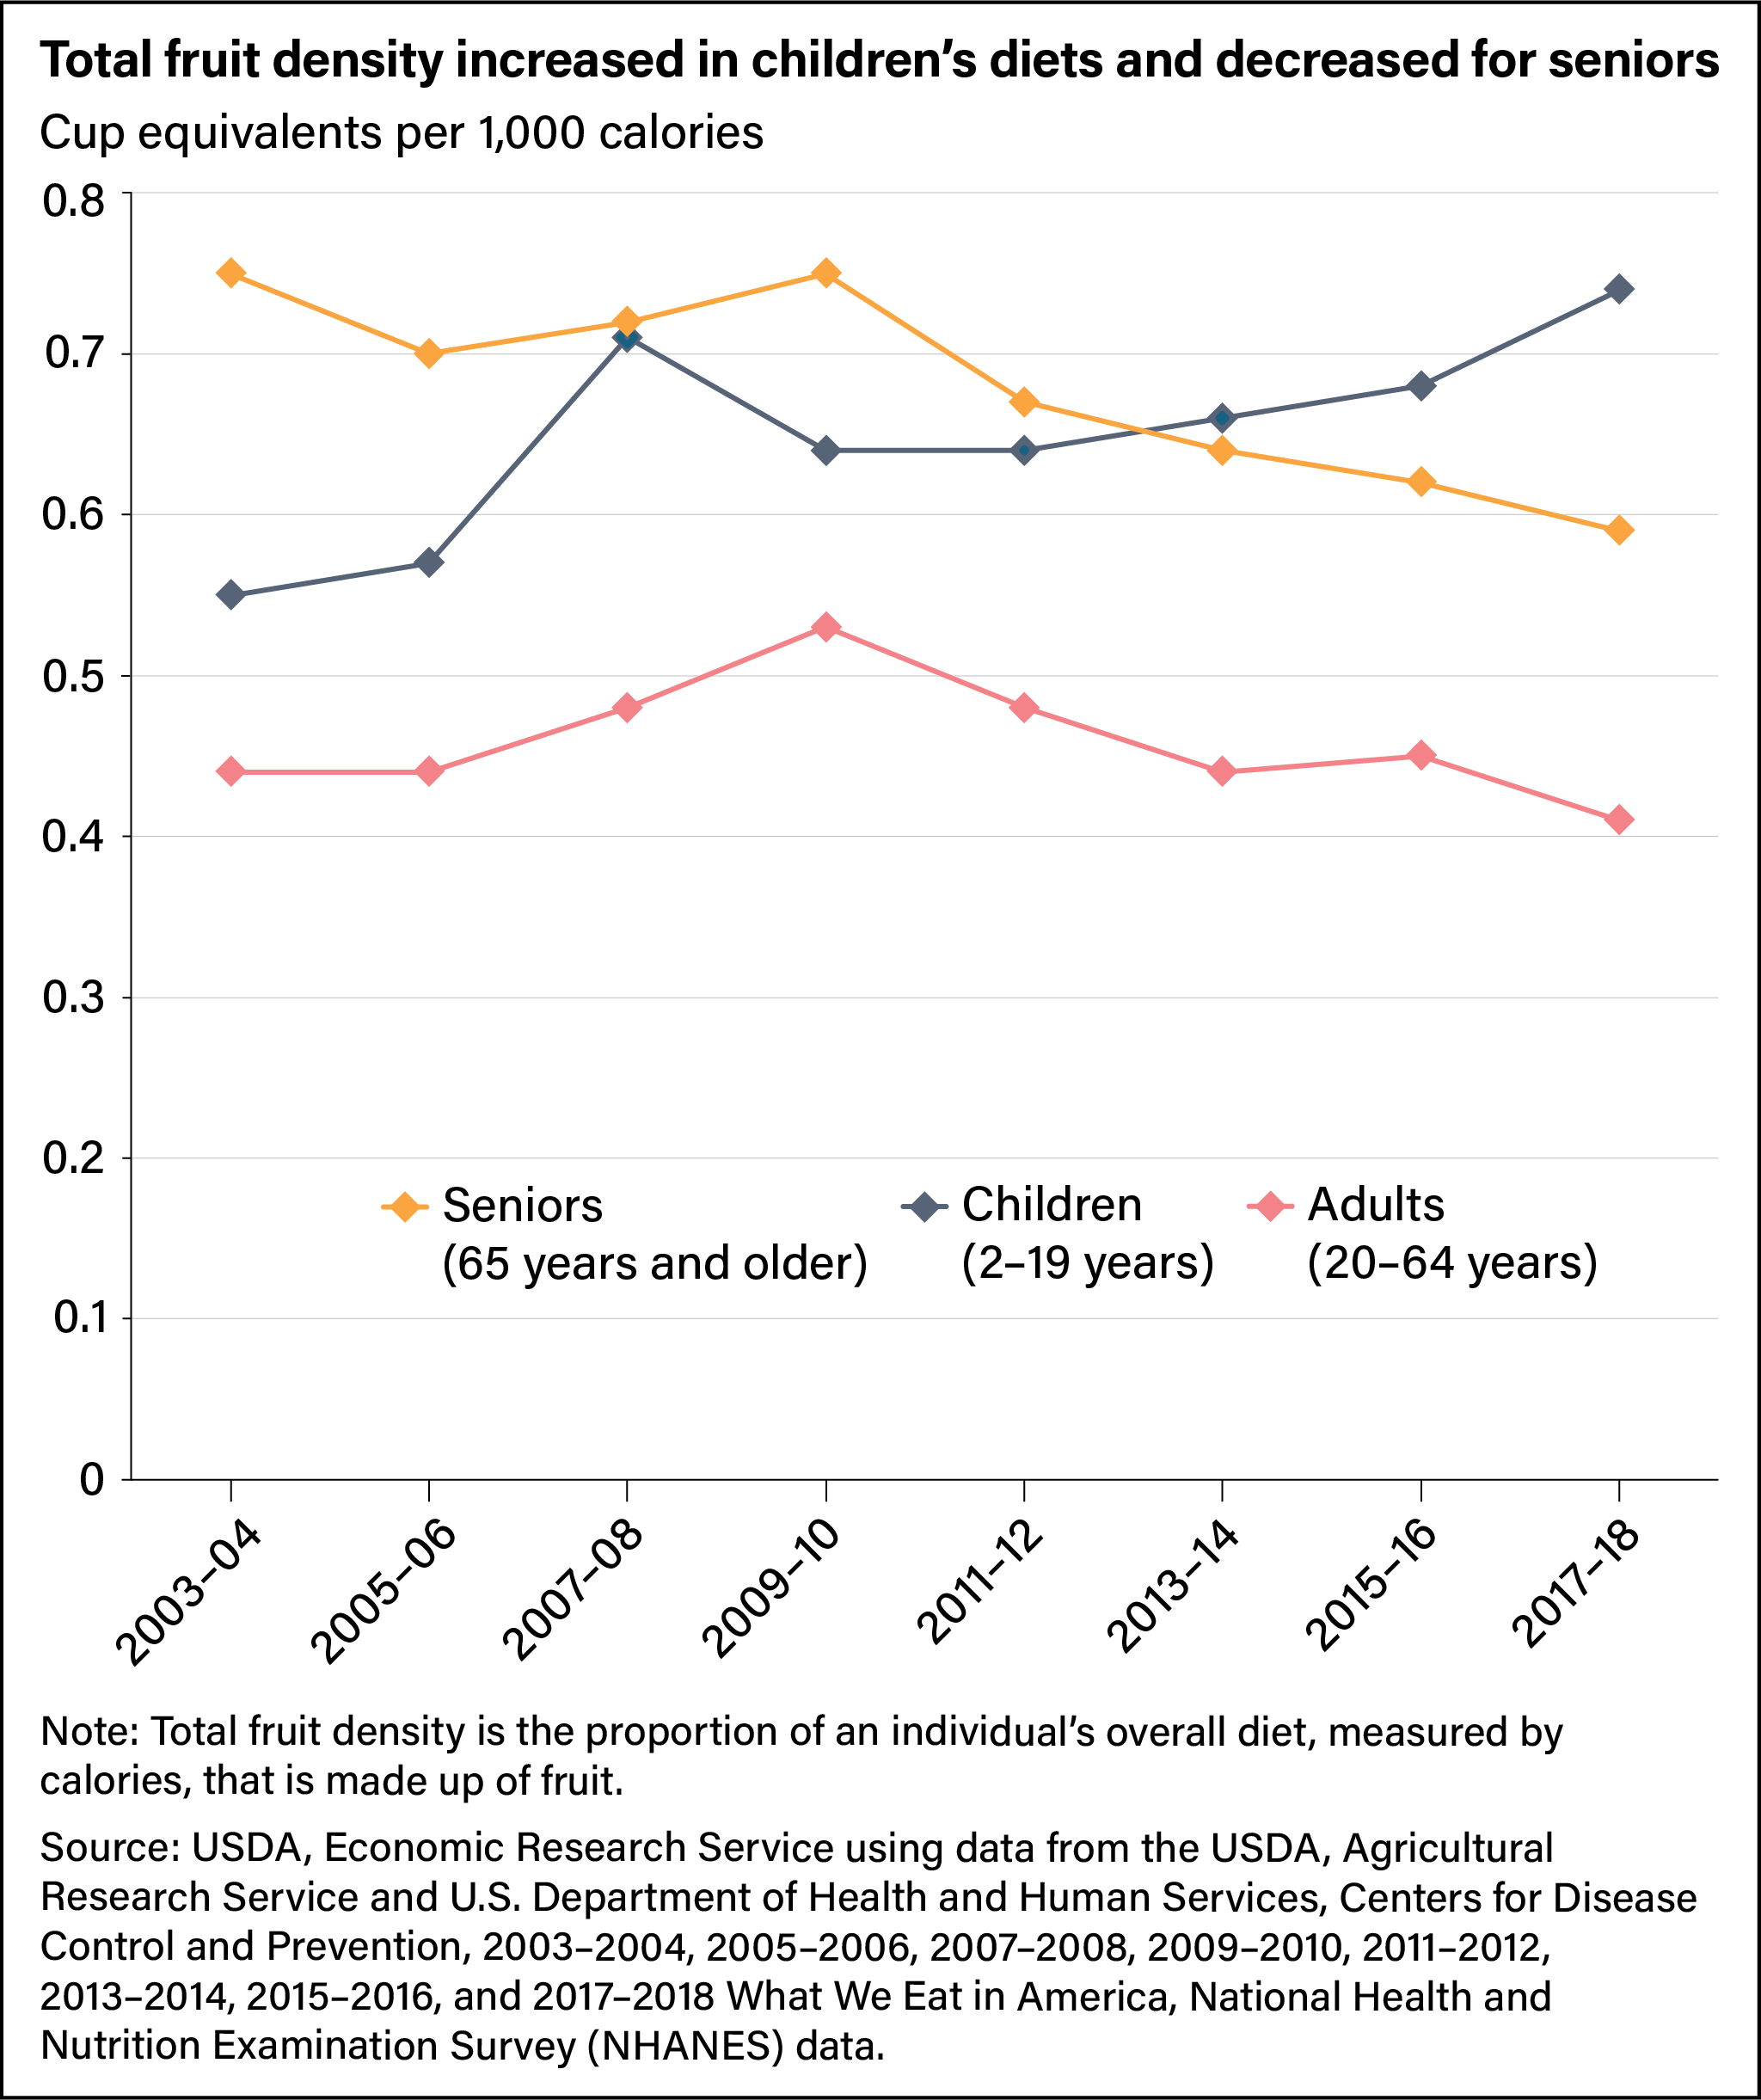
A person’s nutritional needs and food consumption habits tend to change with age. Researchers at ERS and the University of Georgia used NHANES data to compare fruit consumption trends among children and teens aged 2 through 19 years, working-age adults aged 20 through 64, and seniors aged 65 or more. The researchers focused on the proportion of an individual’s overall diet, measured by calories, that is made up of fruit. This is called fruit density. Children were found to fare best. The fruit density of children’s diets increased from an average of 0.55 cup equivalents per 1,000 calories in 2003–04 to 0.74 cup equivalents per 1,000 calories in 2017–18.
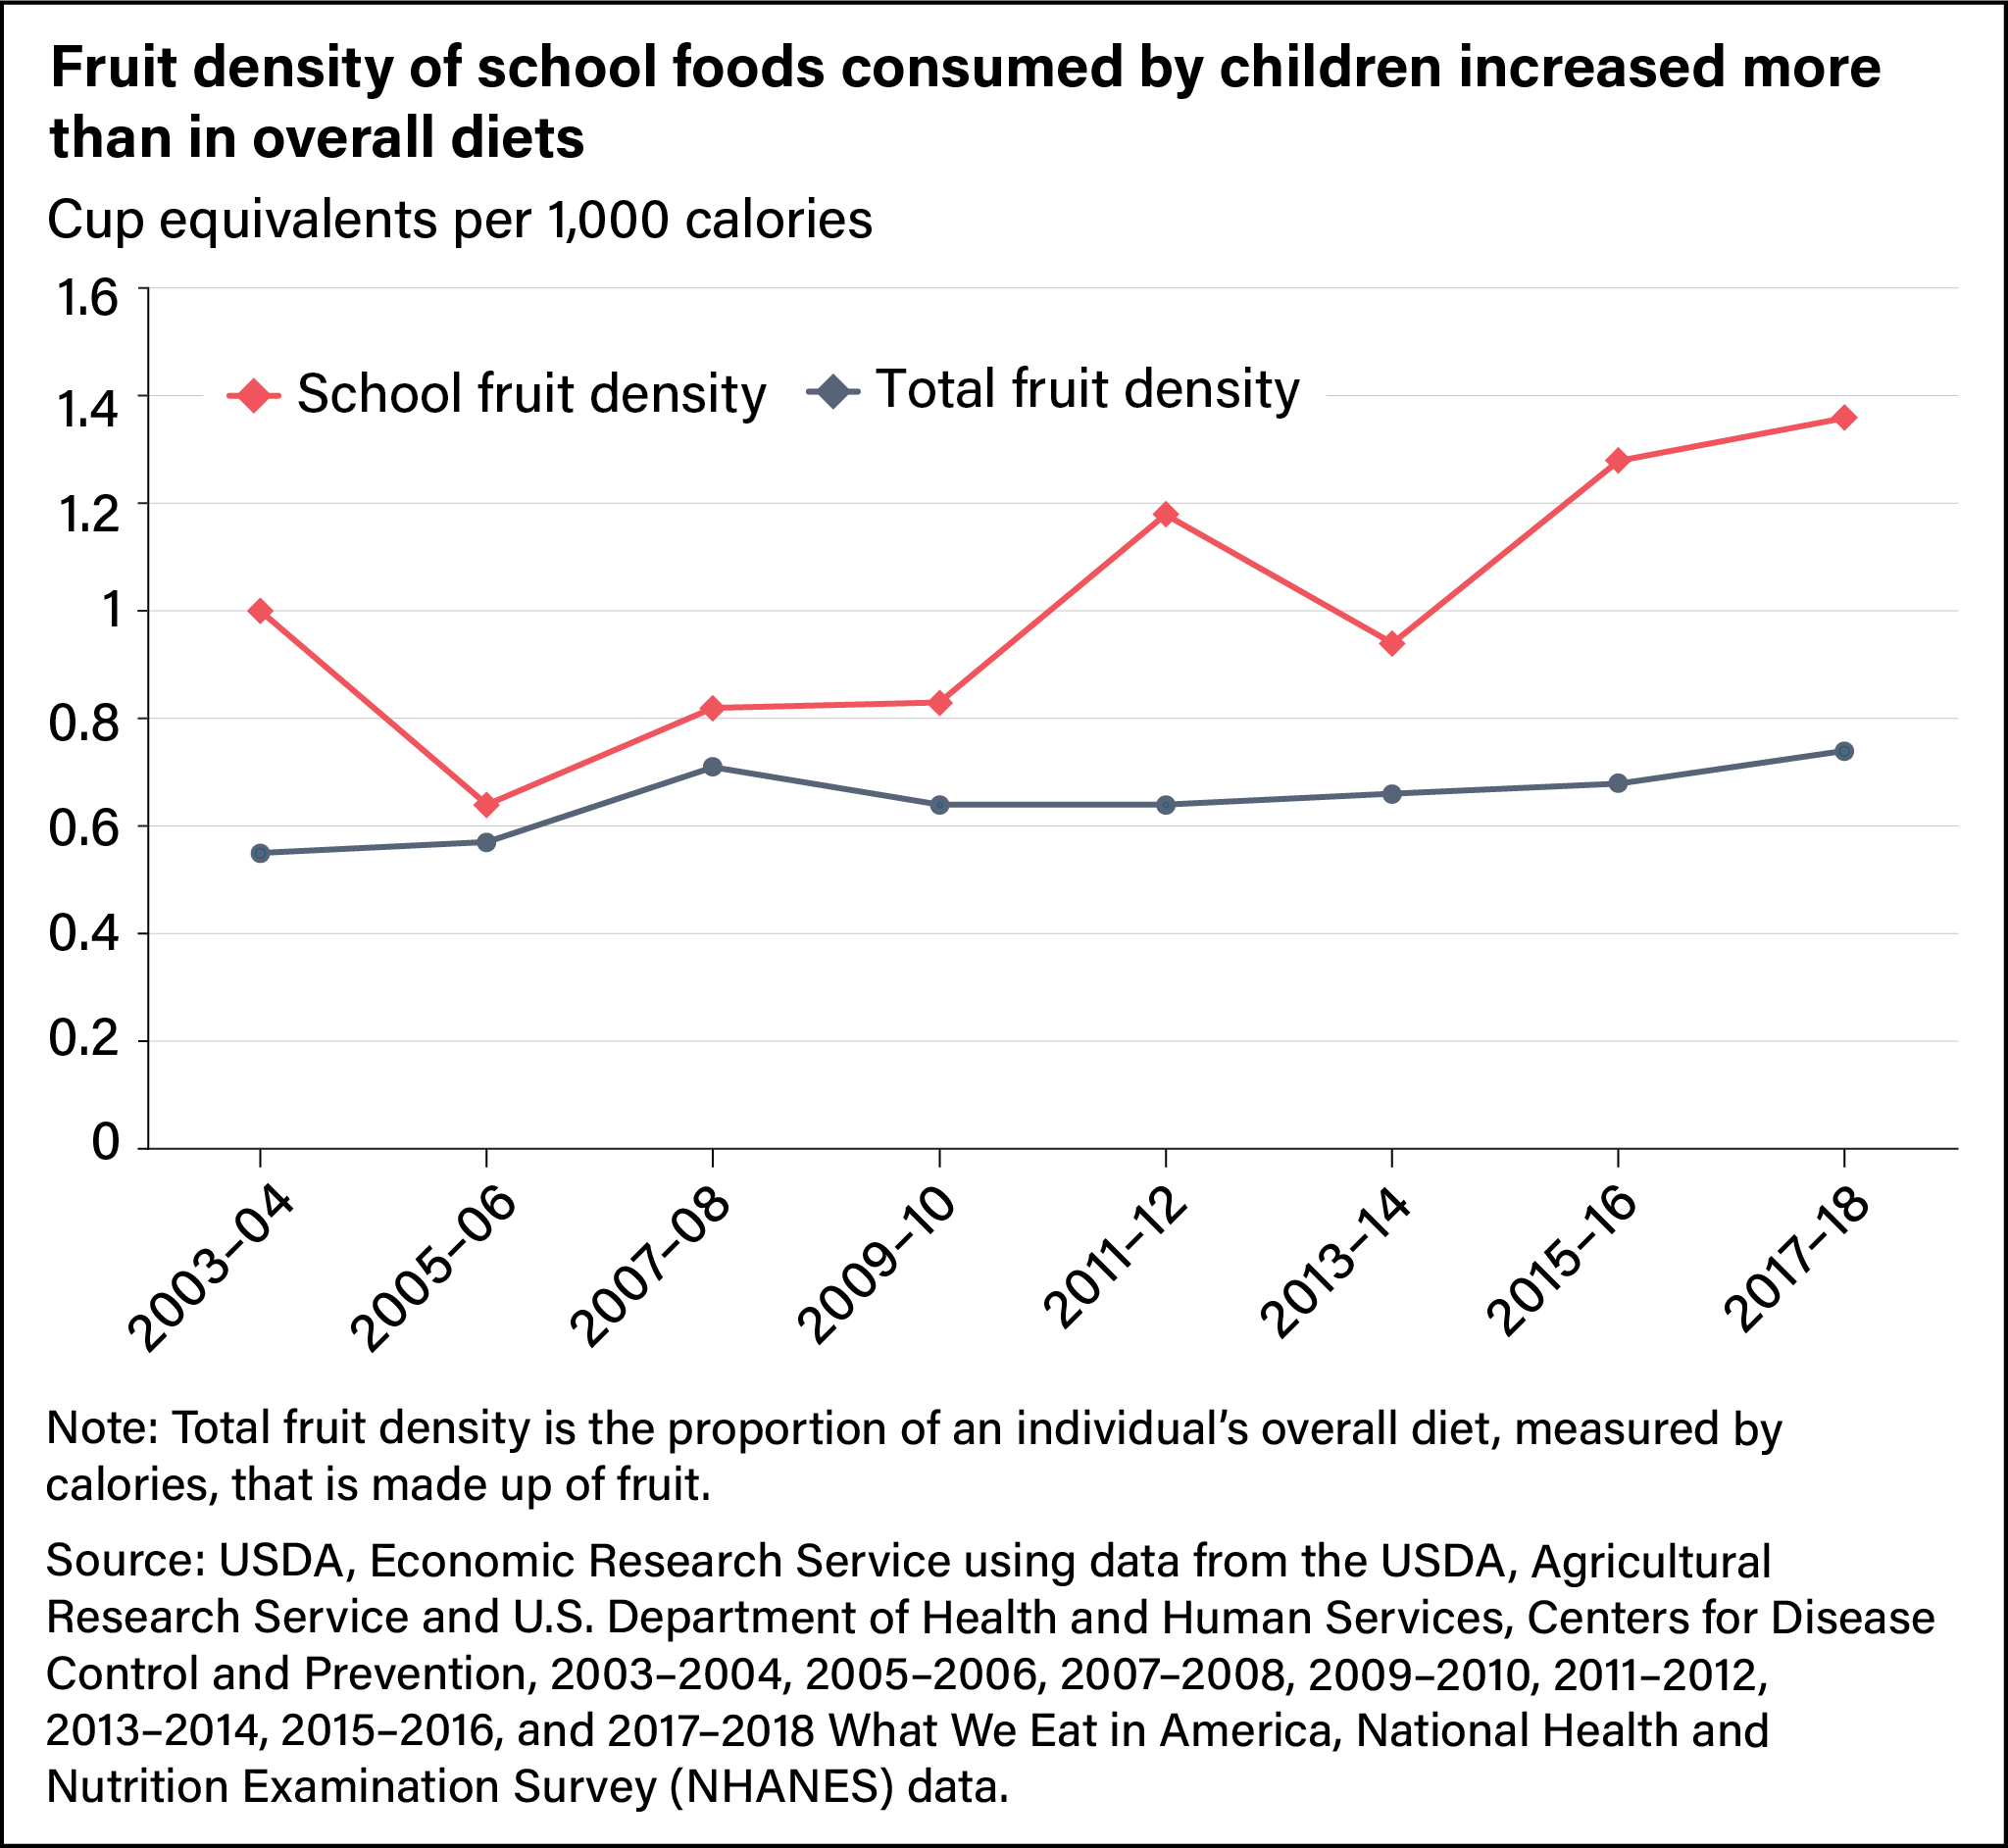
In-school meals drove the increase in fruit consumption among children. The fruit density of children’s diets when eating at school increased from 1 cup equivalent per 1,000 calories in 2003–04 to 1.36 cup equivalents per 1,000 calories in 2017–18. USDA’s National School Lunch Program requires that children in kindergarten through 8th grade be offered 0.5 cup equivalent of fruit per day. The requirement for high schoolers is 1 cup equivalent per day. For all ages, the School Breakfast Program requires offering 1 cup equivalent per day.
Seniors and working-age adults do not fare as well as children in terms of meeting dietary guidelines for fruit. In 2017–18, seniors consumed 0.59 cup equivalents of fruit per 1,000 calories, which is 0.16 cup equivalents less fruit per 1,000 calories than they consumed in 2003–04.
Distribution of Fruit Consumption Compared With Recommendations Has Changed
In addition to average fruit intakes, ERS researchers also studied the distribution of fruit intake. Researchers used NHANES food consumption data to assess the percentage of U.S. children and adults at very low fruit consumption (less than 25 percent of Federal recommendations) and high fruit consumption (fully meeting Federal recommendations).
Both children and adults, including seniors, consistently have fallen short of Federal guidelines. Only 23.2 percent of children and 14.7 percent of adults met the DGA’s fruit recommendations for their age and sex group in the period covering 2017 to March 2020. In that same period, 28.8 percent of children and 40.3 percent of adults consumed less than a quarter of fruit recommendations, representing an increase in little to no fruit intake from 2005 to 2008 for those age groups.
Fruit Consumption Levels Tied to Health Behaviors and Awareness
ERS researchers also sought to understand how individual and societal factors relate to being in the low- or high-consuming groups. They found the largest factors in predicting high consumption are health behaviors, including engaging in physical activity and not smoking, as well as health knowledge captured by awareness of USDA’s MyPlate, a tool used to visualize recommendations for a healthy diet. On the other hand, those who have these healthy behaviors and knowledge were less likely to be low fruit consumers. Researchers also found income and fruit prices did not have a strong association with low or high consumption.
This article is drawn from:
- Food Availability (Per Capita) Data System. (n.d.). U.S. Department of Agriculture, Economic Research Service.
- Stewart, H., Young, S., Dong, D. & Byrne, A.T. (2024). Trends in U.S. Fruit Consumption Relative to Recommendations in the Dietary Guidelines for Americans. U.S. Department of Agriculture, Economic Research Service. ERR-341.
- Lin, B., Guthrie, J. & Smith, T. (2023). Dietary Quality by Food Source and Demographics in the United States, 1977–2018. U.S. Department of Agriculture, Economic Research Service. EIB-249.
You may also like:
- Hyman, J. & Stewart, H. (2021, July 6). For Supplemental Nutrition Assistance Program (SNAP) Households, Fruit and Vegetable Affordability Is Partly a Question of Budgeting. Amber Waves, U.S. Department of Agriculture, Economic Research Service.
- Muhammad, A., D'Souza, A., Meade, B., Micha, R. & Mozaffarian, D. (2017). The Influence of Income and Prices on Global Dietary Patterns by Country, Age, and Gender. U.S. Department of Agriculture, Economic Research Service. ERR-225.
- Stewart, H. G., Young, S. K. & Carlson, A. C. (2023). Adherence to federal dietary recommendations for total fruit consumption and the intake of underconsumed nutrients: Findings from the National Health and Nutrition Examination Survey, 2015 to 2018. The Journal of Nutrition. 153(5), 1476–1482. https://doi.org/10.1016/j.tjnut.2023.03.018.
- Young, S. K. & Stewart, H. (2022). U.S. fruit and vegetable affordability on the Thrifty Food Plan depends on purchasing power and safety net supports. International Journal of Environmental Research and Public Health. 19(5), 2772. https://doi.org/10.3390/ijerph19052772.
- Stewart, H., Hyman, J., Dong, D. & Carlson, A. (2020). The more that households prioritise healthy eating, the better they can afford to consume a sufficient quantity and variety of fruits and vegetables. Public Health Nutrition. 24(7), 1841–1850. https://doi.org/10.1017/S1368980020004929.