U.S. Consumers Increased Spending on Food Away From Home in 2023, Driving Overall Food Spending Growth
- by Eliana Zeballos, Daniela Rivera-Cintron and Wilson Sinclair
- 10/8/2024
The USDA, Economic Research Service’s (ERS) Food Expenditure Series (FES) offers a comprehensive measure of the total value of all food purchases in the United States. The series tracks spending on food intended to be prepared at home (FAH), such as groceries, and food prepared away from home (FAFH), such as at restaurants. In February 2023, the series was expanded to include monthly data by outlet type, and in May 2023, ERS introduced State-level estimates into the series. The monthly and State-level FES estimates are for sales only and do not include food that is furnished (such as at hospitals), donated, grown at home, or served at educational institutions.
Record High Per Capita Food Spending in 2023
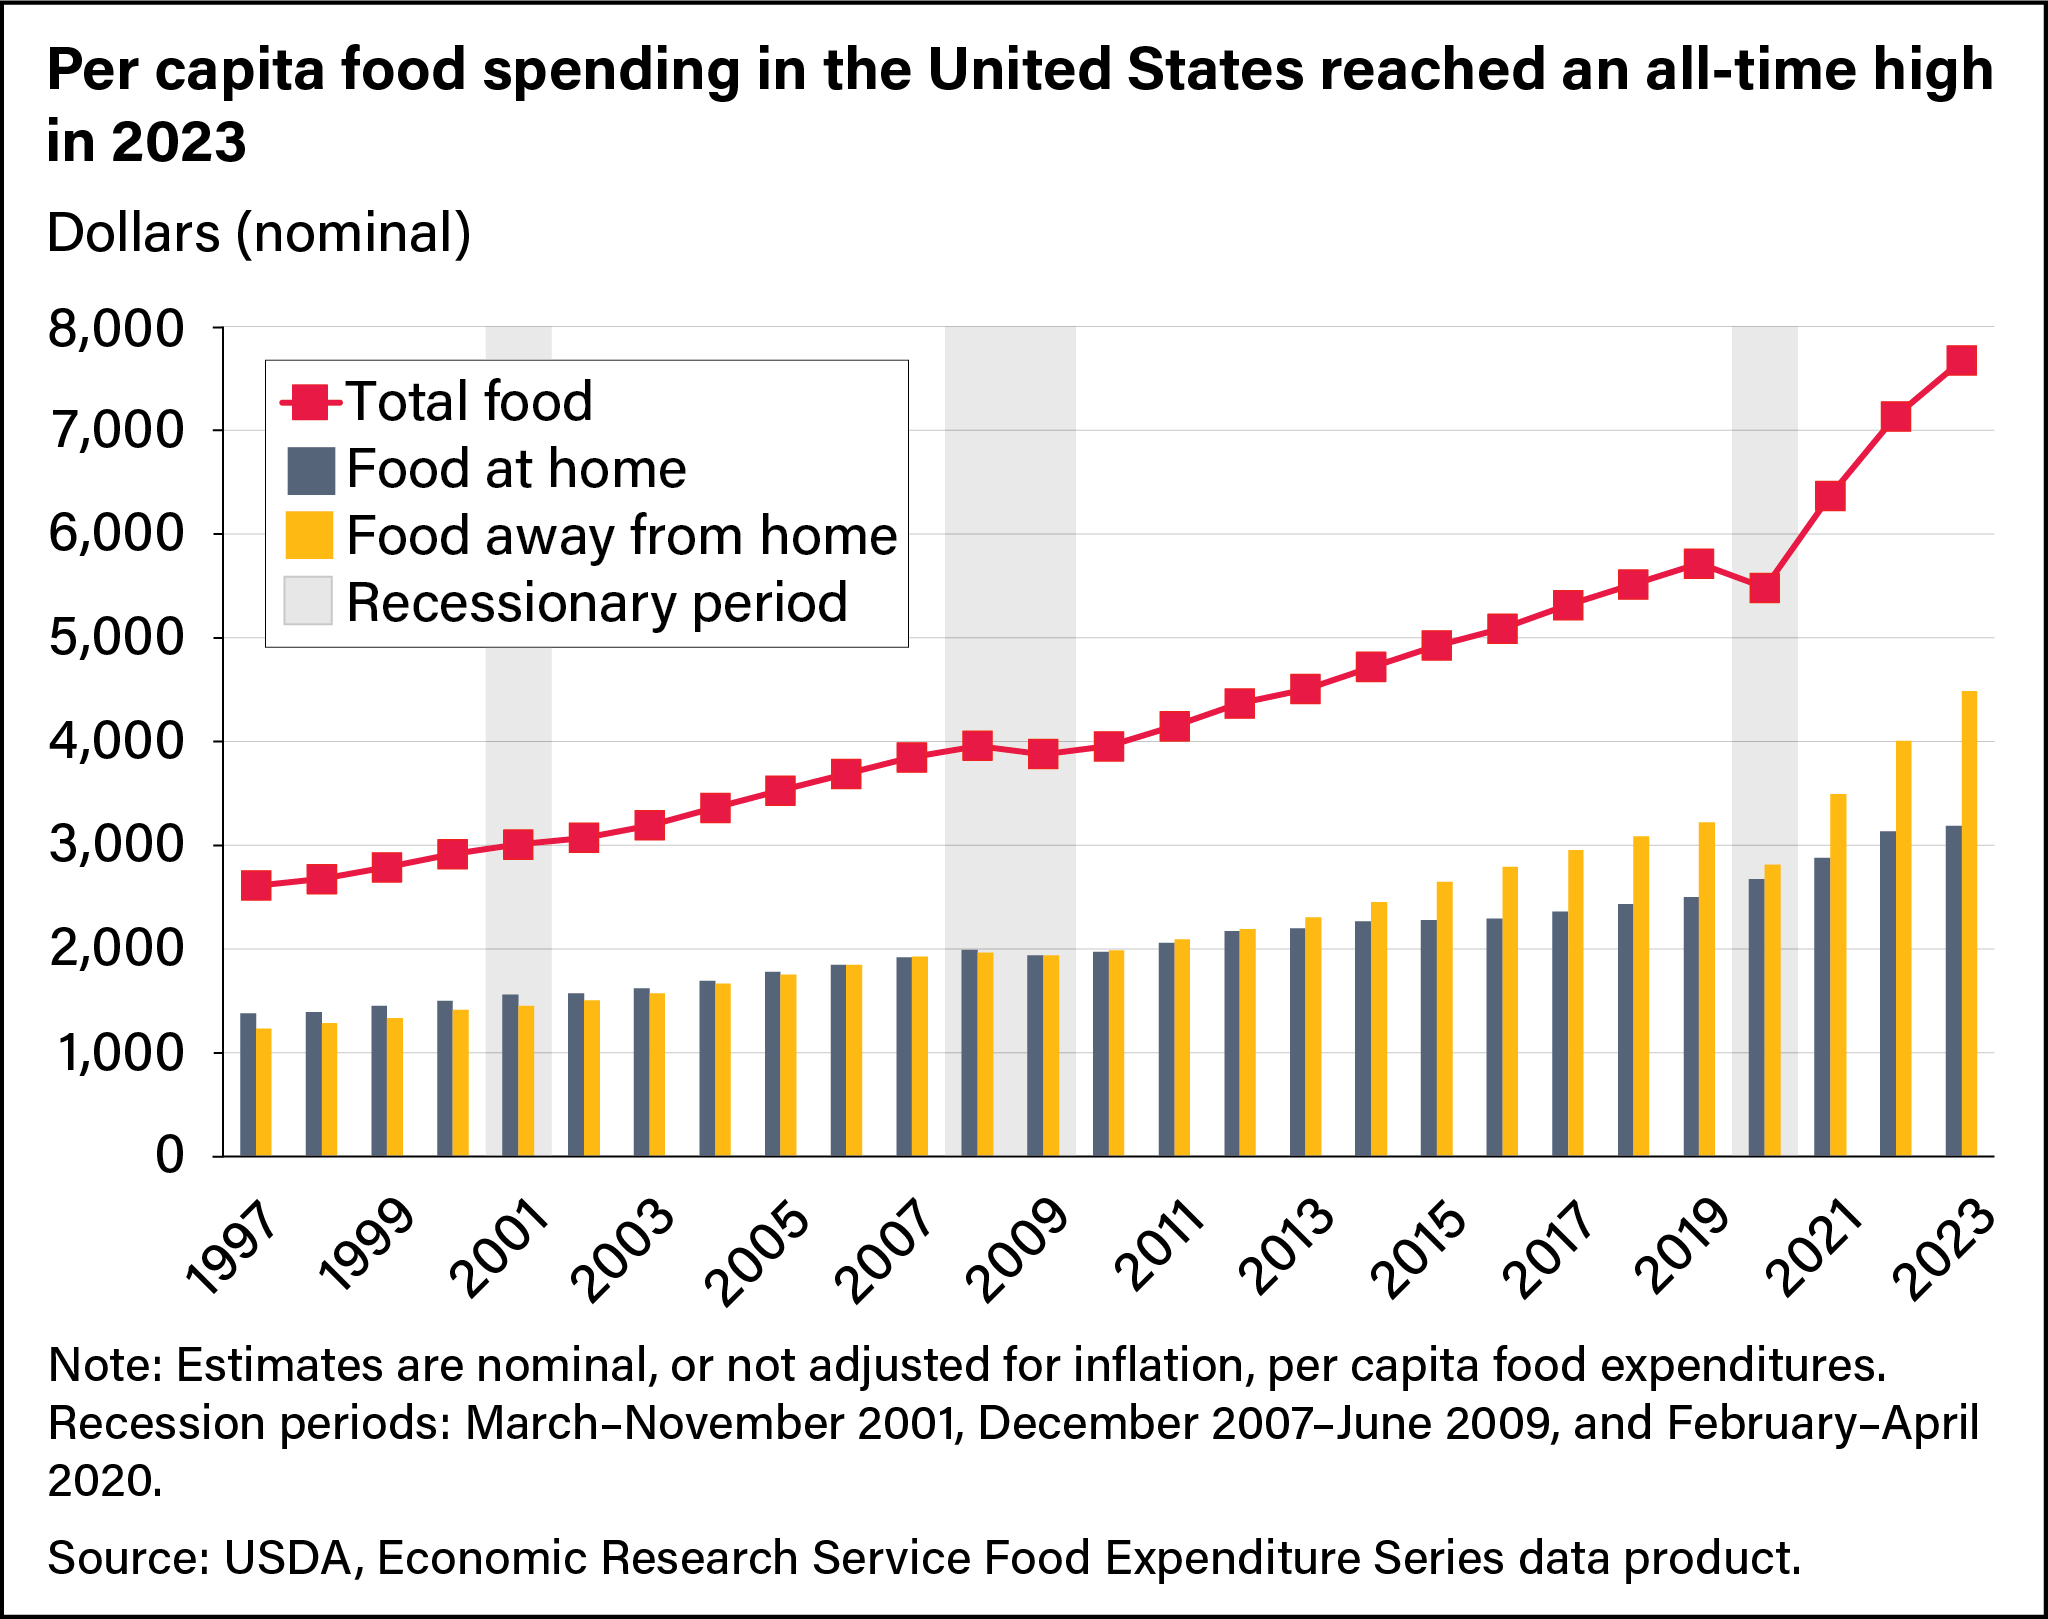
In 2023, food spending by U.S. consumers, businesses, and Government entities reached a high of $2.57 trillion. This translates to $7,672 in spending per person, a 7.5-percent increase from the previous year even as price increases eased up. This rise primarily was fueled by a 12.0-percent increase in spending on food away from home, which grew to $4,485 per capita in 2023 from $4,004 in 2022. At the same time, food-at-home spending rose 1.8 percent to $3,187 per capita from $3,130. The difference between the FAFH and FAH spending growth rates reflects a shift in consumer behavior, as more individuals opted to buy food from restaurants or other eating-out establishments rather than prepare food at home.
FAH and FAFH Spending Shares Continue to Diverge in 2023
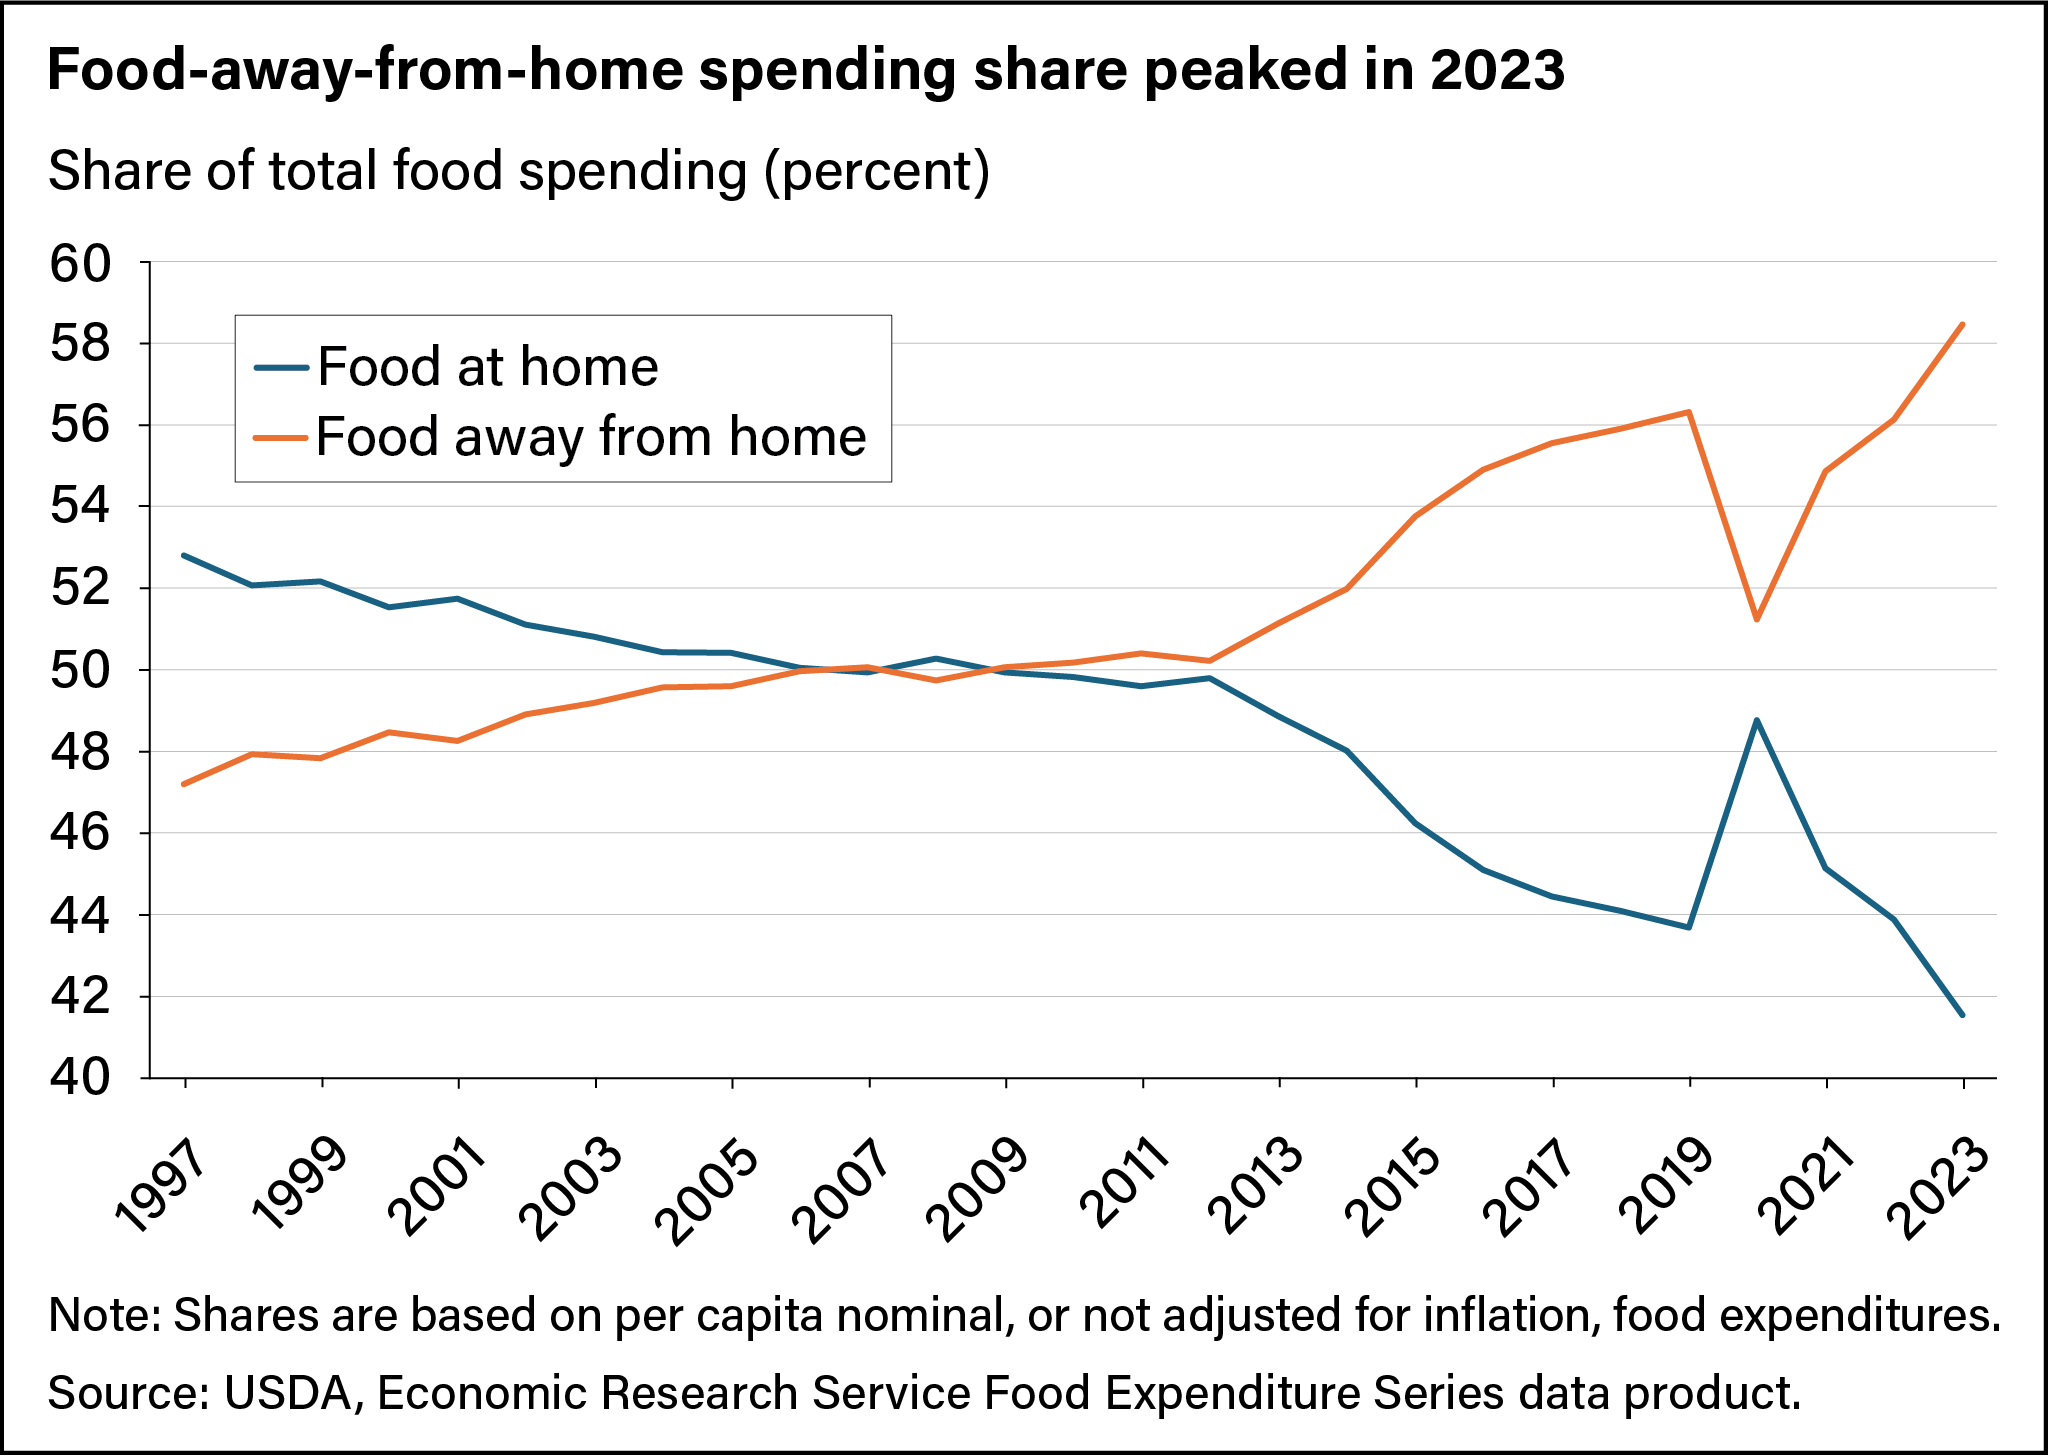
The post-Coronavirus (COVID-19) pandemic shift in consumer behavior toward eating out resulted in the highest share of food spending dedicated to food away from home since the data series began in the 1930s. In 2023, nominal (not adjusted for inflation) spending at FAFH establishments accounted for 58.5 percent of total food spending. The remaining 41.5 percent occurred at food-at-home outlets. The share of food spending is not proportionate to the amount of food purchased because FAFH generally is priced higher than food bought for home preparation. FAFH establishments must pay labor costs for workers to prepare and serve food.
Consumers Spent More Disposable Income on Food as Dining Out Spending Rose
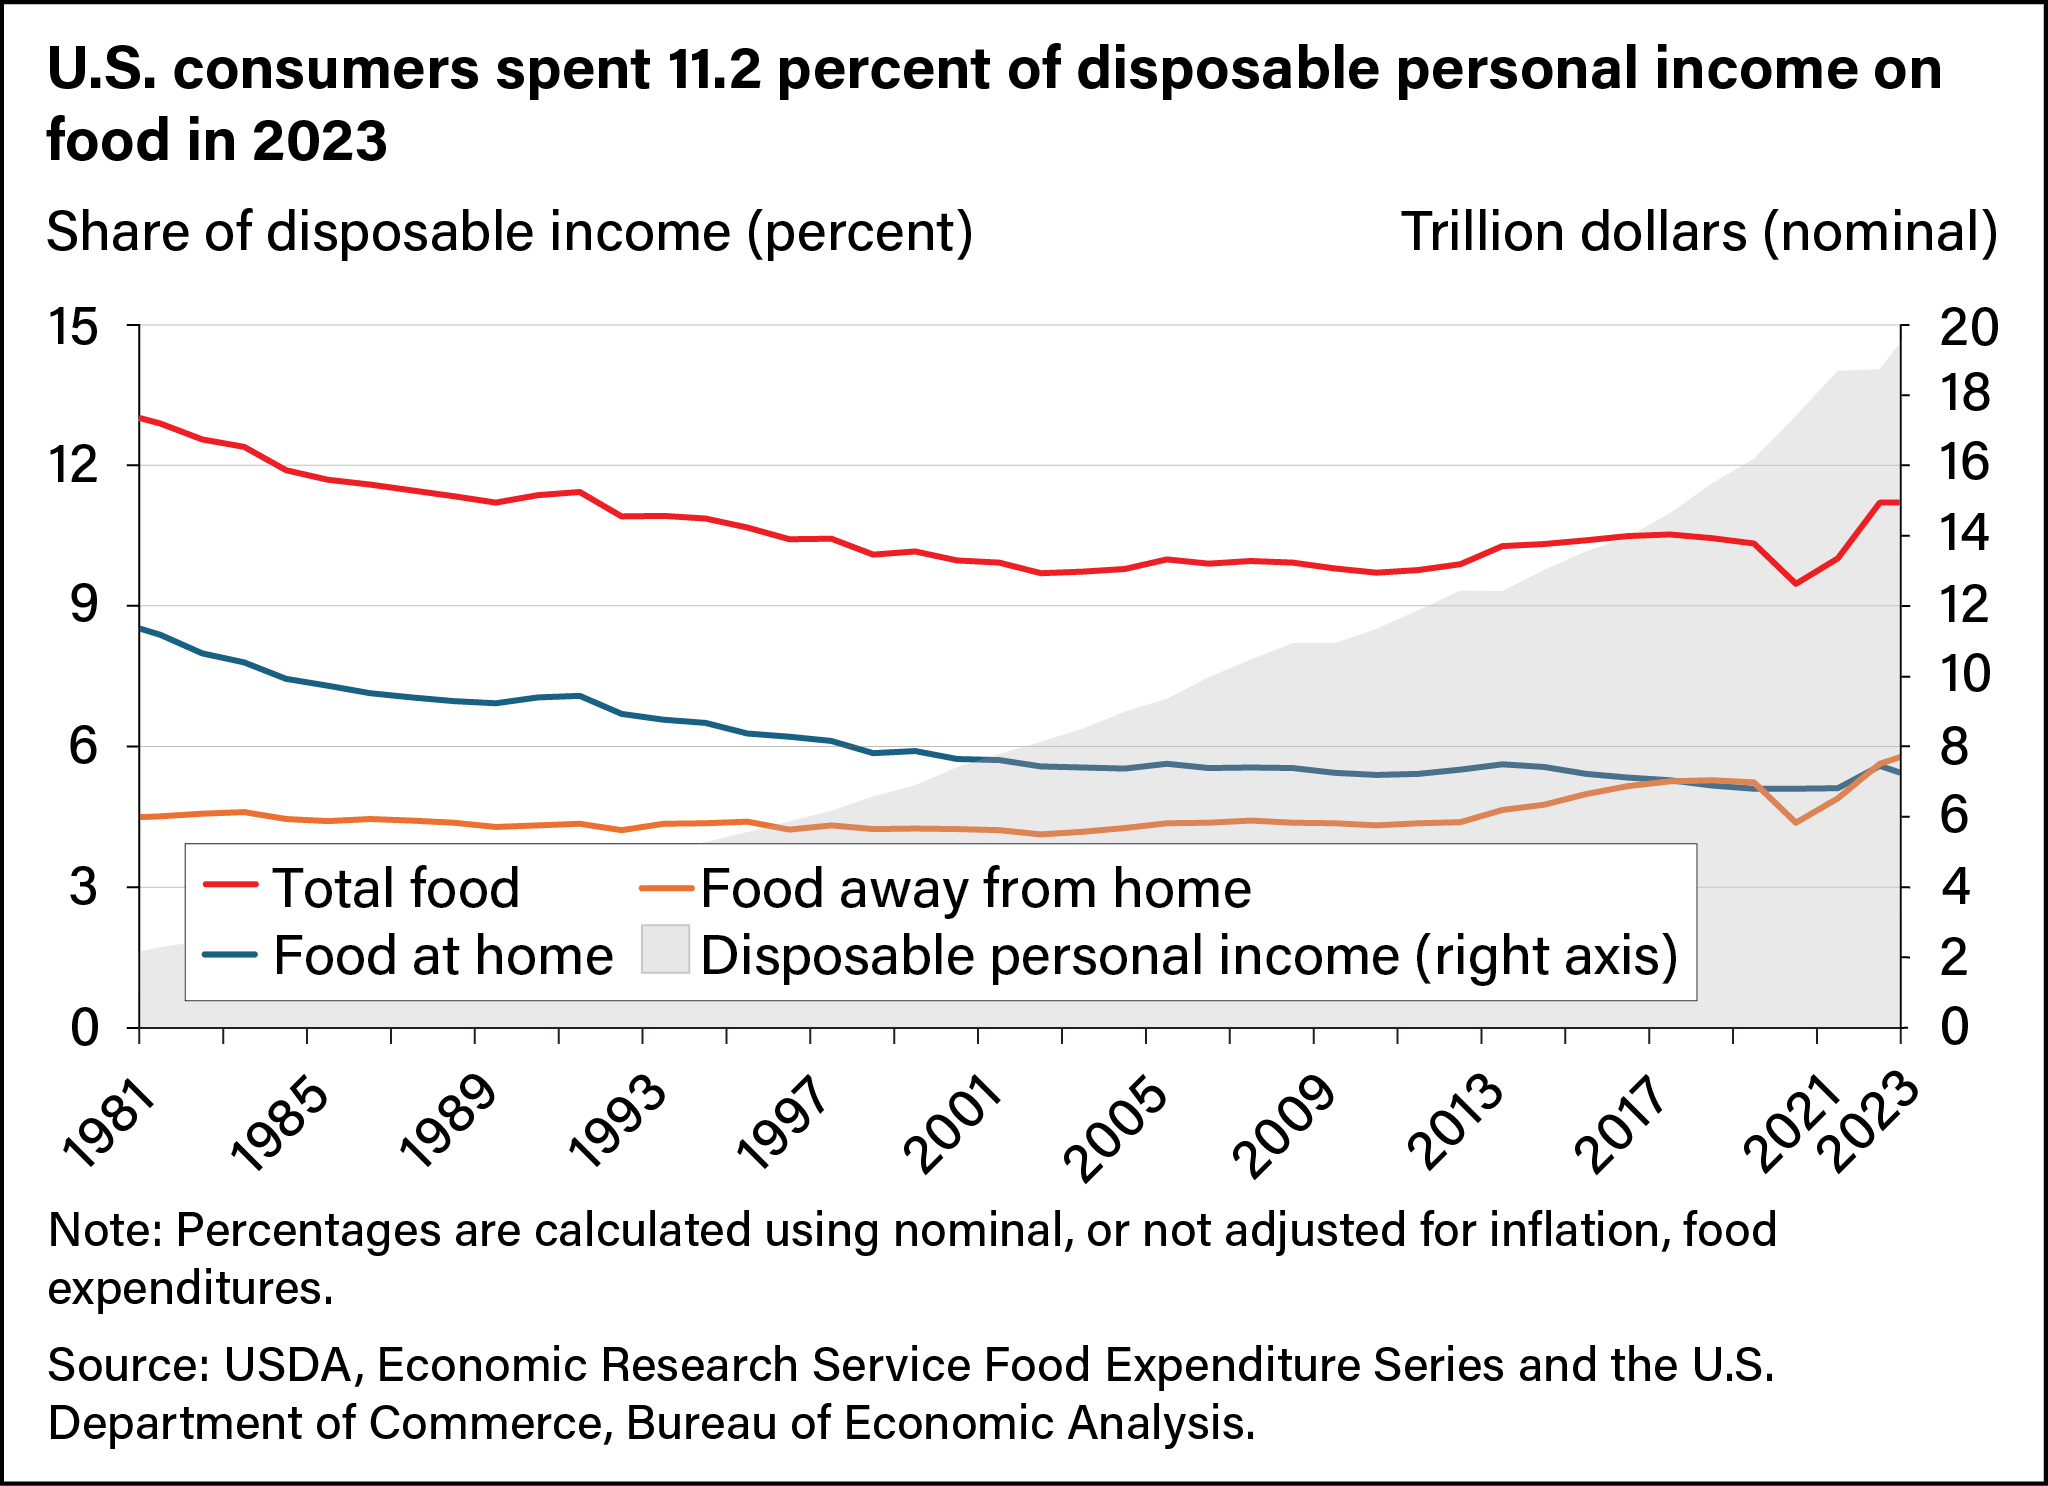
In 2023, U.S. consumers spent an average of 11.2 percent of their disposable personal income on food, the same percentage as 2022. Disposable personal income is the amount of money consumers have left to spend or save after paying taxes. Disposable incomes rose 8.1 percent in 2023. Although the share of disposable income spent on food remained the same as 2022, the share spent on food at home decreased to 5.3 percent from 5.6 percent in 2022, and the share spent on food away from home grew to 5.9 percent from 5.6 percent in 2022. This shift indicates that consumers’ preferences for dining out and buying prepared meals grew as disposable personal income rose in 2023.
Food Spending Growth and Rising Food Prices
Total food prices increased 5.8 percent in 2023 and were predicted to increase 2.2 percent in 2024, according to the ERS Food Price Outlook as of September 2024. These increases are more moderate compared with food price inflation in 2022, which was more than three times the previous 20-year average. Because food is essential to living, overall food spending by consumers expectedly rises as food prices increase. However, households may react and adapt to higher prices differently, which may affect the magnitude of food spending changes. Consumers might buy less food overall, shift to lower cost alternatives, or opt to buy fewer discretionary items.
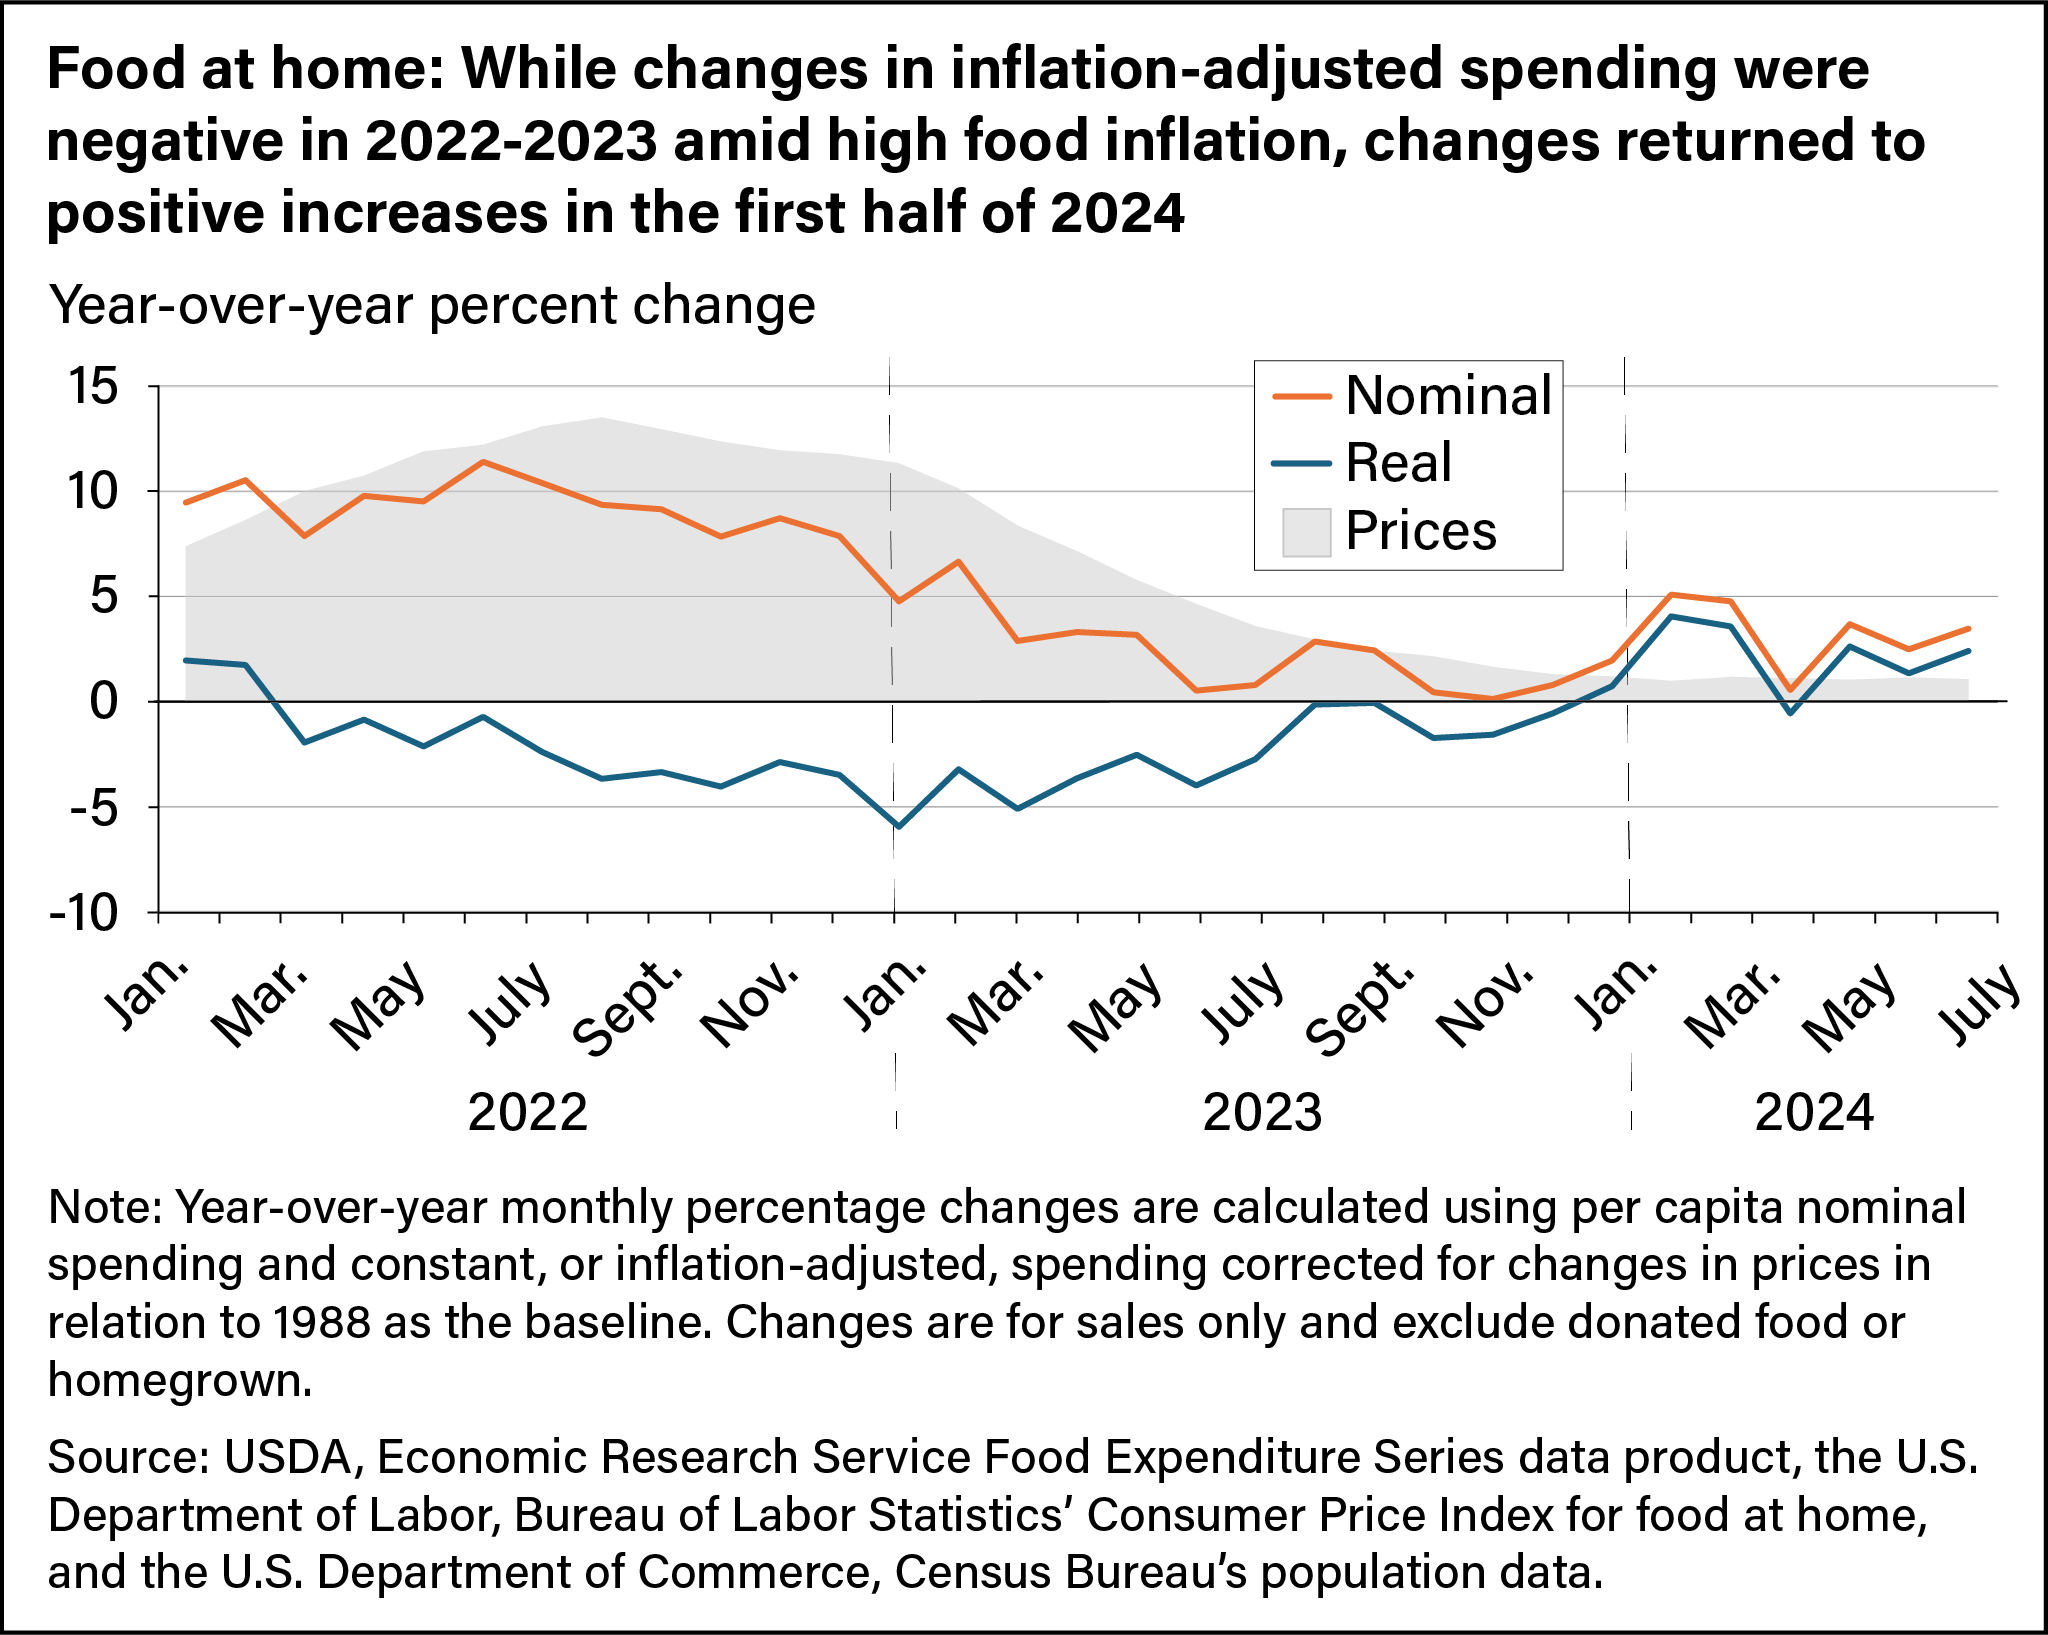
To further examine trends in food prices and food spending, it’s helpful to look at breakdowns of food at home versus food away from home, as well as spending that is adjusted versus not adjusted for price inflation. The average year-over-year changes in monthly prices for food at home (FAH) increased 5.1 percent in 2023, nearly half of the rate in 2022. The nominal (not adjusted for inflation) year-over-year average increase in monthly FAH spending for 2023 was 2.4 percent. However, when adjusted for inflation, FAH spending declined 2.6 percent on average. From January to July of 2024, FAH price growth has moderated to an average of 1.1 percent, while inflation-adjusted monthly FAH spending has shown signs of recovery, averaging a 2.0-percent year-over-year increase.
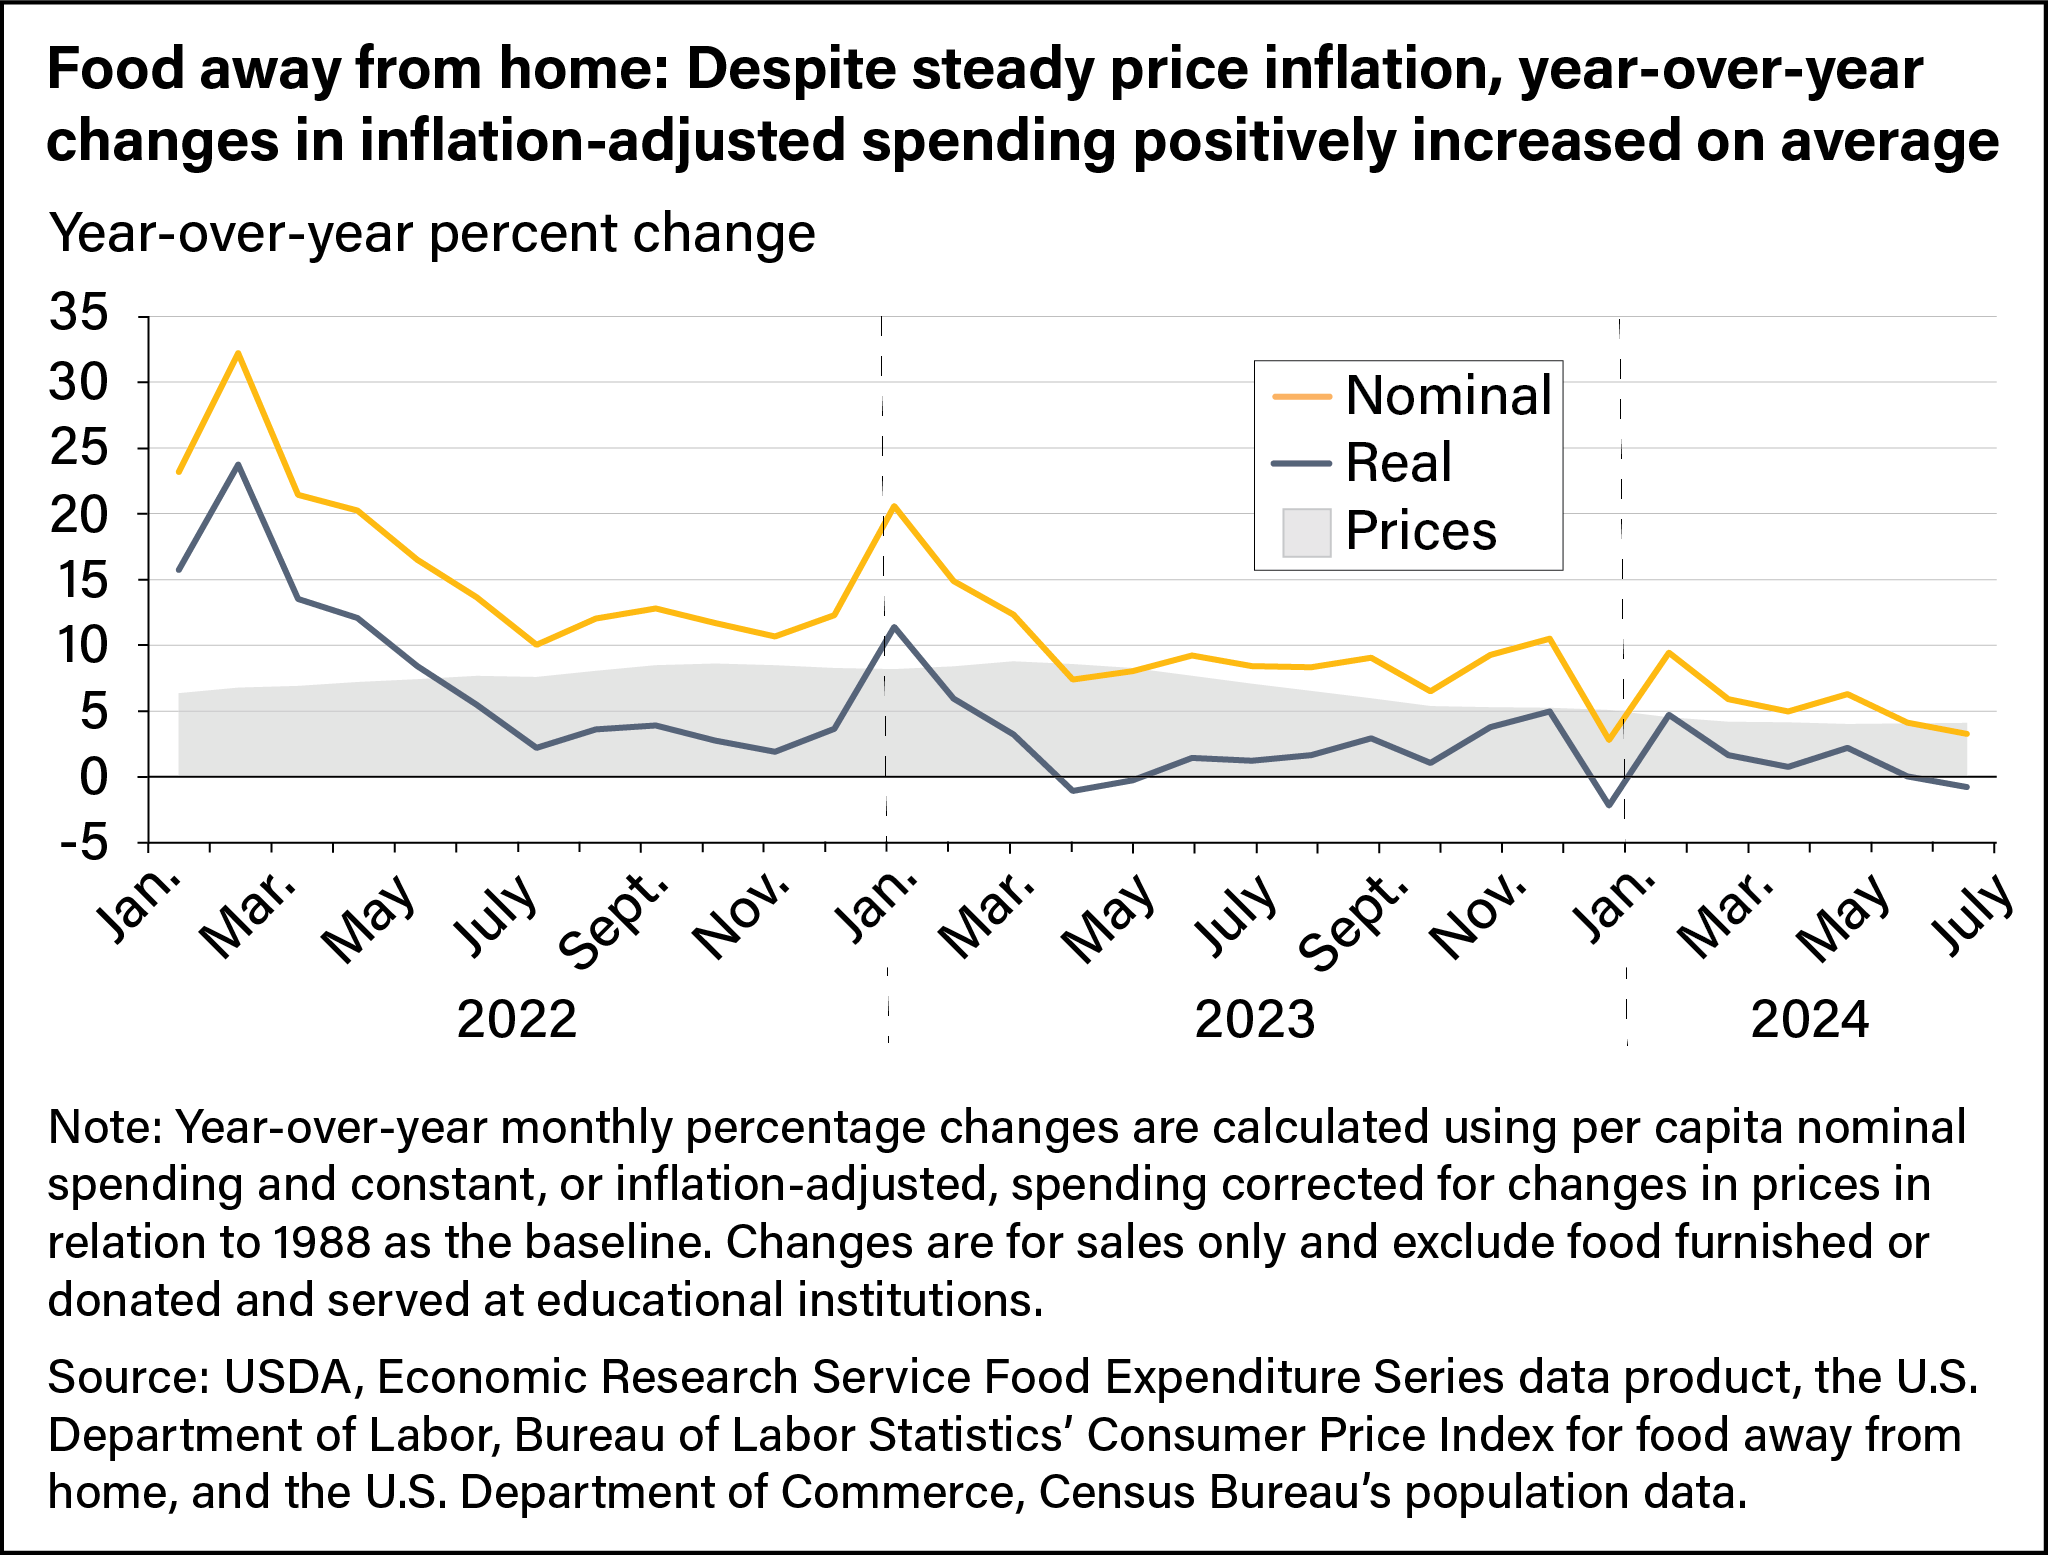
Food-away-from-home prices rose an average of 7.1 percent in 2023, more than the 5.1-percent year-over-year price increase for food at home in 2023. Even so, consumers remained willing to spend more on dining out, reflecting a strong demand for FAFH options. Inflation-adjusted monthly FAFH spending rose an average 3.0 percent in 2023, and from January to July of 2024, inflation-adjusted FAFH spending grew an average of 0.9 percent. FAFH prices in the first 7 months of 2024 rose by 4.3 percent.
This article is drawn from:
- Food Expenditure Series. (n.d.). U.S. Department of Agriculture, Economic Research Service.
You may also like:
- Zeballos , E. & Sinclair, W. (2021, October 4). Food Spending by U.S. Consumers Fell Almost 8 Percent in 2020. Amber Waves, U.S. Department of Agriculture, Economic Research Service.
- Zeballos , E. & Sinclair, W. (2023, September 25). U.S. Consumers Spent More on Food in 2022 Than Ever Before, Even After Adjusting for Inflation. Amber Waves, U.S. Department of Agriculture, Economic Research Service.


