ERS Data Series Tracks Major Uses of U.S. Land With a Focus on Agriculture
- by Clayton P. Winters-Michaud
- 12/30/2024
The USDA, Economic Research Service (ERS) Major Land Uses series is the longest running, most comprehensive accounting of all major uses of public and private land in the United States. The series was started in 1945 and has been published about every 5 years, using data from a variety of sources. The current release in September 2024 covers the period from 1945 to 2017—the most recent year for which complete data are available—and provides a consistent resource for aggregate statistics over time. These data can be used to provide a snapshot of current land uses as well as benchmarks for trends in land use over time.
Most U.S. Acres Used for Grassland Pasture/Range, Forest, and Crops
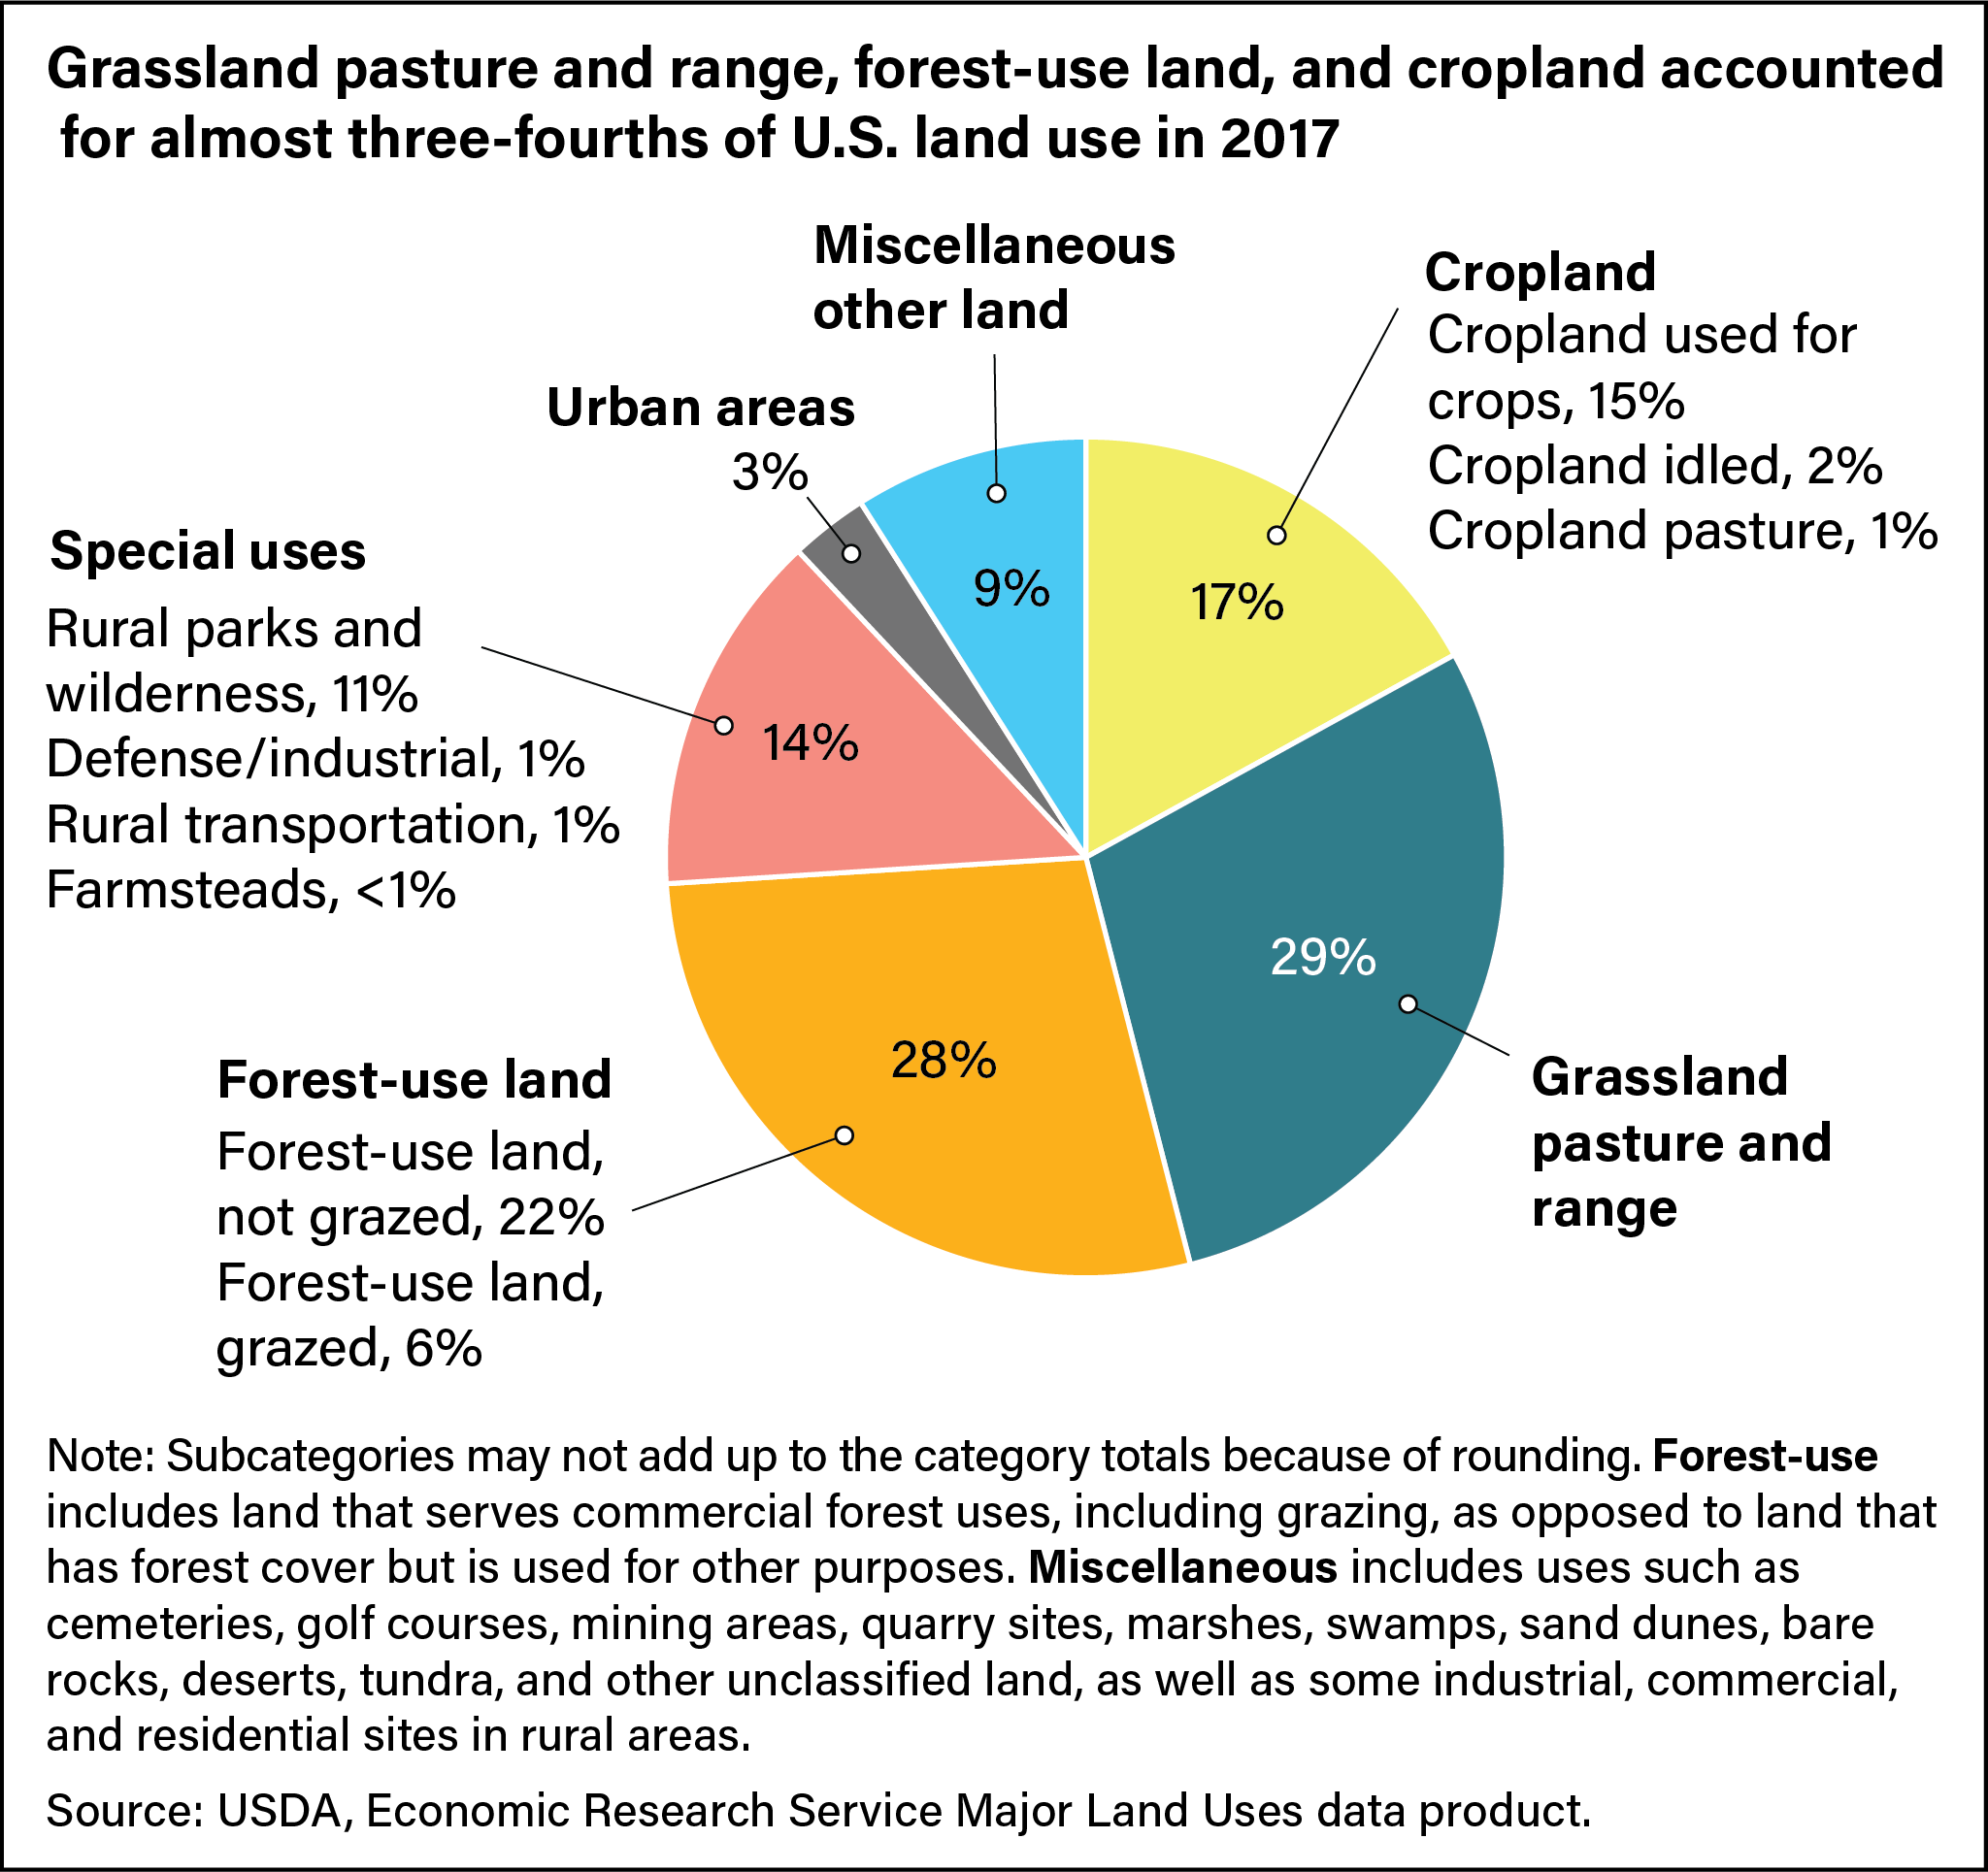
The United States has a total land area of 2.26 billion acres, mostly in grassland pasture and range, forest use, and cropland. In 2017, about 29 percent of the U.S. land area was grassland pasture and range, 28 percent was forest-use land, and 17 percent was cropland (see chart below). Urban areas accounted for 3 percent of U.S. land. Land for special uses, including parks, wildlife refuges, wilderness areas, rural transportation corridors, and national defense areas, accounted for 14 percent. Miscellaneous other land uses made up the remaining 9 percent. These shares change, though, if Alaska land area is not included in the calculations. Compared with the rest of the Nation, Alaska has small amounts of cropland and pasture and large areas of special-use and miscellaneous other land. The full set of historical estimates and summary tables for 2017, by region and State, is available in the ERS Major Land Uses data product.
About Two-Thirds of U.S. Agricultural Land Used for Grazing Livestock
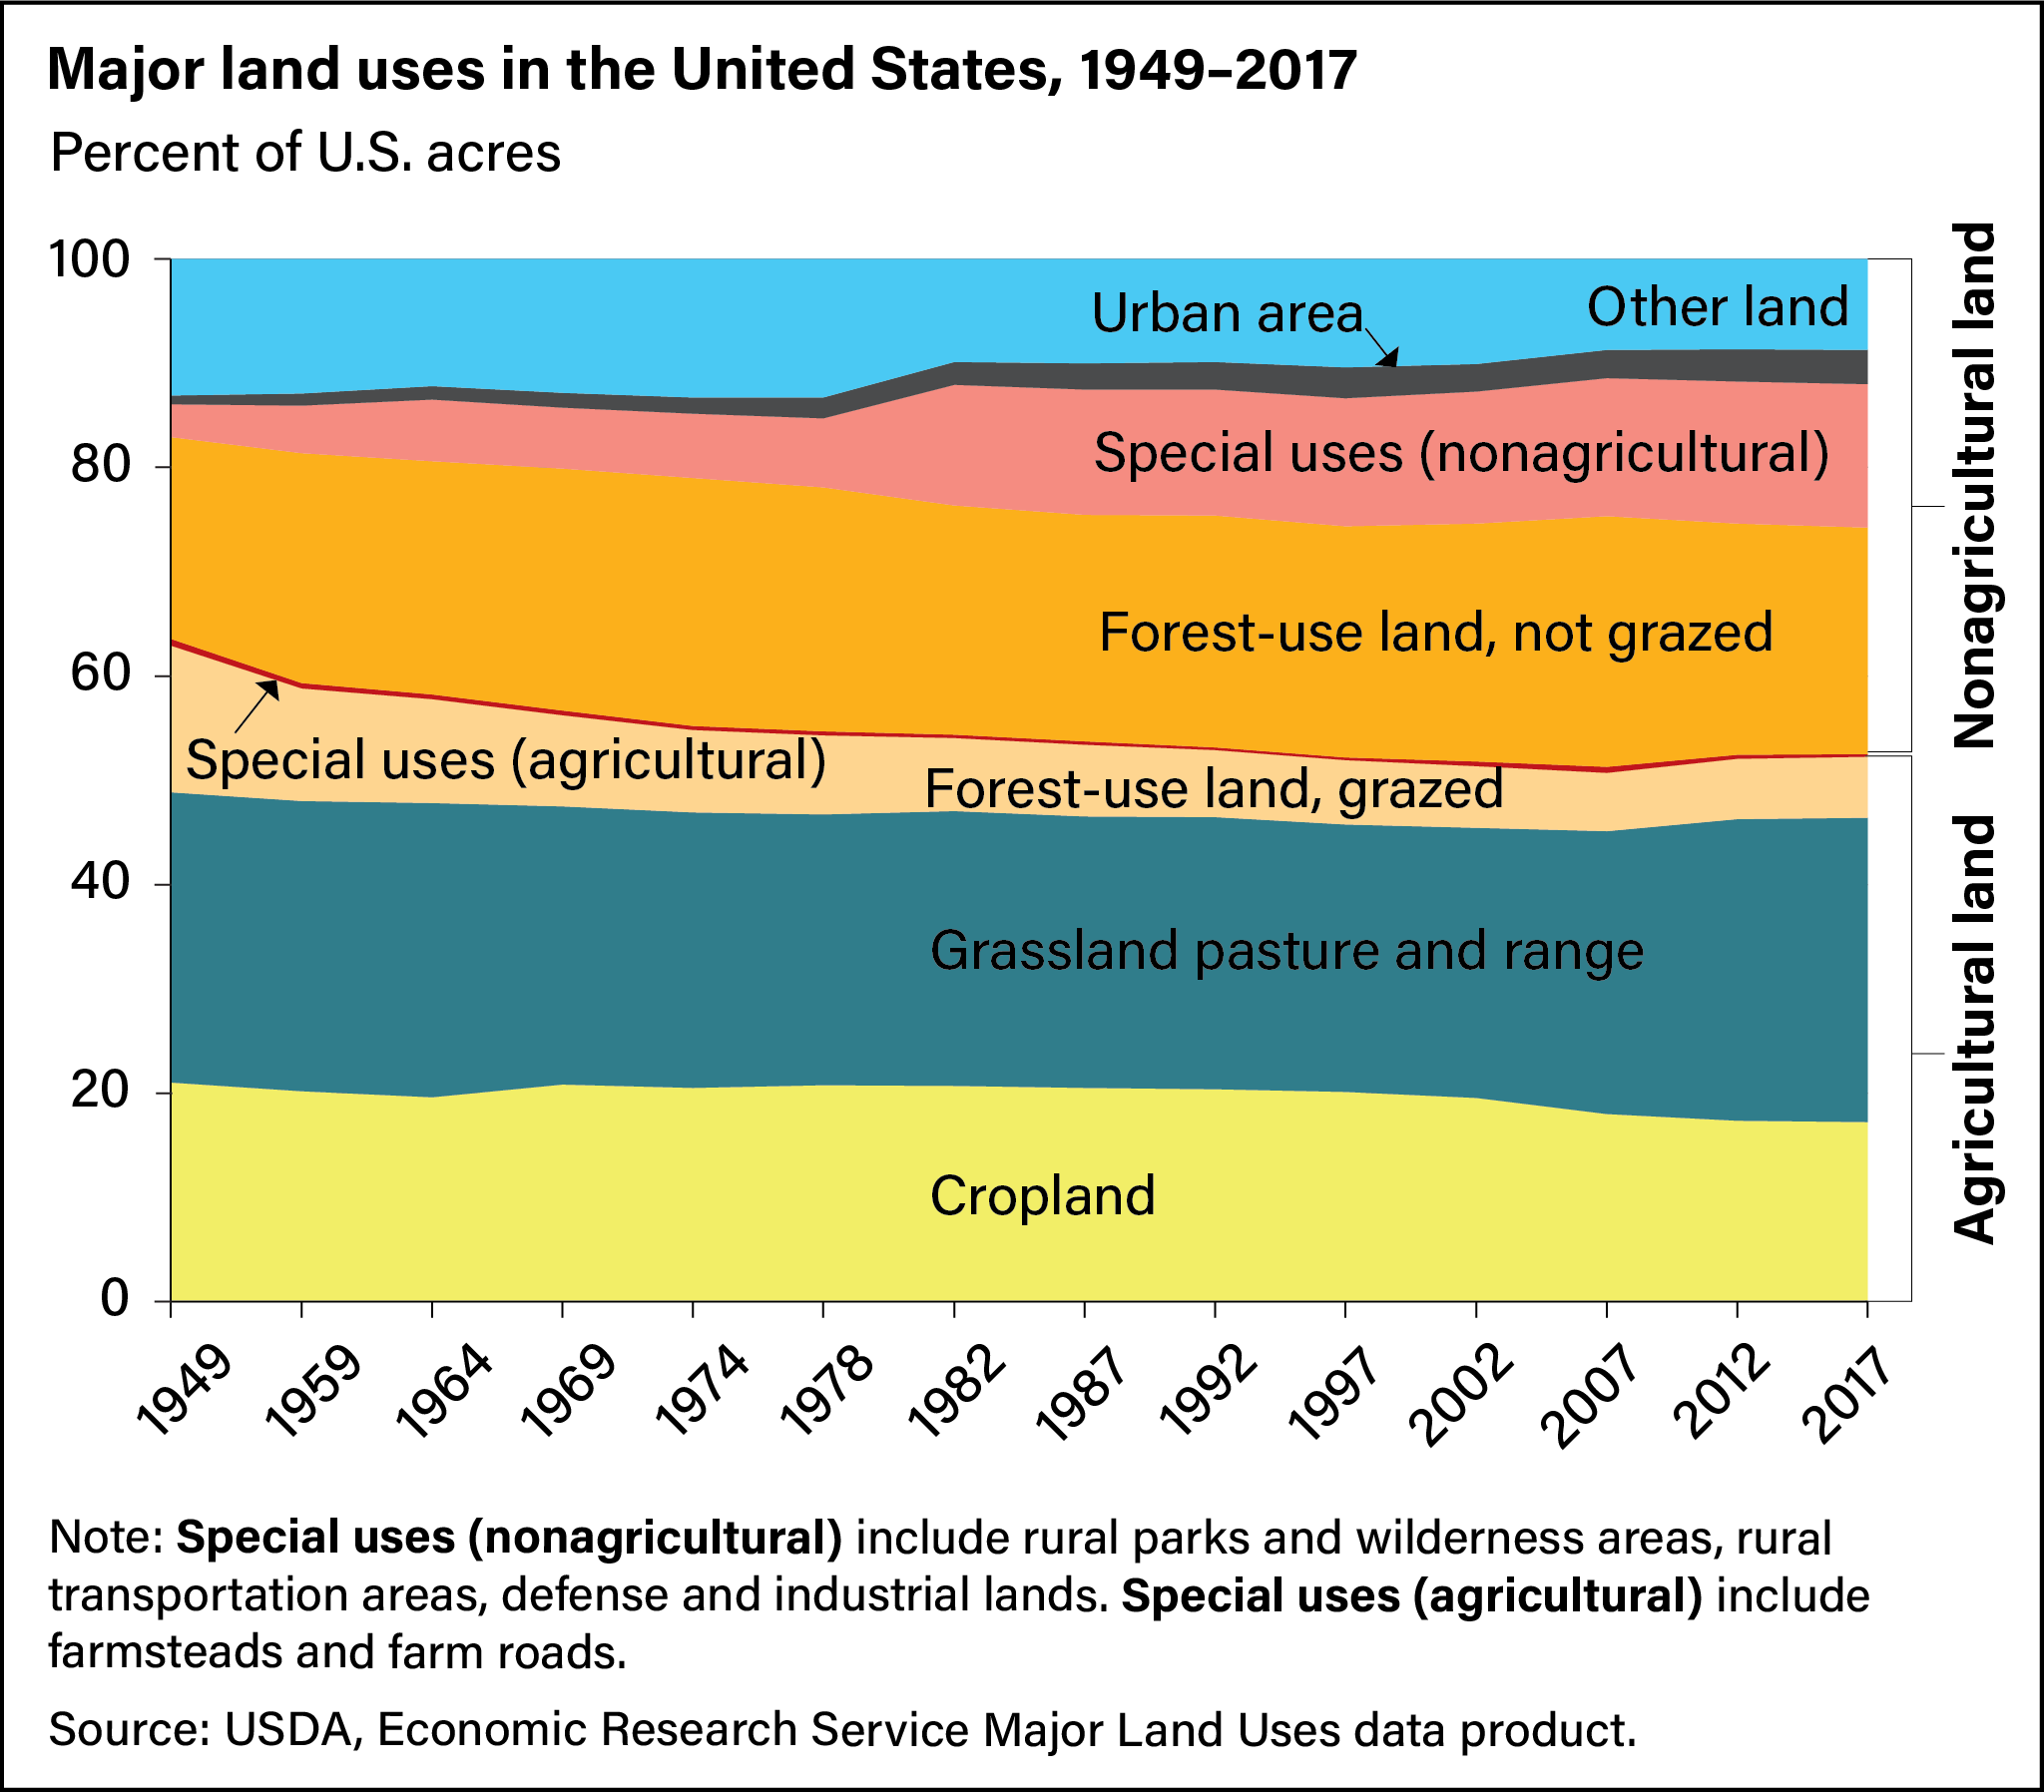
In 2017, land used for agricultural purposes totaled 1.19 billion acres, or 52.5 percent of total U.S. land area. Agricultural land falls into three categories:
- Grazing land. This category accounted for 805 million acres in 2017, or 35.6 percent of total U.S. land. It includes grassland pasture and range; cropland used for pasture; and grazed forest-use land.
- Cropland used for crops and idle cropland. This category accounted for 377 million acres in 2017, or 16.7 percent of total U.S. land. When cropland pasture is included, total cropland accounted for 390 million acres, or 17.3 percent of total U.S. land.
- Agricultural special uses. This category accounted for 6 million acres in 2017, or 0.3 percent of total U.S. land. It includes land in farmsteads and farm roads.
Livestock grazing was the primary use of an estimated 659 million acres of grassland pasture and range in 2017, accounting for 29 percent of all U.S. land and more than half of all agricultural land (55 percent). Livestock also graze on cropland pasture (13 million acres) and forested grazing land (132 million acres). Total grazing land (including Federal lands leased for grazing) accounted for about two-thirds of all agricultural land.
Nonagricultural land made up the remaining 47.5 percent of all U.S. land in 2017 and includes land in urban areas as well as national parks, rural roads, and other miscellaneous land. Forest land that is not grazed and not considered special-use, such as national and State parks, amounted to 490 million acres, nearly half of all nonagricultural land in 2017. Nonagricultural special-use areas totaled 312 million acres or about 14 percent of the U.S. land area. Of this amount, national and State parks, wildlife refuges, and related lands occupied 258 million acres or 11 percent of the total U.S. land base. In the same category, rural transportation land such as roads, railways, and airports accounted for 26 million acres, and defense and industrial areas accounted for 28 million acres.
About 74 million acres were classified as urban land. Urban land accounted for 3 percent of total U.S. land area and just under 4 percent of the land area of the contiguous 48 States. The remaining 197 million acres (9 percent) of the U.S. land area included various miscellaneous other land use that could not be separately inventoried. This land includes tundra, deserts, bare rock areas, snow and ice fields, swamps, marshes, and other areas not independently categorized in the Major Land Uses series, such as wetlands and some rural residential housing.
Land-Use Patterns Vary Across U.S. Regions
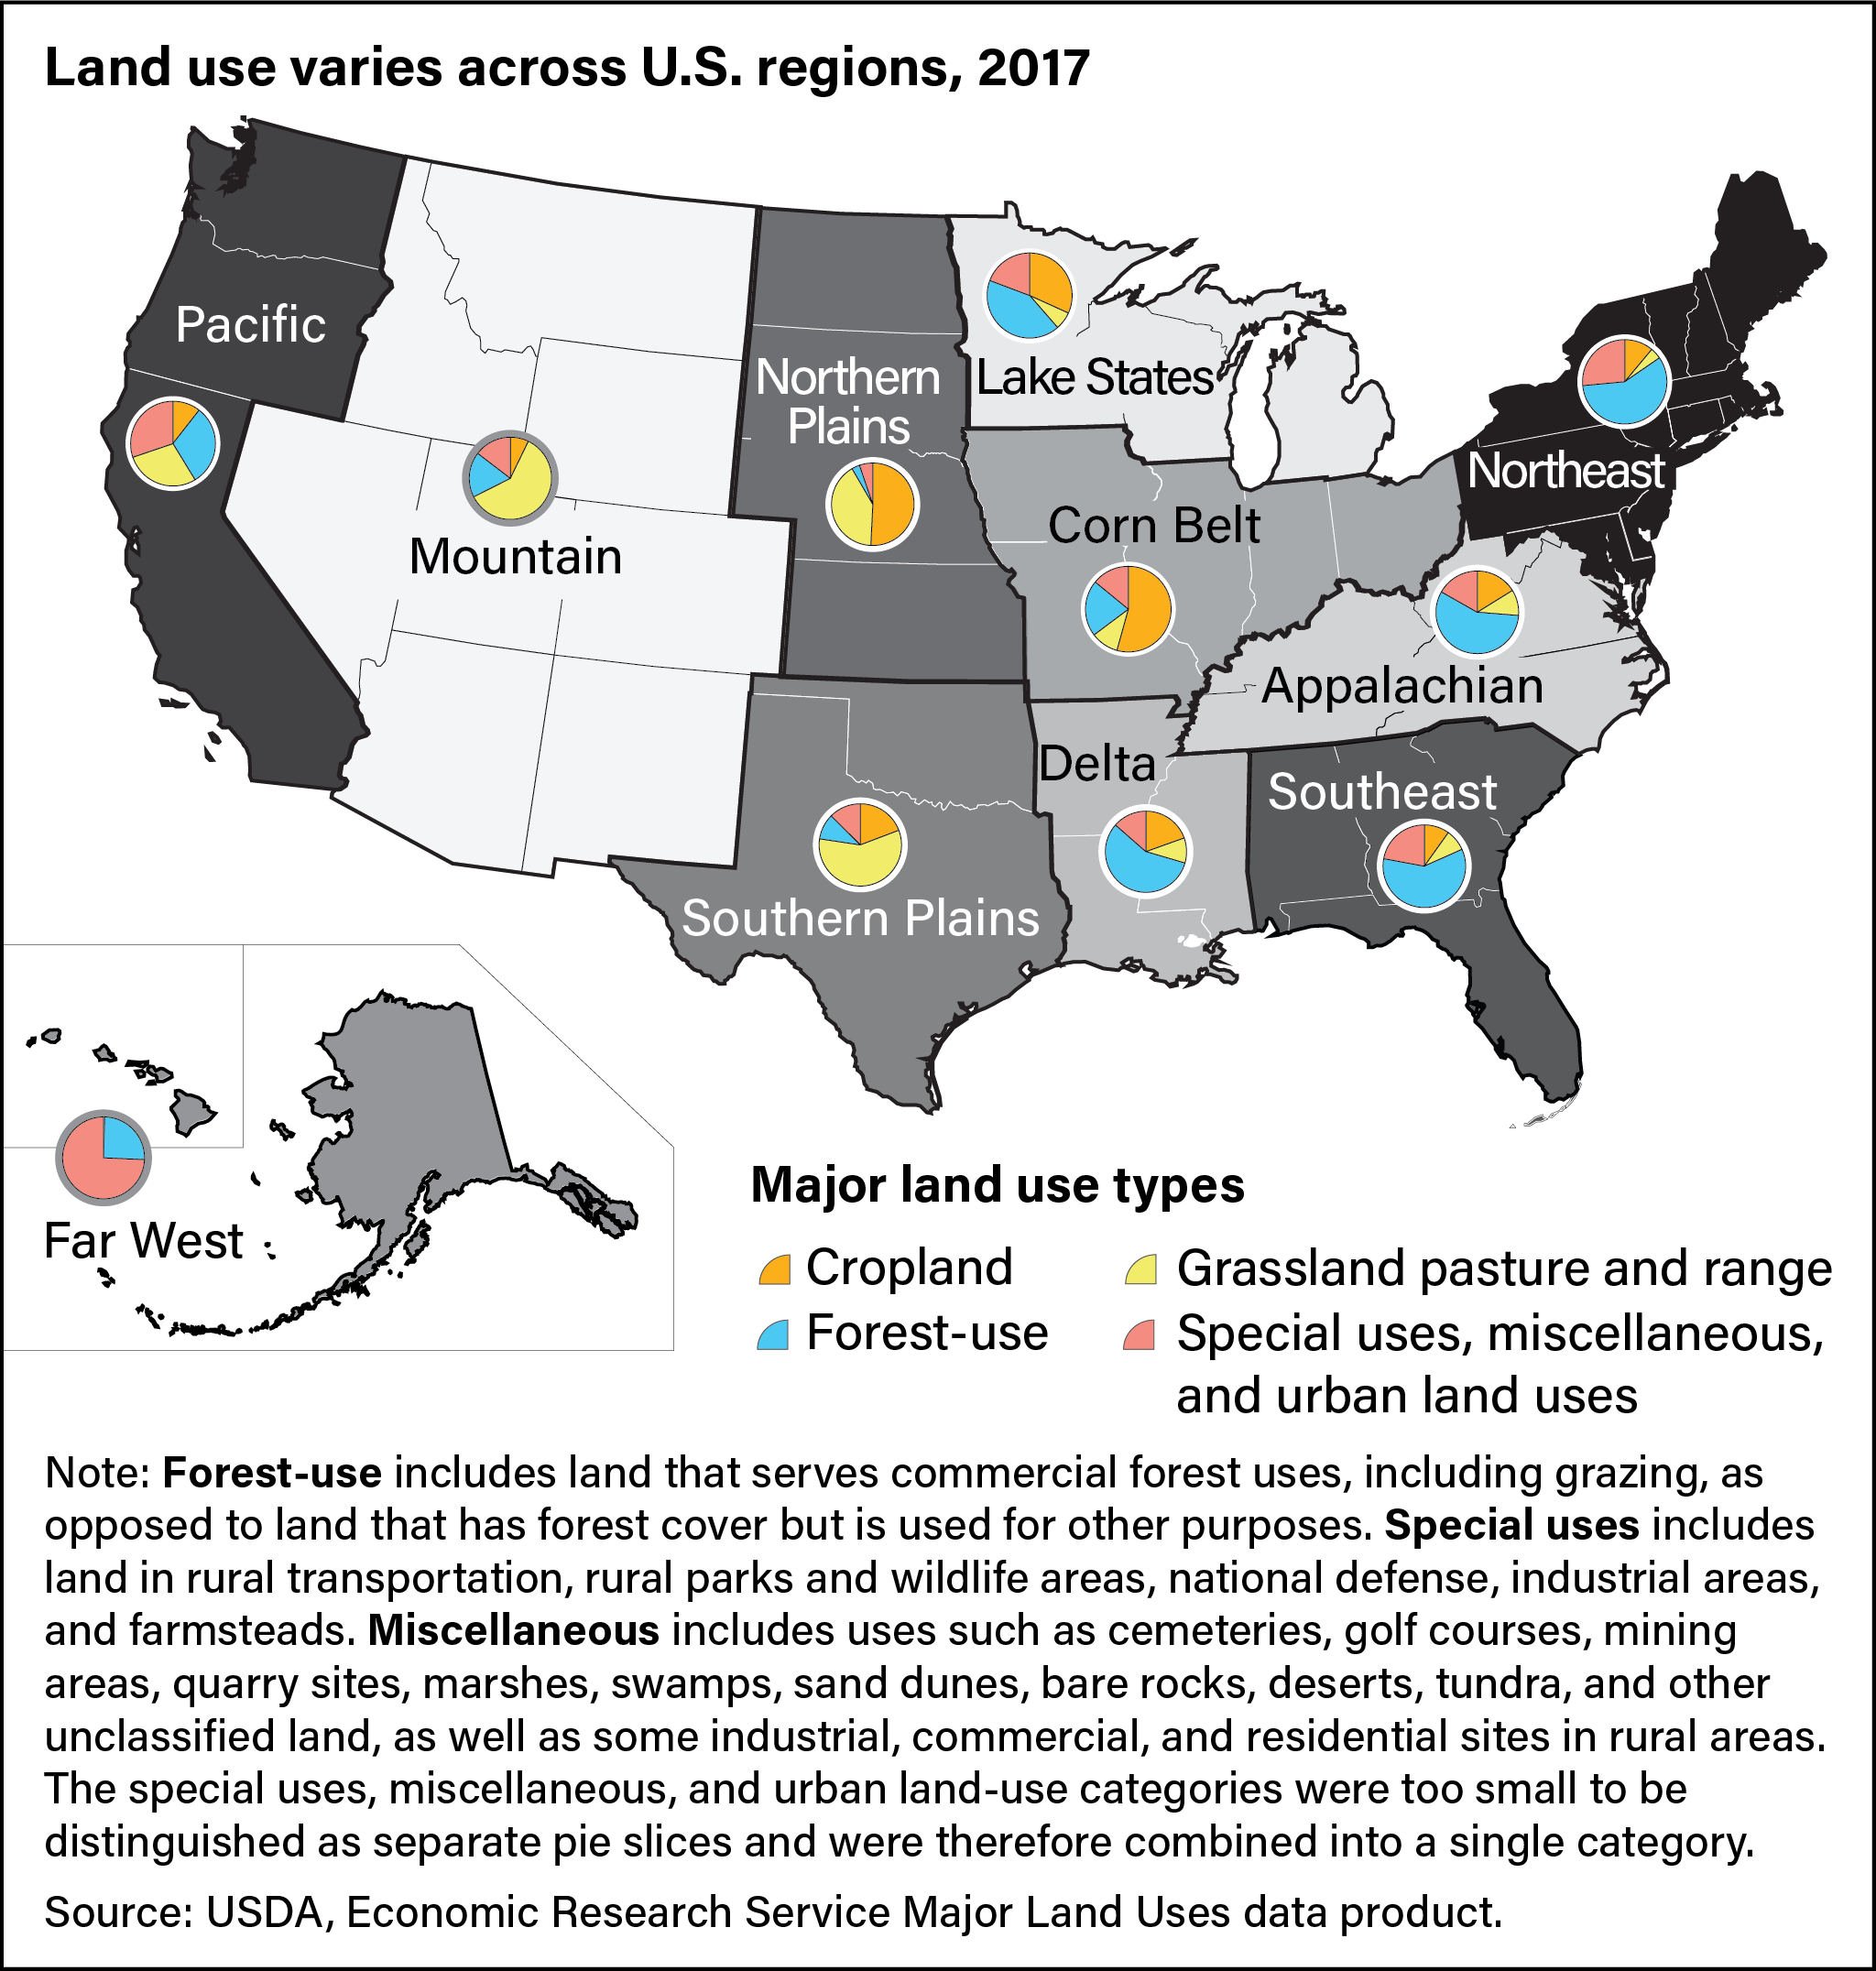
Land-use patterns vary widely across the United States—reflecting differences in soil, climate, topography, and general economic activity. Cropland is largely concentrated in the central regions of the contiguous United States. The majority of land in the Northern Plains (51 percent) and Corn Belt (54 percent) is cropland. Shares of cropland in the Southern Plains, Lake States, and Delta States regions are also above the national average at roughly 19 percent, 32 percent, and 20 percent, respectively. Grassland pasture and range are concentrated in the Mountain and Southern Plains regions, where they account for more than half of the land at roughly 60 percent and 58 percent, respectively. The Northern Plains and Pacific regions also have relatively high shares of grassland pasture and range acreage, with 41 and 31 percent of their land area, respectively, allocated to this use. Forest-use land is most prevalent in eastern regions—specifically the Northeast, Appalachian, Southeast, and Delta States—where the majority of land is in forest uses. However, in terms of total acreage, most forest-use land is in Alaska (92 million acres) and the Mountain region (97 million acres). Special-use land, most of which is devoted to rural parks and wilderness areas, is largely concentrated in Alaska and the Mountain and Pacific regions. The Northeast and Southeast regions have the highest relative areas devoted to urban uses, and the Lake States, Corn Belt, Appalachian, Pacific, and Southern Plains regions also have urban-use shares above the national average.
Acres Used for Cropland Declined Since 1949
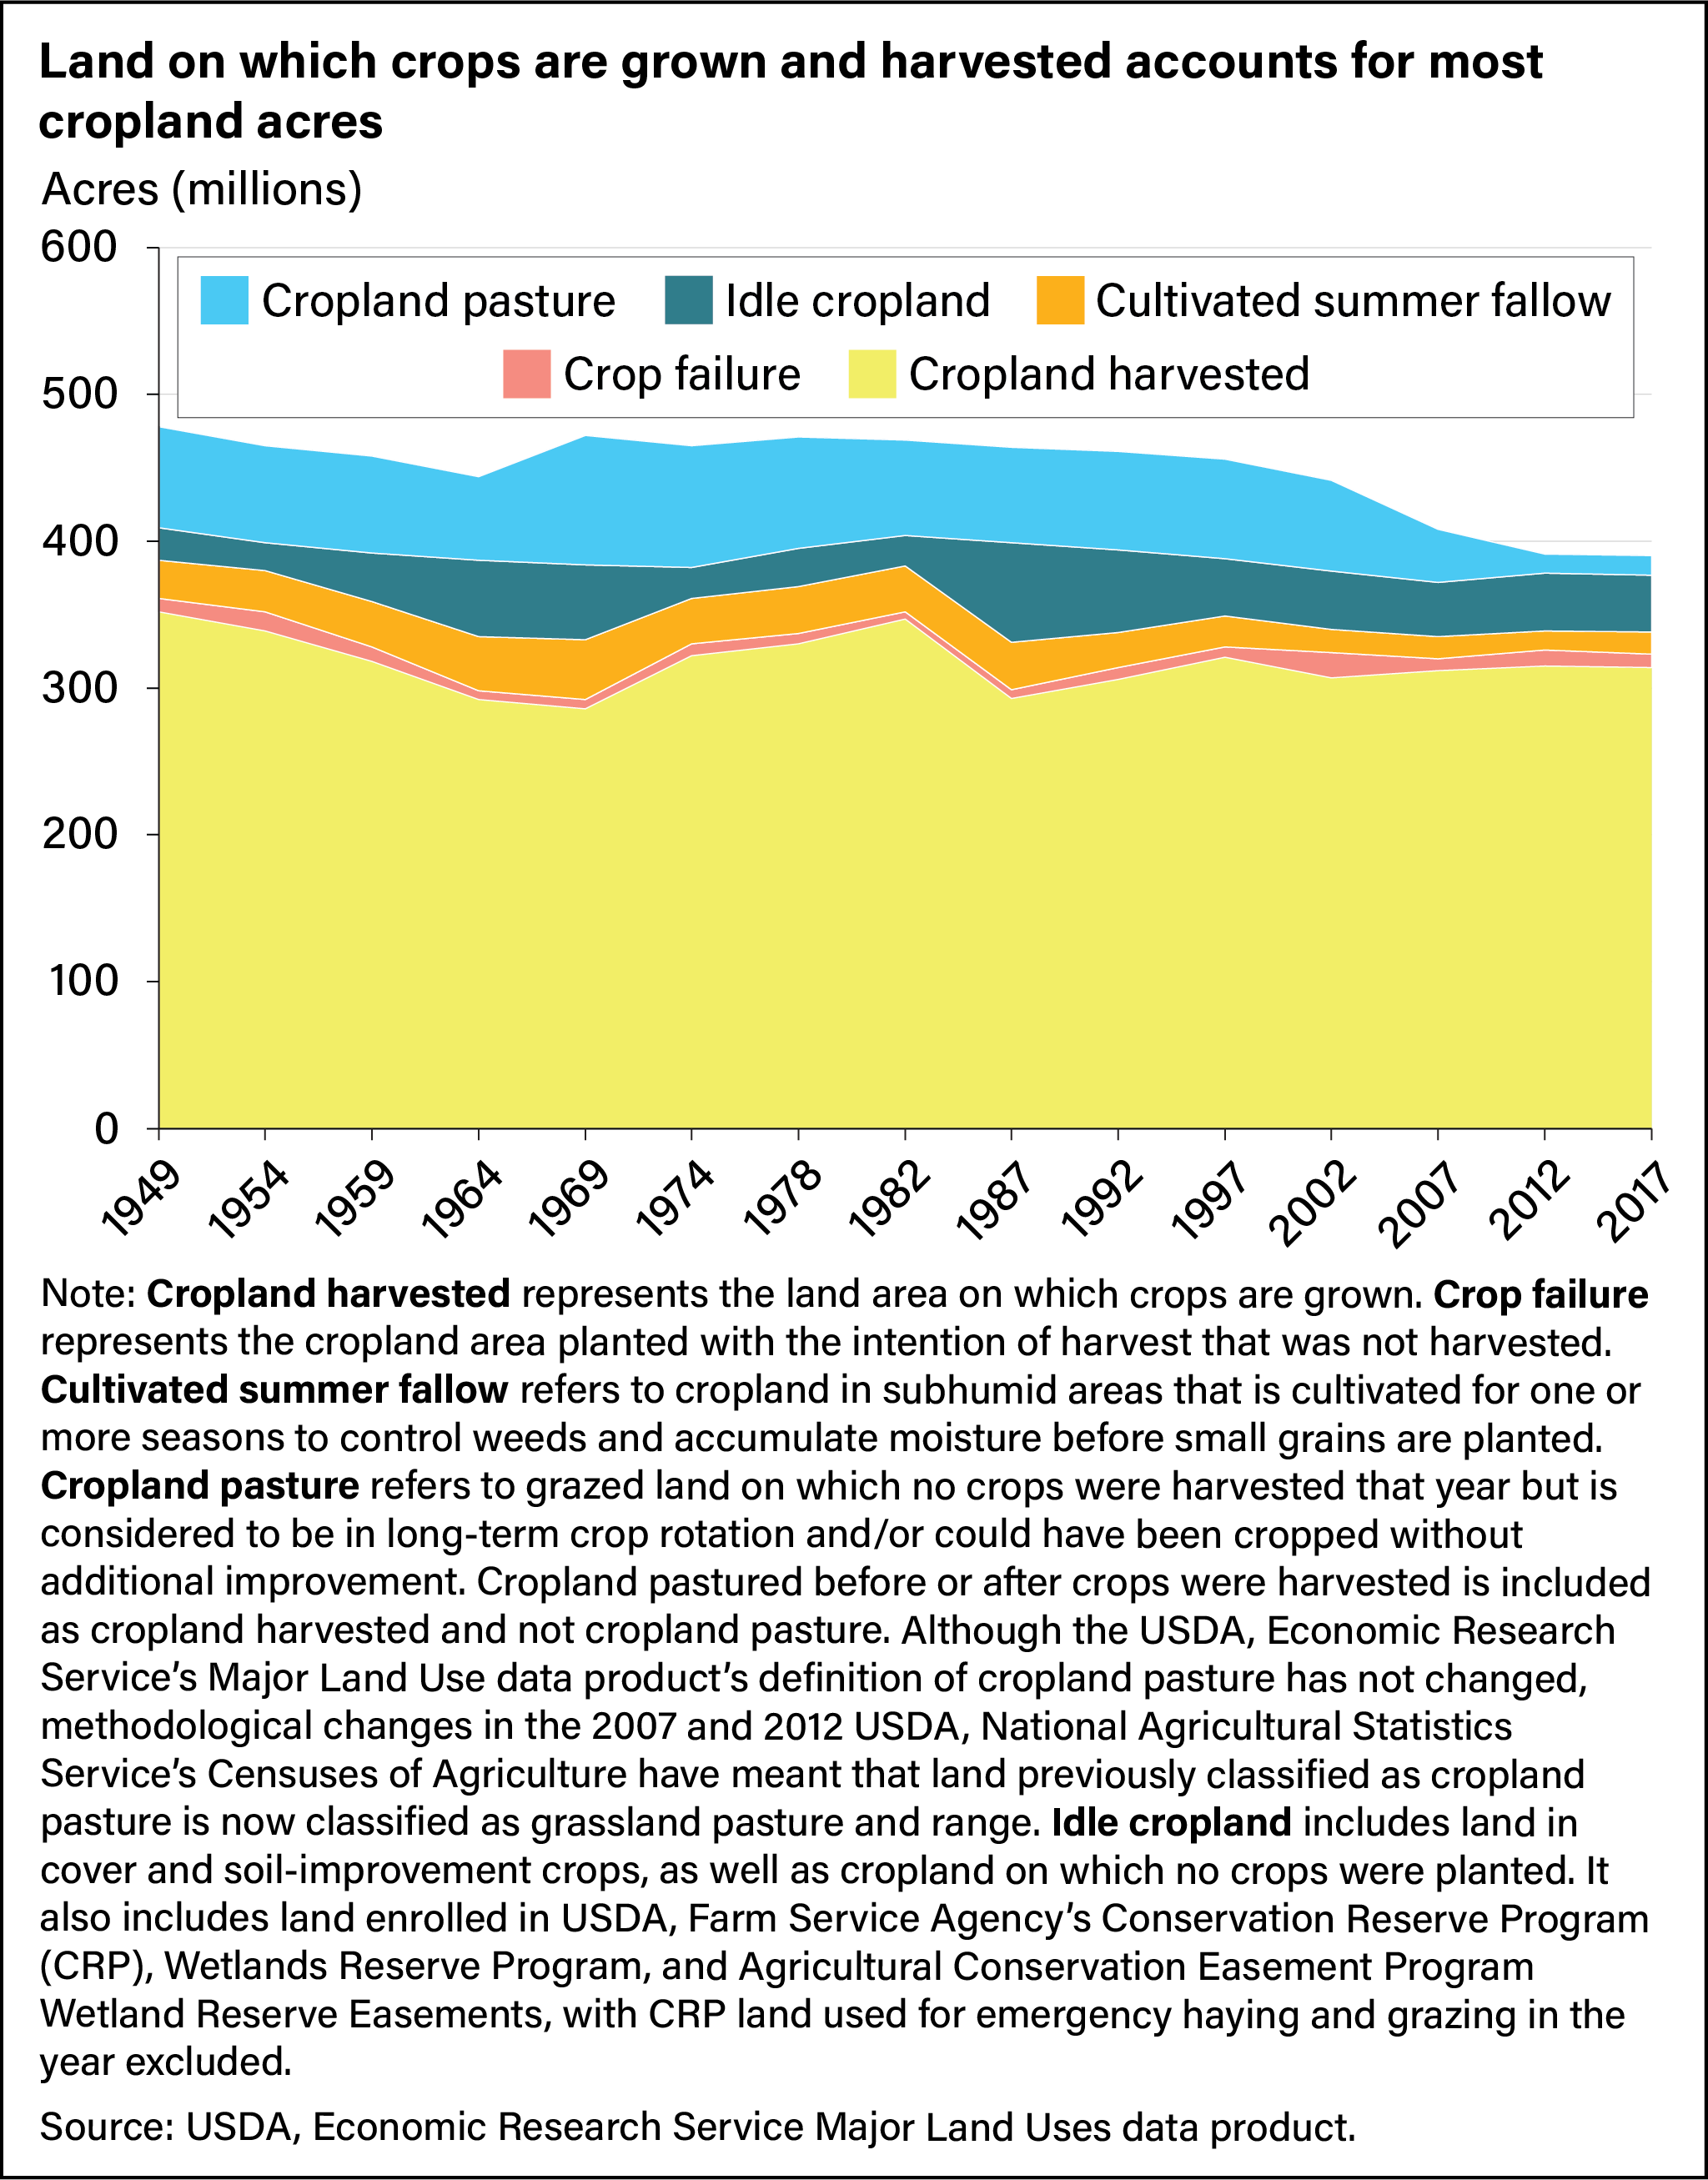
Cropland totaled about 390 million acres in 2017 and represented all land in crop rotation, including cropland pasture. Cropland used for crops—including cropland harvested, cropland failure, and cultivated summer fallow—totaled 338 million acres, or 87 percent of total U.S. cropland acreage. Three percent of total cropland was used only for pasture, and the remaining 10 percent of cropland was classified as idle cropland. The acreage enrolled in the USDA, Farm Service Agency’s Conservation Reserve Program accounted for 23 million of the 39 million acres in the idle cropland category in 2017.
Total cropland acreage in the United States has been declining since 1949, although the change has been uneven, with increases in some years and decreases in others. A drop from 478 million acres in 1949 to 444 million acres in 1964 was largely the result of surplus production and subsequent acreage-reduction programs. Cropland acreage was at or above 455 million acres each year NASS’s Census of Agriculture was conducted from 1969 to 1997. Between 2002 and 2012, total cropland declined by 50 million acres (about 11 percent) to 392 million acres before declining by an additional 2 million acres from 2012 to 2017 to reach 390 million acres, the lowest level recorded in the Major Land Uses series.
Despite this long-term decline in total cropland, cropland used for crops increased by 3 million acres from 2007 to 2017 to reach an overall level of 338 million acres, even with a decrease of 2 million acres from 2012 to 2017. Much of the total cropland decrease between 2002 and 2012 was the result of a series of methodological changes in the Census of Agriculture that reclassified land previously classified as cropland pasture as permanent grassland pasture and range. Thus, the change in total cropland in recent years is not fully comparable with earlier years.
Land Used for Grazing Shows Recent Increase
In 2017, just over 35 percent of U.S. land area, or 805 million acres, was used for grazing. This represents an increase of more than 6 million acres (just under 1 percent) from 2012. The three types of grazing land differ greatly in terms of acreage, geographic distribution, productivity, and other characteristics.
Most U.S. grazing land (659 million acres or more than 82 percent) was used as grassland pasture and range in 2017, an increase of 4 million acres (0.6 percent) from the 2012 estimate of 655 million acres. Four regions accounted for about 596 million acres of grassland pasture and range (or 90 percent): the Mountain region (50 percent), the Southern Plains (19 percent), and the Northern Plains and Pacific (21 percent combined). No other region holds more than 3 percent of the total grassland and pasture range acreage.
Total U.S. grazing land declined by about 245 million acres (about 24 percent) from 1949 to 2007. However, there was an increase of 21 million acres from 2007 to 2012, the first estimated increase in this land use since the addition of Alaska and Hawaii to the Major Land Uses estimates. This increase was followed by an increase of just over 6 million acres from 2012 to 2017, bringing the total grazing acreage in 2017 to a level similar to that from 25 years before.
| Land use | 1949 | 1954 | 1959 | 1964 | 1969 | 1974 | 1978 | 1982 | 1987 | 1992 | 1997 | 2002 | 2007 | 2012 | 2017 |
|---|---|---|---|---|---|---|---|---|---|---|---|---|---|---|---|
| Acres (millions) | |||||||||||||||
| Grassland pasture and range | 632 | 634 | 633 | 640 | 604 | 598 | 587 | 597 | 591 | 591 | 580 | 587 | 614 | 655 | 659 |
| Grazed forest-use land | 320 | 301 | 245 | 225 | 198 | 179 | 172 | 158 | 155 | 145 | 141 | 134 | 127 | 130 | 132 |
| Cropland pasture | 69 | 66 | 66 | 57 | 88 | 83 | 76 | 65 | 65 | 67 | 68 | 62 | 36 | 13 | 13 |
| Total grazing land | 1,022 | 1,001 | 943 | 922 | 890 | 860 | 835 | 820 | 811 | 803 | 788 | 783 | 777 | 798 | 805 |
Note: Because of consecutive methodological changes in the USDA, National Agricultural Statistics Service's 2007 and 2012 Census of Agriculture editions, a substantial amount of land that had previously been classified as cropland pasture was reclassified as grassland pasture and range in the USDA, Economic Research Service Major Land Uses data product. While estimates for these two land types for 2012 and 2017 are directly comparable, estimates from 2007 onward are not directly comparable to earlier years. Individual values may not add up to totals because of rounding.
Source: USDA, Economic Research Service Major Land Uses data product.
This article is drawn from:
- Winters-Michaud, C.P., Haro, A., Callahan, S. & Bigelow, D. (2024). Major Uses of Land in the United States, 2017. U.S. Department of Agriculture, Economic Research Service. EIB-275.
You may also like:
- Major Land Uses. (n.d.). U.S. Department of Agriculture, Economic Research Service.
- Land Use, Land Value & Tenure. (n.d.). U.S. Department of Agriculture, Economic Research Service.


