As U.S. Farmers Respond to Crop Price Changes, Trends in Planted Acreage Emerge
- by Brian Williams and Gayle Pounds-Barnett
- 8/19/2024
Highlights
- As the expected profitability and price of a crop rises, producers tend to respond by planting more of that crop. When the relative prices of other crops increase, producers are inclined to respond by planting more of the alternative crop instead.
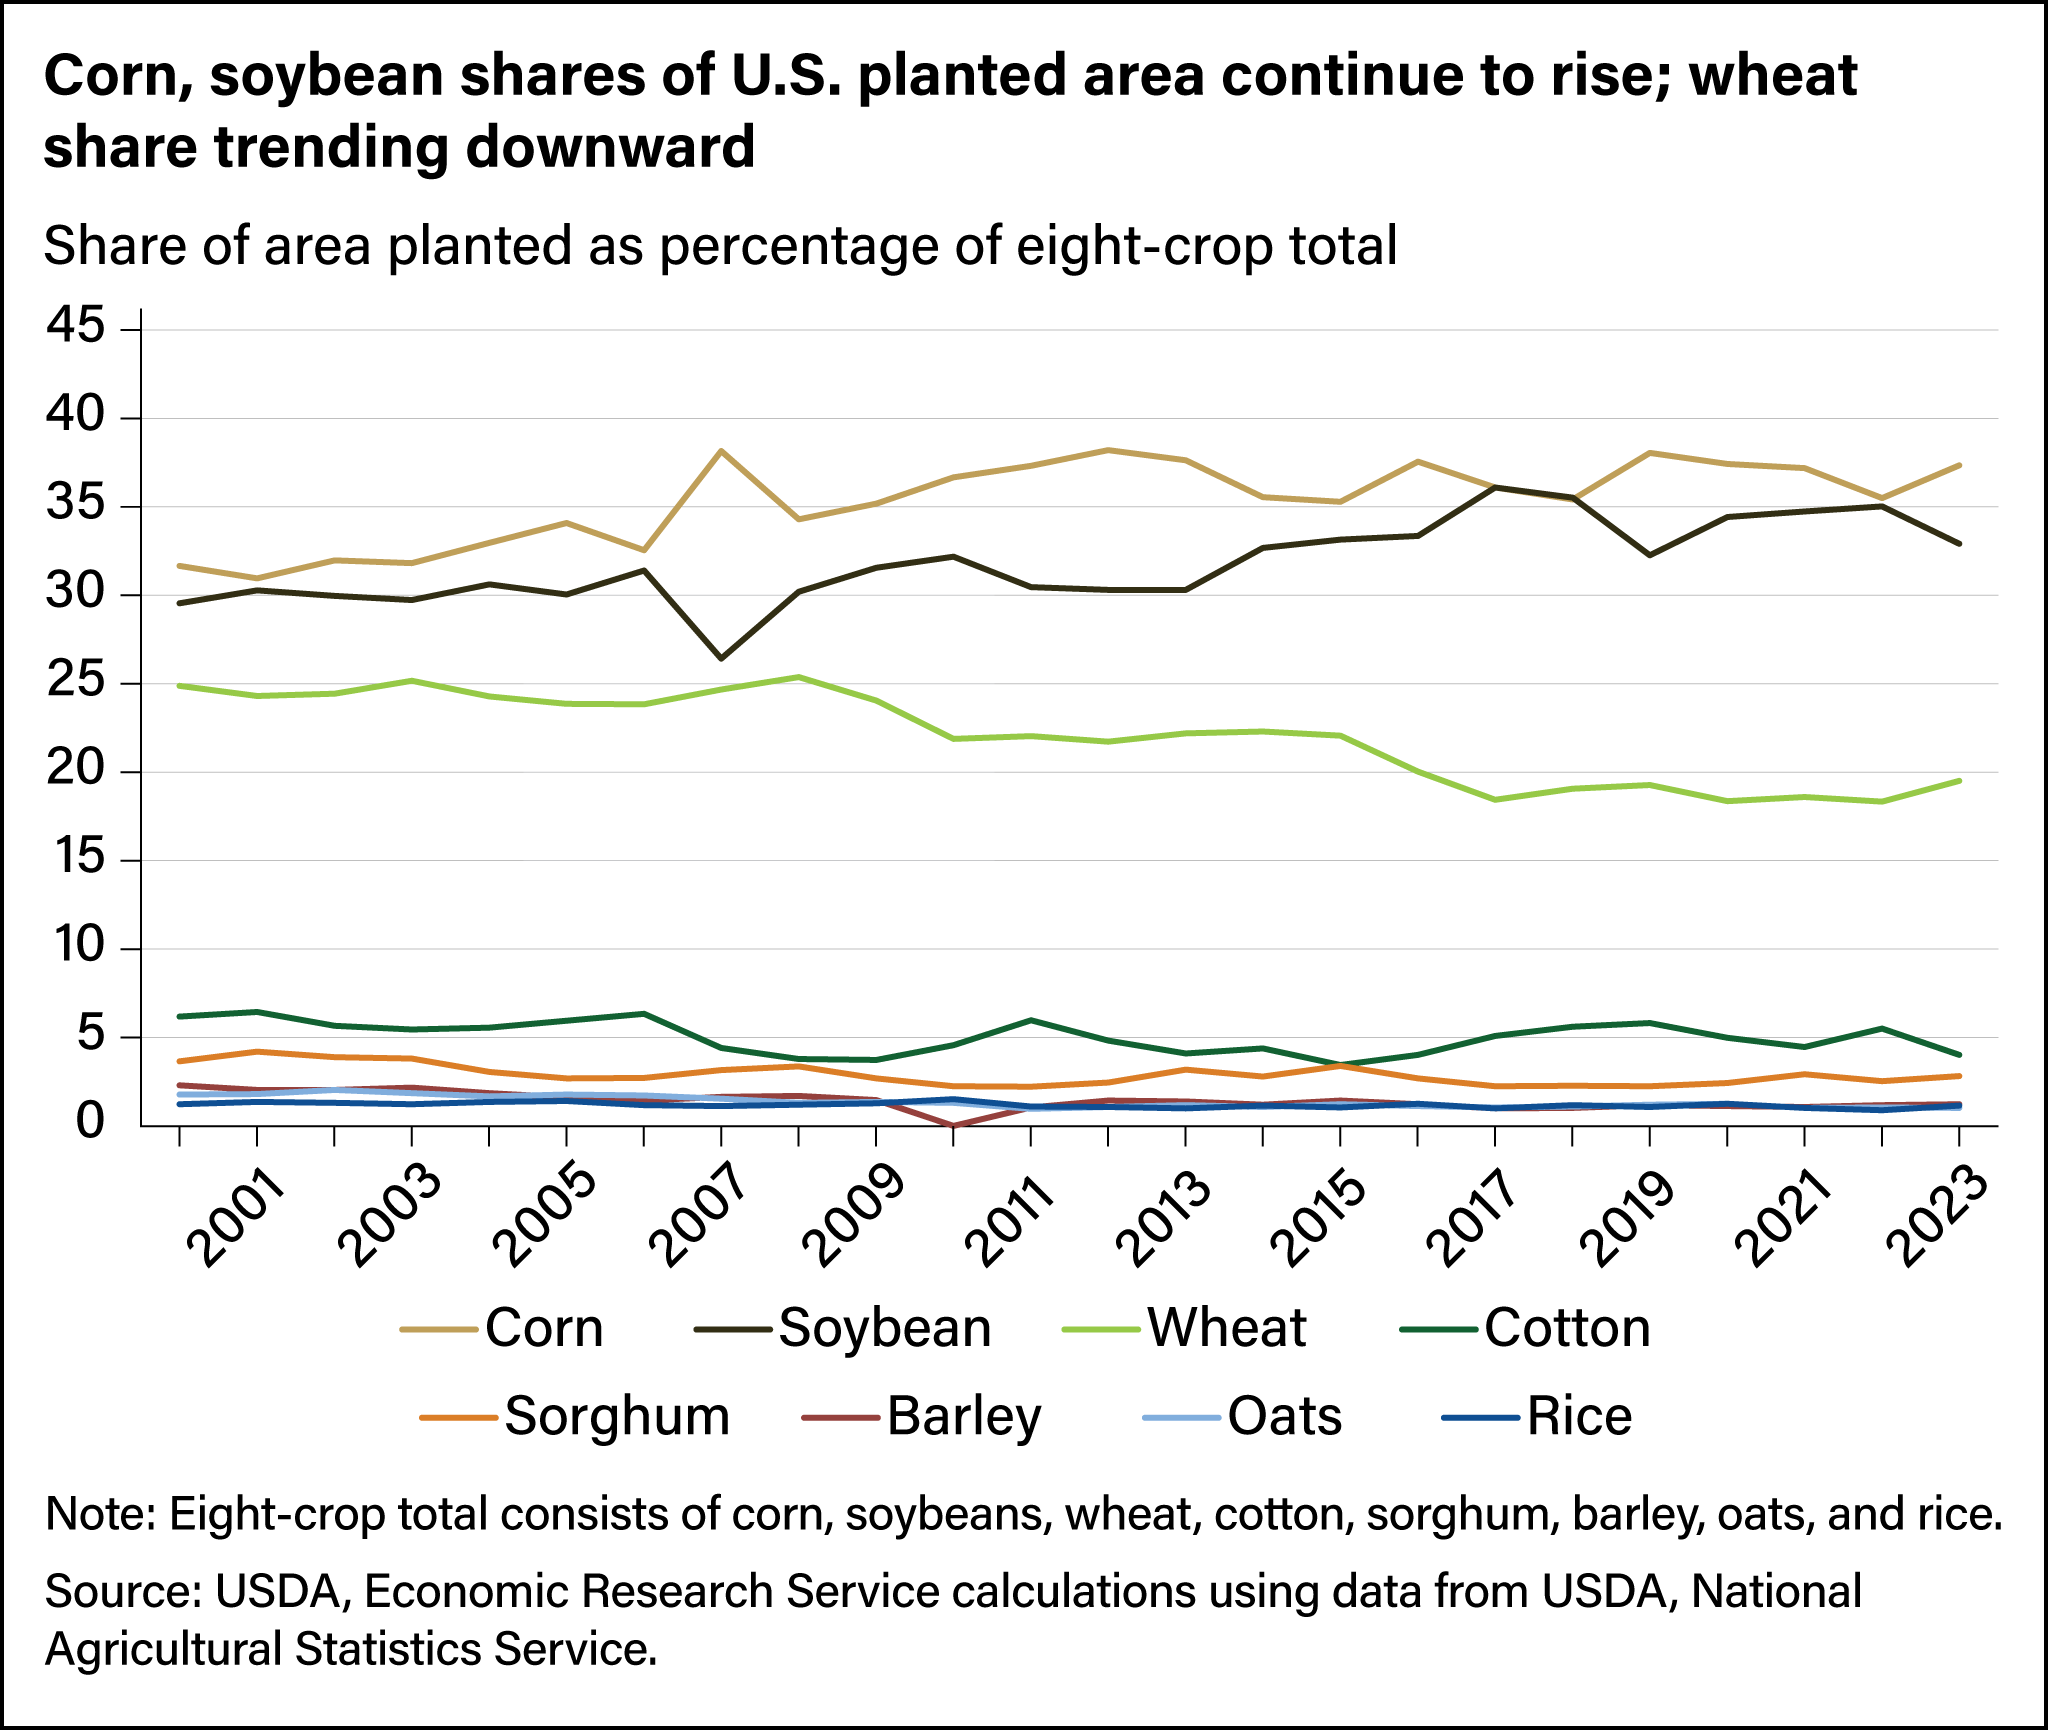
- In a study of how U.S. producer decisions affected planted acreage, USDA’s Economic Research Service examined the area planted for eight major row crops: corn, soybeans, wheat, sorghum, barley, oats, cotton, and rice and found the share of each crop’s area as a percentage of the total area of the studied crops changed over time.
- Since 2000, the share of area planted to both corn and soybeans has grown as U.S. biofuels policies have taken root. Wheat’s share has moved downward as prices for corn and soybeans have increased.
As crop farmers decide what crops they are going to plant each year, two factors they will take into account are the expected profitability of a crop and the profitability and price of alternative crops. As the expected profitability and price of a crop rises, producers tend to respond by planting more of that crop. When the relative prices of other crops increase, producers are inclined to respond by planting more of the alternative crop instead. For instance, policy changes in the early 2000s spurred corn plantings for biofuel, and production surged in the United States. This resulted in structural changes in the agricultural industry that have increased demand for corn and corn prices while also supporting elevated prices for other crops. As crop producers throughout the country similarly responded to these price signals in the market, planted acreage also began shifting by observable patterns.
In a study of how U.S. producer decisions affected planted acreage, researchers from the USDA’s Economic Research Service examined the area planted for major U.S. row crops. They found the share of each crop’s area as a percentage of the total area of the studied crops changed over time. They also determined the degree by which a price increase or decrease would result in a change in planted acreage.
Since 2000, the share of area planted to both corn and soybeans has grown. Increases in corn and soybean acreage can be attributed to a number of factors but predominantly to their increasing use as a feedstock for biofuel production. From 2000–2005, corn’s share of the area planted to the eight major field crops (corn, soybeans, wheat, sorghum, barley, oats, cotton, and rice) remained below 35 percent. Since 2009, as biofuel-supporting policies took root in the United States, the share of total area planted to corn has remained above 35 percent. In 2019, corn’s share of the total peaked at 38 percent. Soybean area planted has followed a similar trend, with the share hovering at or below 30 percent of the eight-crop area planted total through 2005. By 2017, soybeans had captured more than 36 percent of all area planted and have remained above 32 percent in subsequent years.
In contrast to corn and soybeans, wheat’s share of total area planted has trended downward. Wheat has become more of a rotational crop to be mixed in with or substituted out in favor of more profitable corn or soybean crops—especially in the Northern Great Plains region of the United States. From 2000–2010, wheat’s share of the eight-crop area planted total hovered between 24 and 25 percent but began to shrink in 2010, decreasing to 22 percent. Wheat’s share of total area planted fell below 20 percent in 2017 and hasn’t topped that percentage since as relatively higher corn prices and profitability have favored corn acreage.
Cotton has followed a similar trend to wheat. Before 2007, cotton’s share of total area planted remained above 5 percent, but a decline in cotton prices and higher corn prices caused cotton’s share to fall to 4 percent in 2007 and below 4 percent in 2008. Cotton’s share of total area has since stabilized, but the liquidation of cotton-specific equipment by some producers has left cotton area hovering in the 4 to 5 percent range in all but 4 years. Sorghum, barley, and oats each remained below 4 percent throughout the period, with sorghum, barley, and oats each losing about 1 percent of their share.
Rice planting decisions are generally made with less consideration of the prices of other crops because of the costly preparation required to level rice fields so they can be flooded during production. For this reason, most rice fields will be planted to rice continuously or in a set rotation with other crops such as soybeans for disease and pest control. Acreage planted to rice makes up about 1 percent of the eight-crop total and has remained relatively steady since 2000.
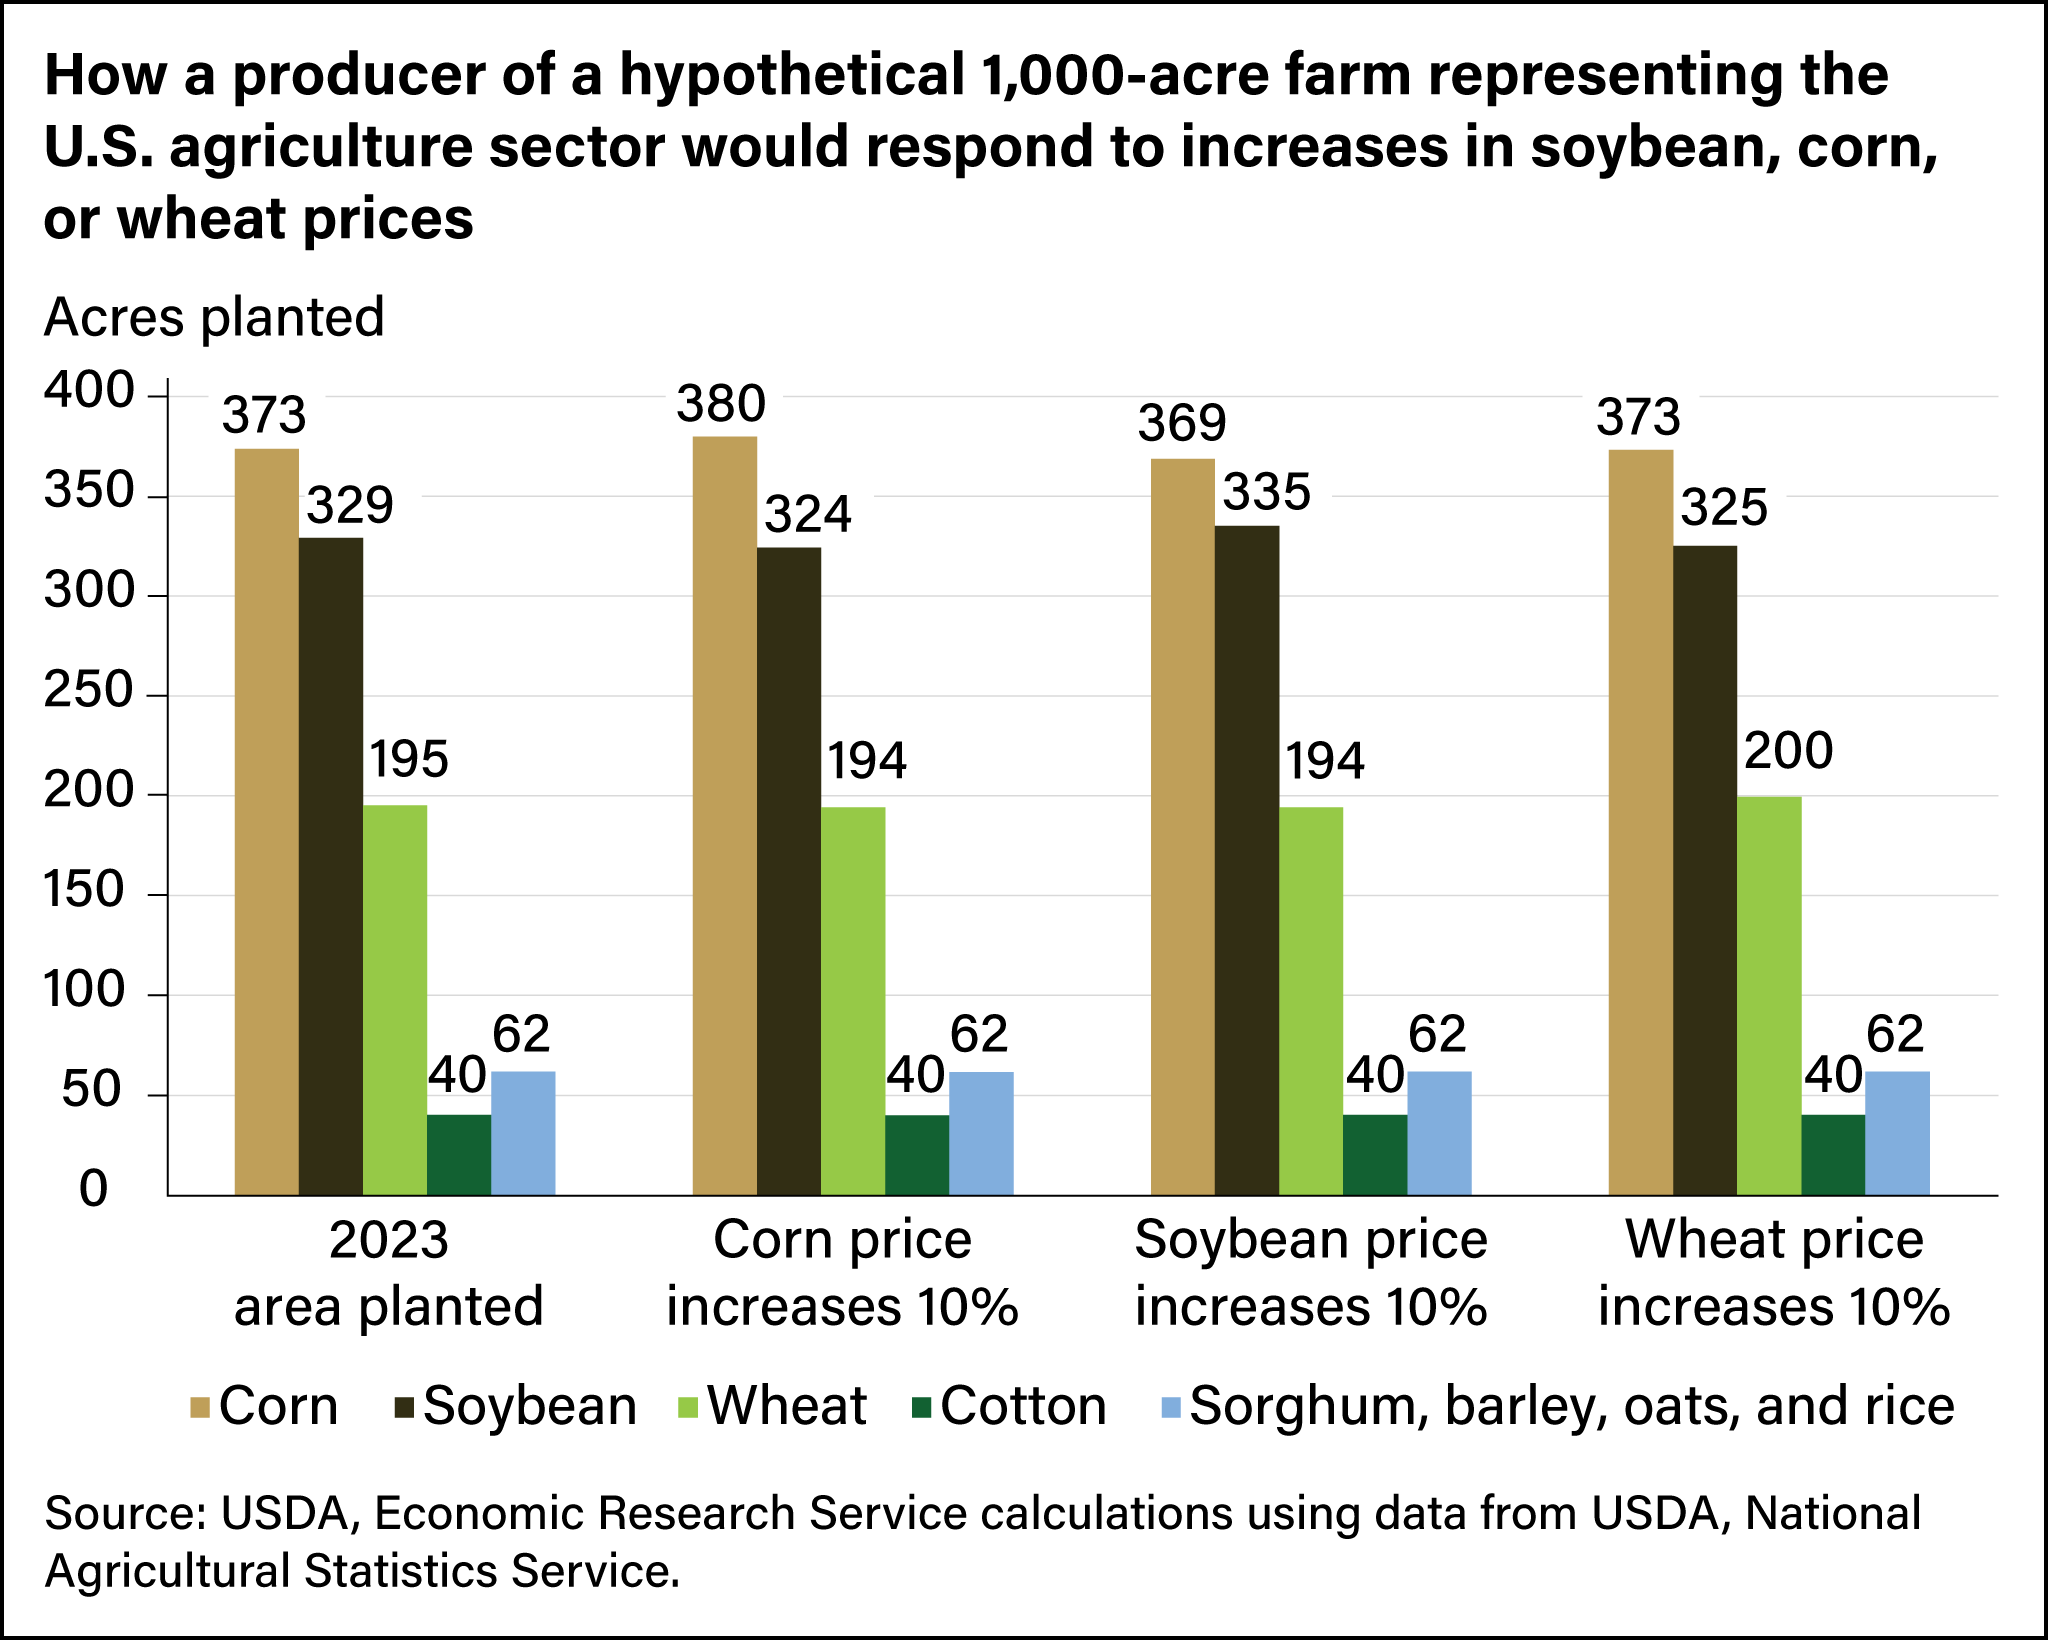
Researchers determined that for every 1-percent increase in corn prices, corn acreage planted increases by 0.210 percent and soybean acreage planted declines by 0.115 percent. To put it in another way, take a hypothetical 1,000-acre farm whose planting decisions match the U.S. agricultural sector as a whole. In 2023, the hypothetical farm planted 373 (37.3 percent of its total area) acres of corn, 329 (32.9 percent) acres of soybeans, 195 (19.5 percent) acres of wheat, 40 (4.0 percent) acres of cotton, and 10 to 30 acres each of sorghum, barley, oats, and rice. If the price of corn for the next growing season increased 10 percent ($0.50 per bushel), the farm will increase corn area planted by 7 acres and decrease soybean area by about 5 acres. The remaining area would go to lower wheat, sorghum, and cotton acreage. Conversely, a 10 percent ($1.30 per bushel) increase in the price of soybeans will result in a 4-acre decrease in corn area and a 6-acre increase in soybeans.
The ease with which crops can be substituted for one another is dependent upon the growing conditions where the farmer is located. For example, in some regions such as the Corn Belt and the Northern Plains, the growing season is too short to successfully grow cotton. Other areas may be too hot and dry to reliably produce soybeans, while some areas may possess conditions in which any crops could successfully be grown.
This article is drawn from:
- Williams, B. & Pounds-Barnett, G. (2023). Producer Supply Response for Area Planted of Seven Major U.S. Crops. U.S. Department of Agriculture, Economic Research Service. ERR-327.
You may also like:
- Agricultural Baseline Database. (n.d.). U.S. Department of Agriculture, Economic Research Service.


