Researchers Adjust Self-Reported Estimates of Obesity in Scanner Data
- by Abigail Okrent, Megan Sweitzer, Sabrina Young and Elina T. Page
- 11/20/2023
The prevalence and incidence of obesity continue to rise in the United States, with less healthy diets being a primary contributing factor. Monitoring how U.S. obesity evolves over time and across socioeconomic groups with shifting dietary patterns helps inform policies to mitigate increases in obesity. The body mass index (BMI), constructed using the relationship between height and weight, is a commonly used measurement of adult obesity. BMI is defined as a person’s weight in kilograms divided by height in meters squared (kg/m2). A BMI of more than 30 kg/m2 indicates obesity, a BMI of less than 18.5 signals underweight status, and a BMI from 25.0 to 29.9 means a person qualifies as overweight. Anyone with a BMI between the underweight and overweight BMIs falls in the healthy weight status. However, self-reported height and weight often are misreported in surveys; individuals tend to overreport their height and underreport their weight, resulting in a lower BMI than if it were based on measured height and weight. Most surveys rely on self-reported height and weight data because of the cost and burden of collecting measurements from respondents, but the National Health and Nutrition Examination Survey (NHANES) measures both. Comparing self-reported and measured heights and weights from NHANES is useful to understand measurement error in self-reported data.
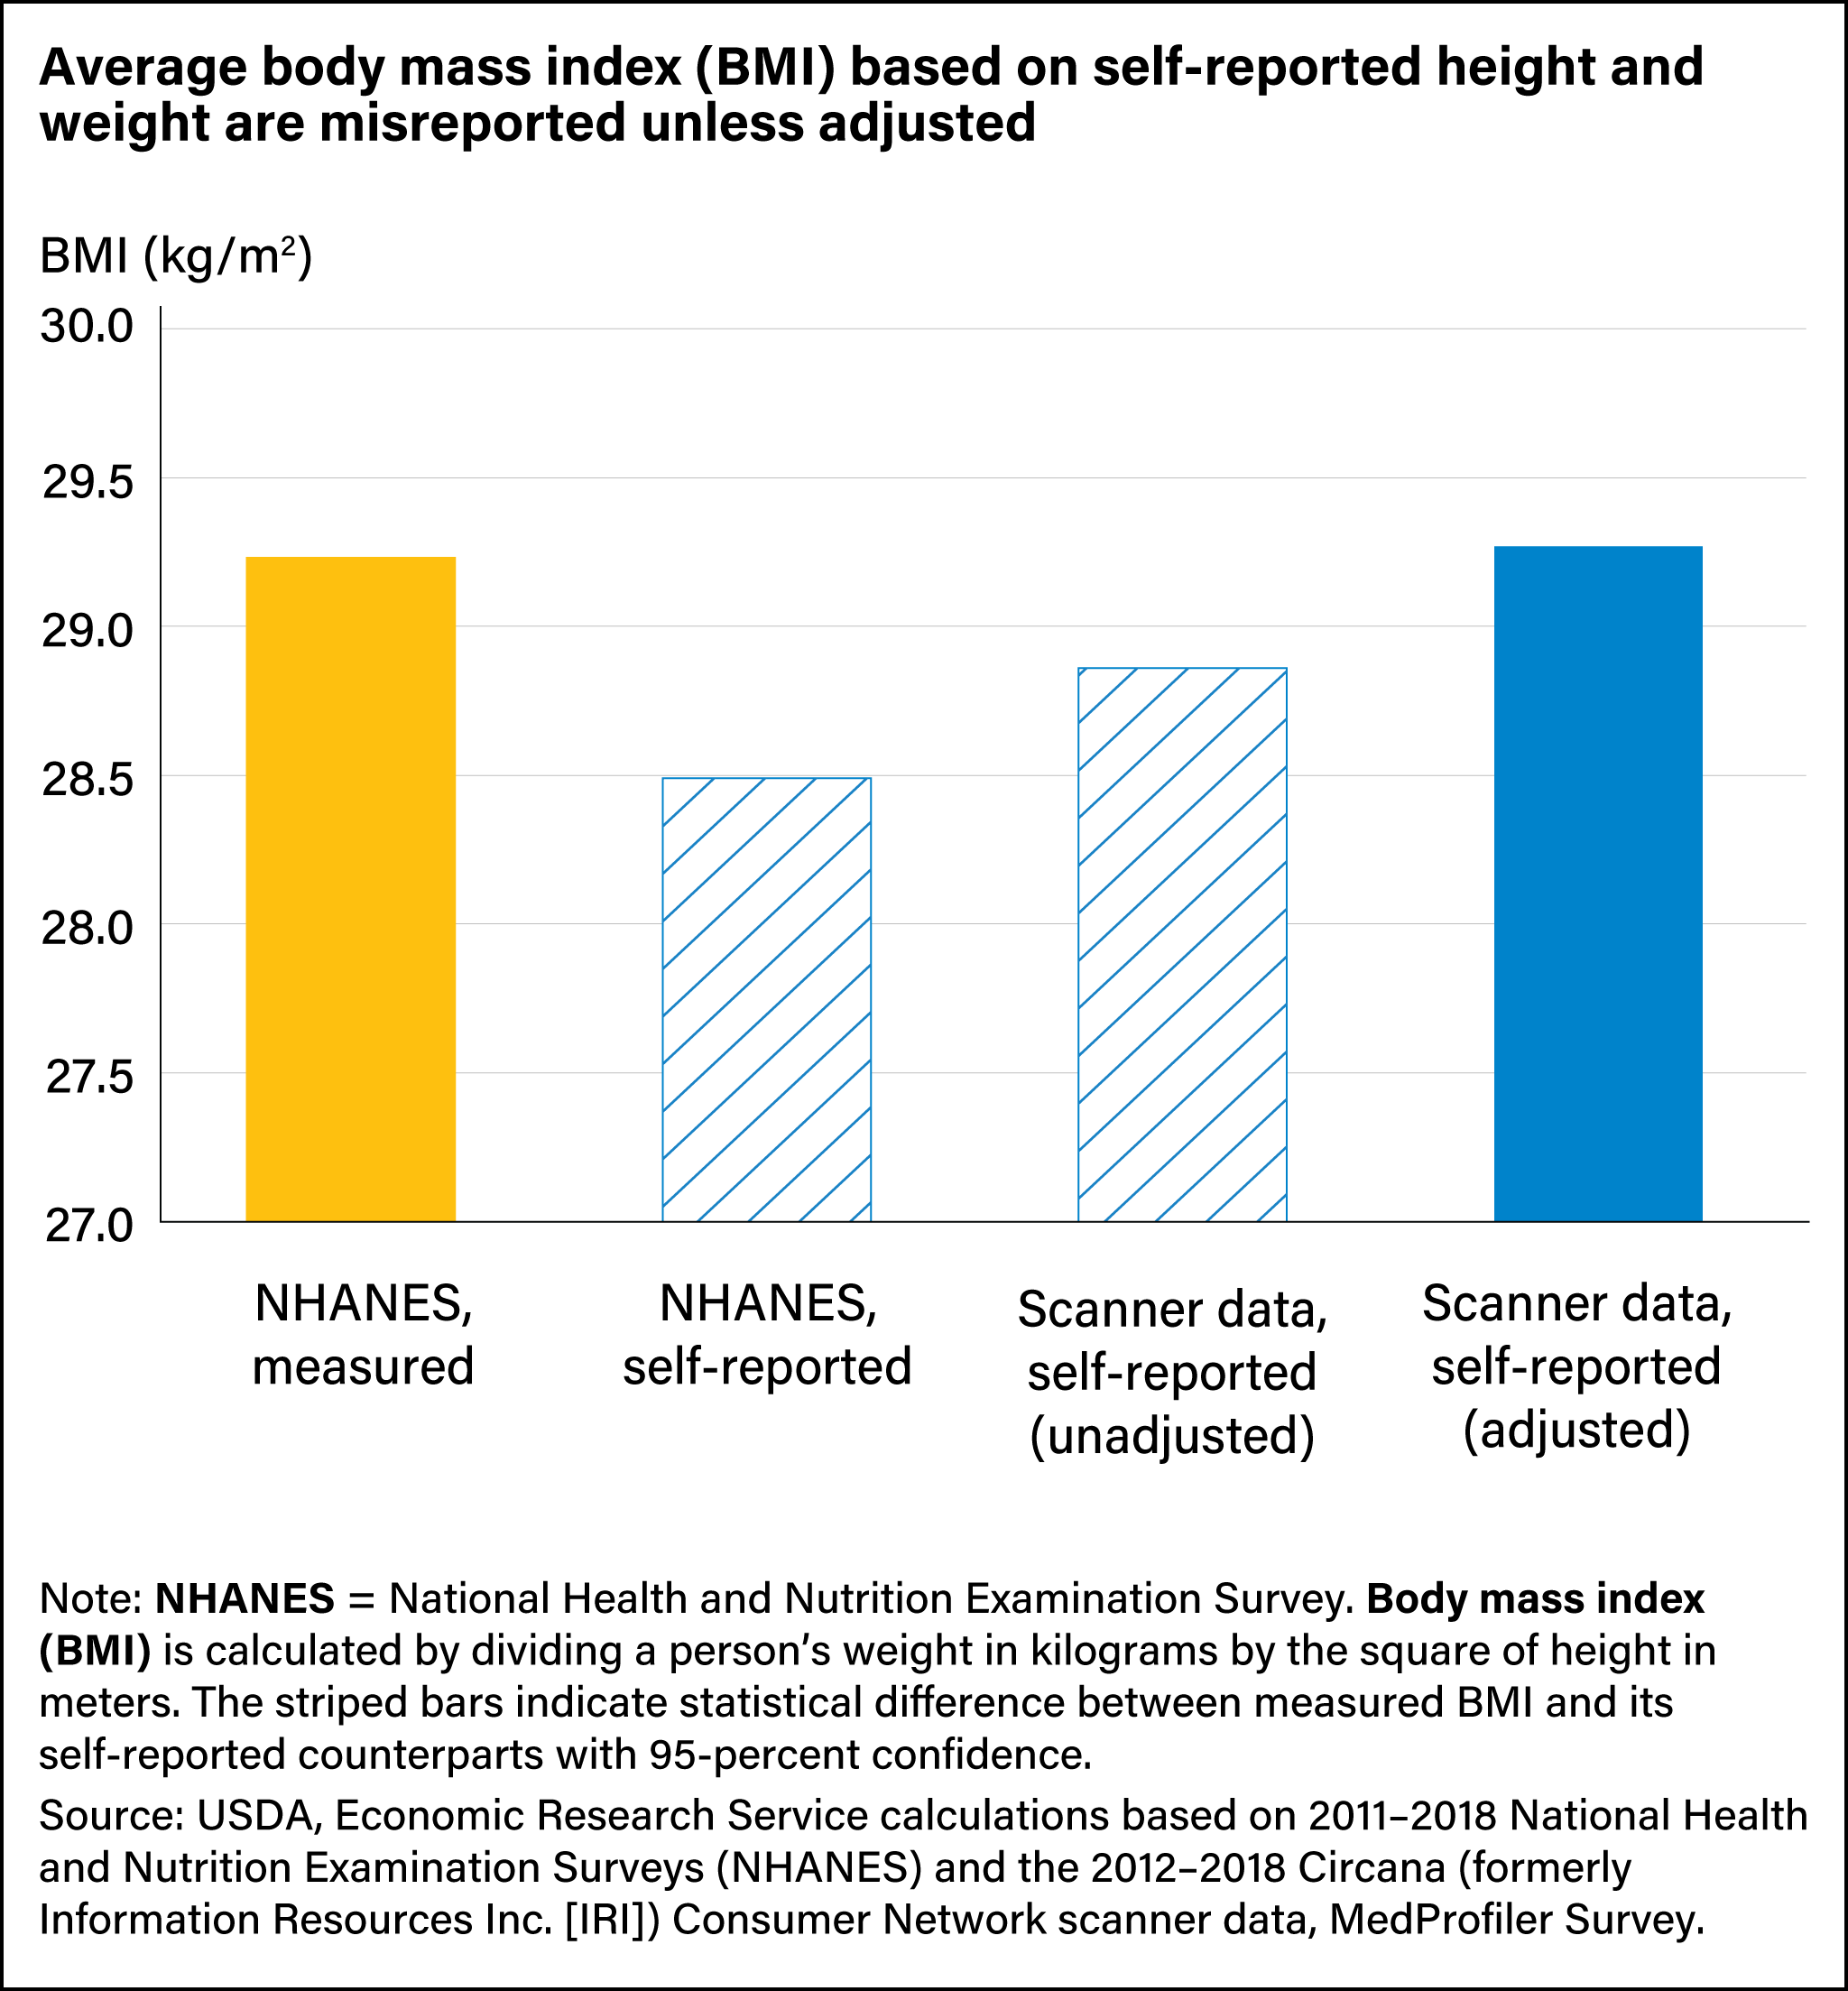
Proprietary scanner data contain information on food purchases of U.S. households as well as self-reported height and weight of household members. Researchers using scanner data to examine the relationship between diet and obesity need a way to account for the measurement issues in self-reported data. In both NHANES and scanner data, average BMI for adults based on self-reported height and weight were lower than the average measured BMI. According to the NHANES, average BMI based on measured height and weight was 29.23, higher than the NHANES average of 28.49 that was based on self-reported height and weight and the self-reported scanner data average of 28.86.
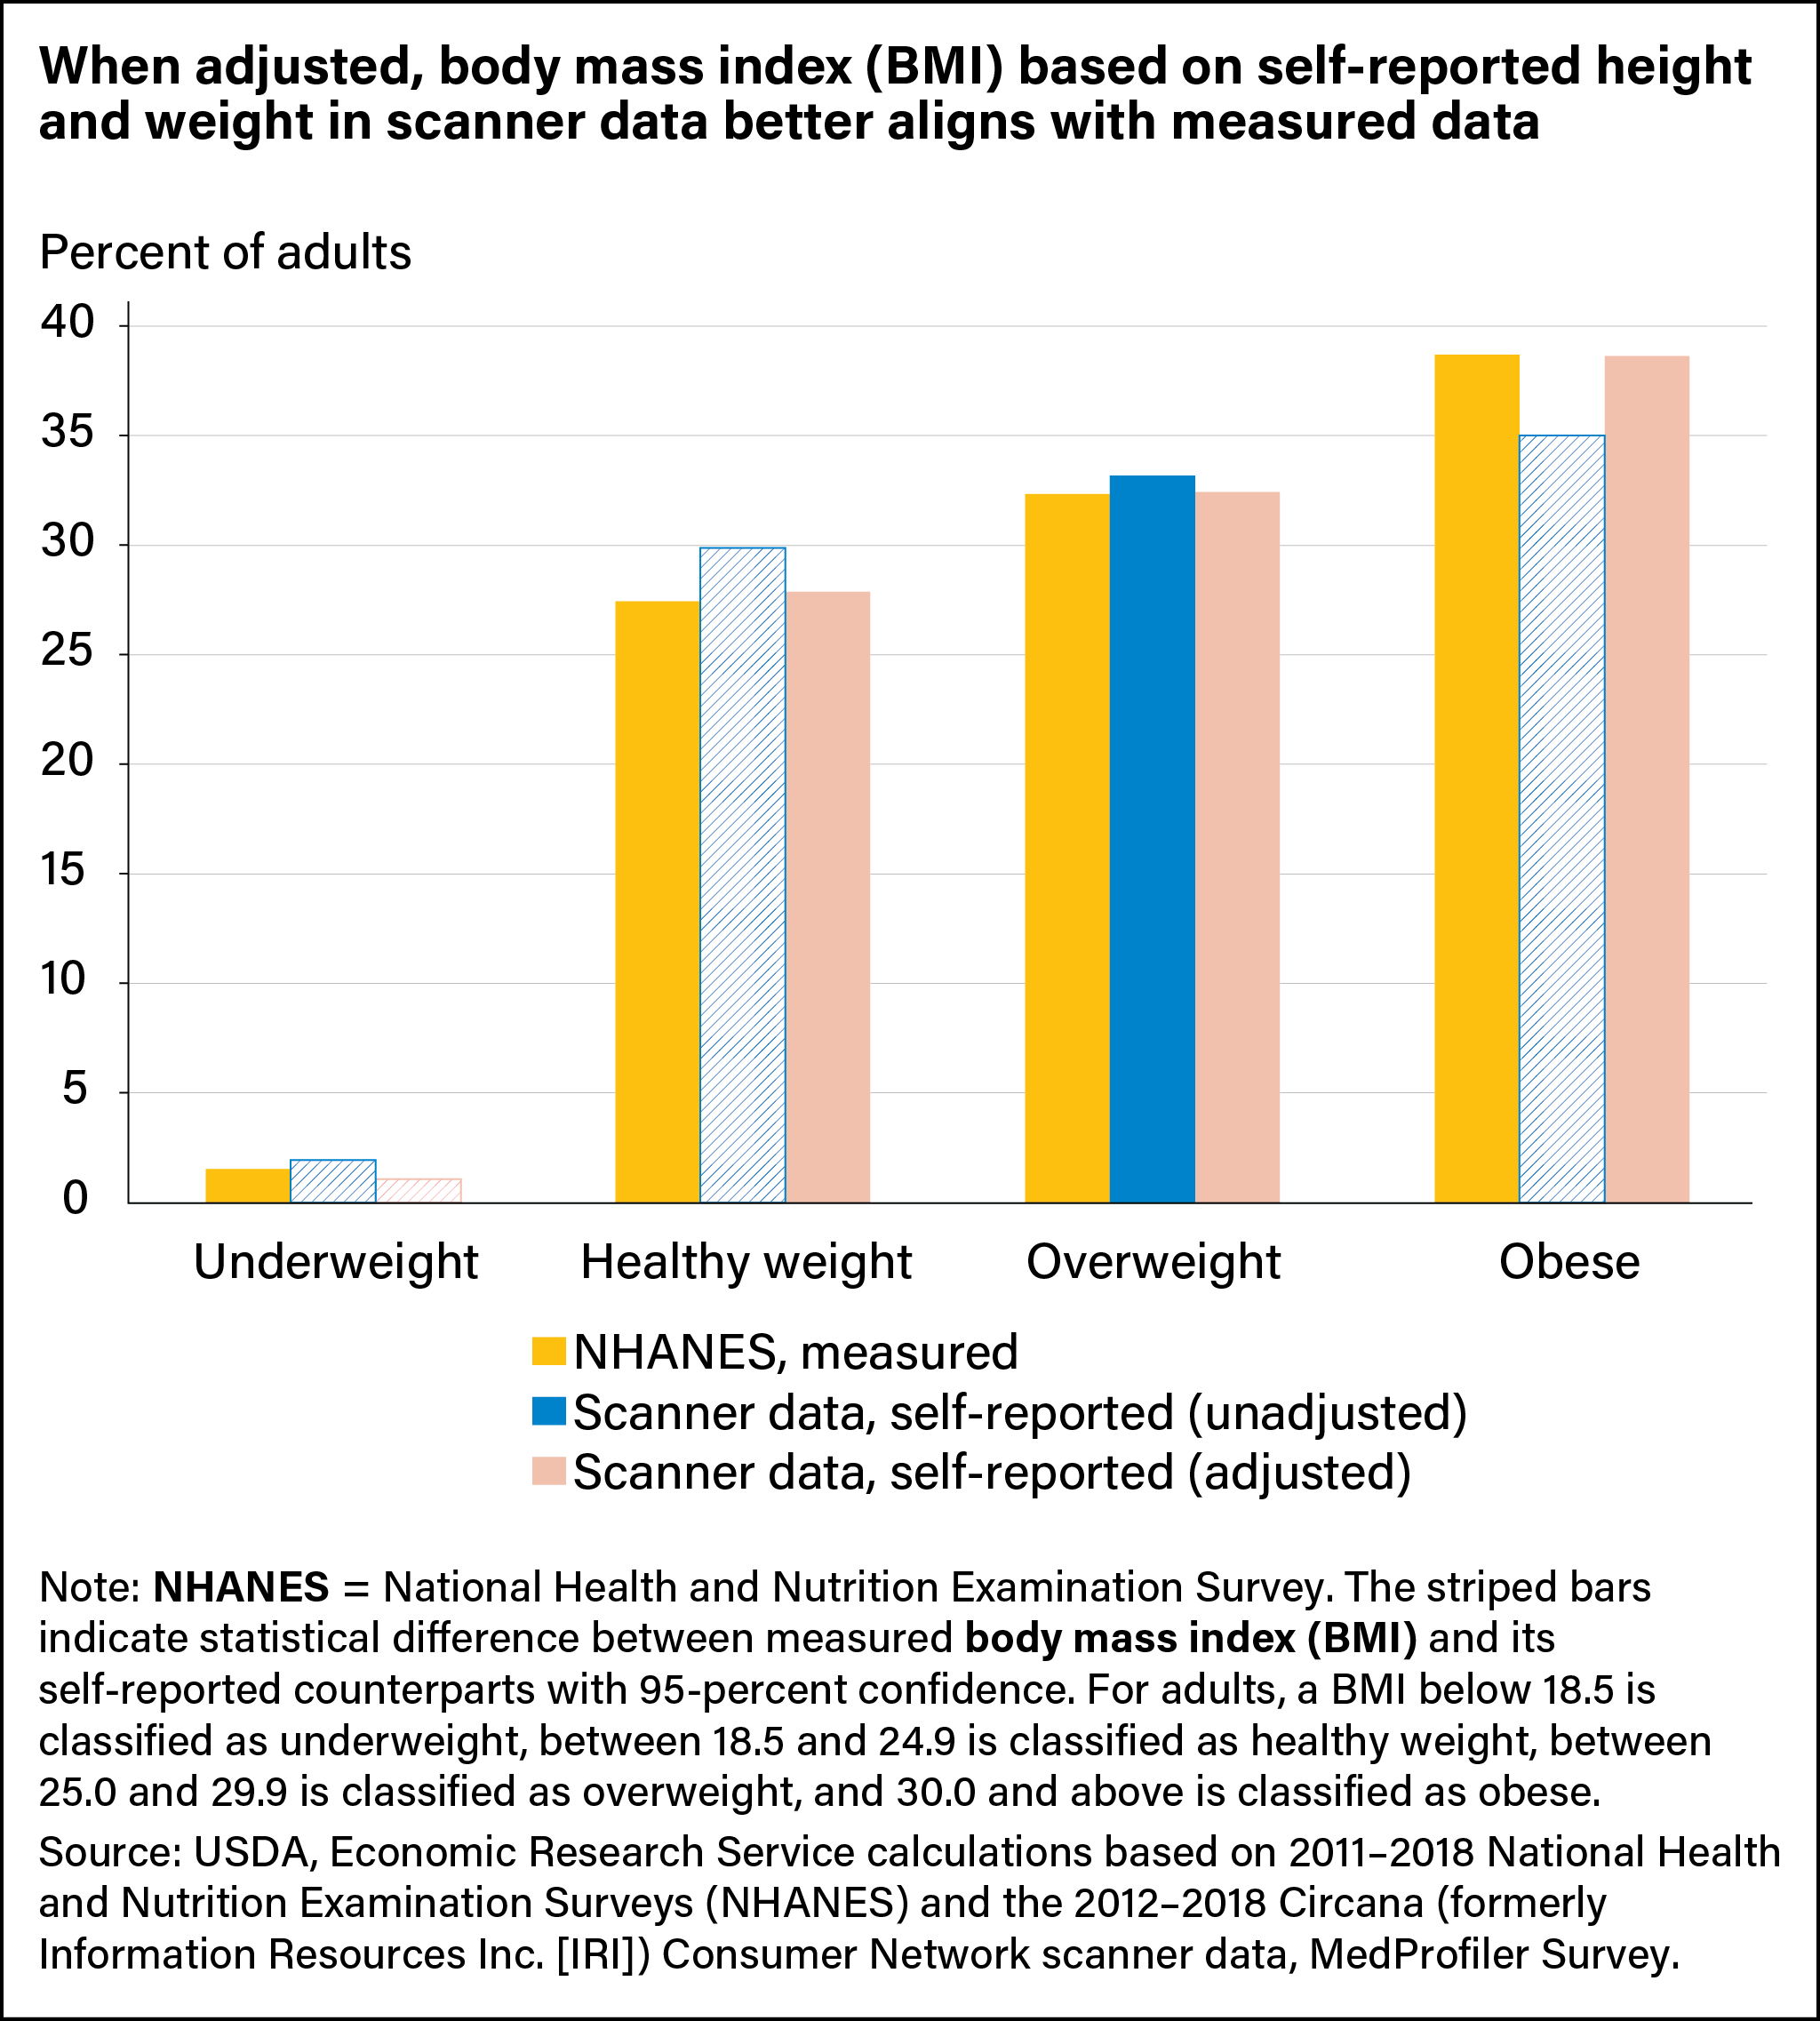
Using both self-reported and measured heights and weights for adults in the NHANES, the self-reported information in the scanner data can be adjusted to reduce measurement error. In a recent USDA, Economic Research Service report using this adjustment method, the prevalence of adults classified as obese in the scanner data rose, and the prevalence of adults classified as healthy weight or overweight declined, better aligning with the measured data. After the adjustments, the average BMI (29.27) and average obesity prevalence (38.6 percent) in the self-reported scanner data were more closely aligned with estimates using measured BMI in the NHANES (29.23 for average BMI and 38.7 percent for obesity prevalence). This adjustment method can help researchers who use scanner data reduce measurement error in studies on food purchases, prices, and obesity.
This article is drawn from:
- Young, S., Page, E.T., Okrent, A. & Sweitzer, M. (2023). Assessment and Adjustment of Body Weight Measures in Scanner Data. U.S. Department of Agriculture, Economic Research Service. TB-1960.
You may also like:
- Restrepo, B.J. & Zeballos , E. (2019, April 1). Time Spent Eating Varies by Age, Education, and Body Mass Index . Amber Waves, U.S. Department of Agriculture, Economic Research Service.
- Obesity. (n.d.). U.S. Department of Agriculture, Economic Research Service.
- Restrepo, B.J. (2022, July 5). Adult Obesity Prevalence Increased During the First Year of the COVID-19 Pandemic. Amber Waves, U.S. Department of Agriculture, Economic Research Service.
- Ehmke, M. & Restrepo, B.J. (2023). COVID-19 Working Paper: Obesity Prevalence Among U.S. Adult Subpopulations During the First Year of the COVID-19 Pandemic. U.S. Department of Agriculture, Economic Research Service. AP-115.
- Muth, M.K., Sweitzer, M., Brown, D., Capogrossi, K., Karns, S.A., Levin, D., Okrent, A., Siegel, P. & Zhen, C. (2016). Understanding IRI Household-Based and Store-Based Scanner Data. U.S. Department of Agriculture, Economic Research Service. TB-1942.


