ERS Refines Forecasting Methods in Food Price Outlook
- by Megan Sweitzer, Matthew MacLachlan and Gianna Short
- 2/14/2023
The USDA, Economic Research Service’s (ERS) Food Price Outlook (FPO) provides forecasts of annual food price changes up to 18 months in the future. Once a month, the FPO forecasts the annual percentage change in prices for the current year and, beginning in July each year, for the following year. ERS has forecasted food prices for decades and periodically updates and improves the forecasting methods. In 2022, researchers at ERS developed a method to forecast food price changes more accurately while better representing the level of uncertainty in forecasts.
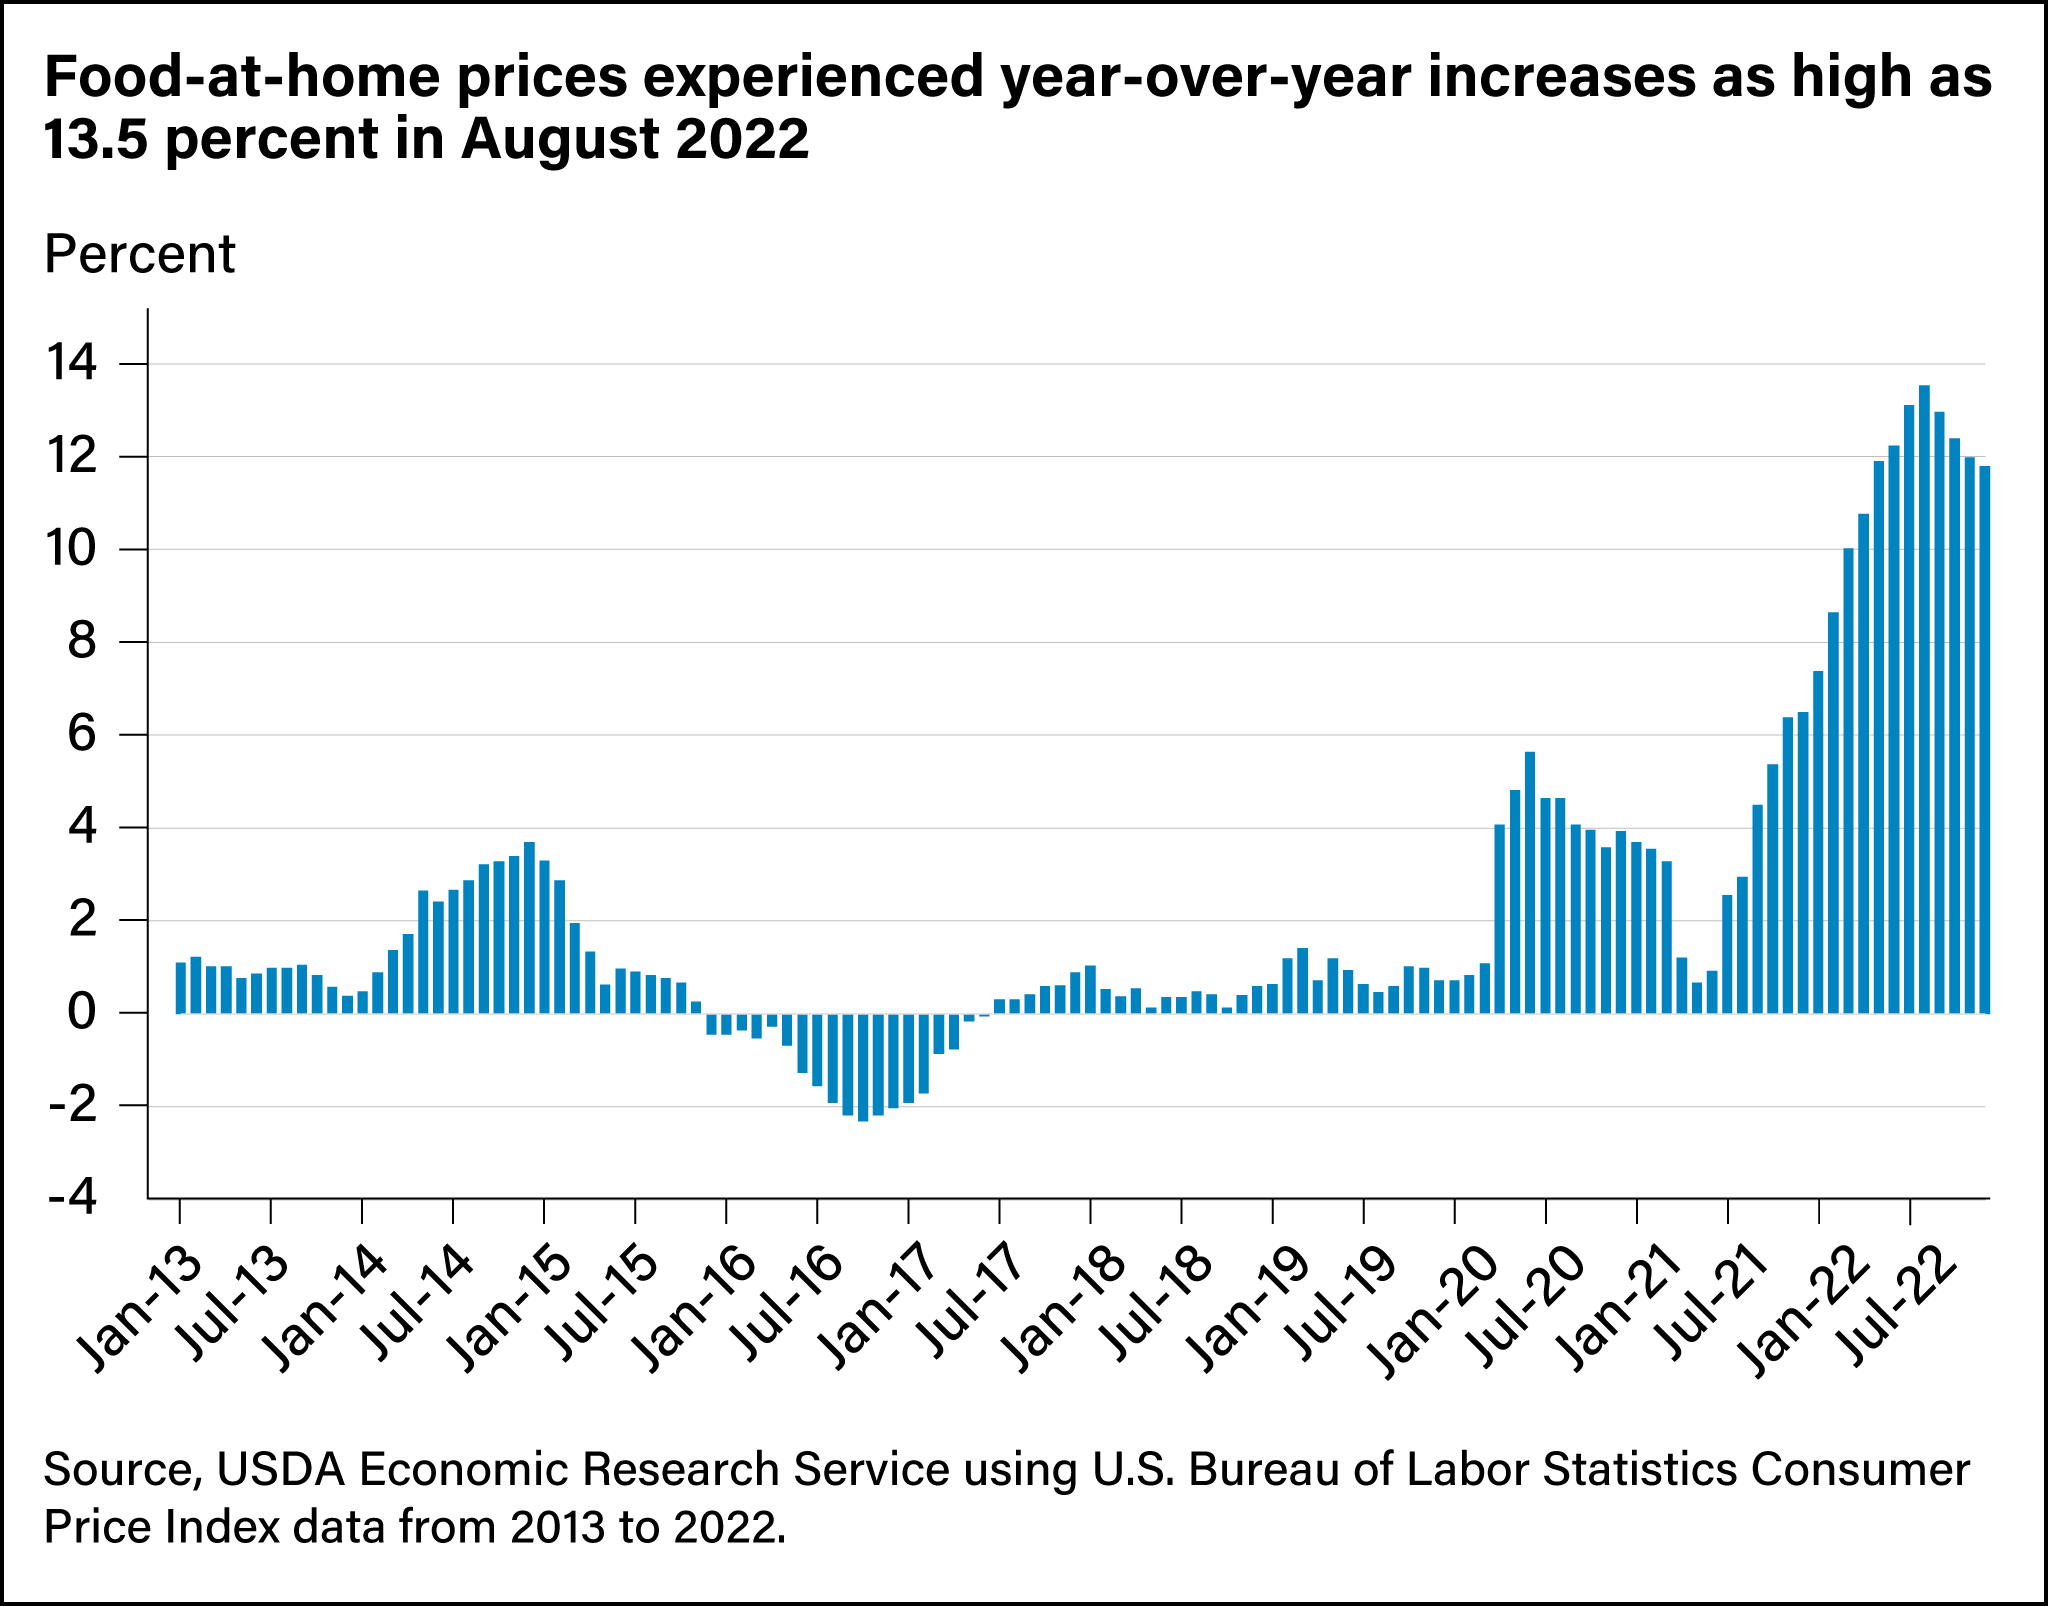
Food prices have increased more rapidly in recent years, with shocks to the food supply chain from events such as the Coronavirus (COVID-19) pandemic, a highly pathogenic avian influenza outbreak, and the conflict in Ukraine. Food-at-home prices rose 3.5 percent in 2020 and 2021 and 11.4 percent in 2022. The historical annual average is 2.0 percent from 2002 to 2021. Recent price increases tied to unprecedented world events highlight the importance of periodic reviews of, and improvements to, forecasting methods over time.
There are many ways to track food price changes over time. The FPO forecasts annual percent price change by averaging prices in the 12 months of a calendar year and comparing them with past or future annual average prices. For example, forecasts for 2023 developed in 2022 are based on an average of predictions for all 12 months of 2023 compared with 2022. As the months progress and new price data become available, the forecasts incorporate that new price change information. Once actual price data from 2023 start to become available in February 2023, the FPO will base the forecast for the year on a combination of observed and forecast data. Therefore, forecasts developed earlier in the year will be more uncertain than forecasts developed later in the year.
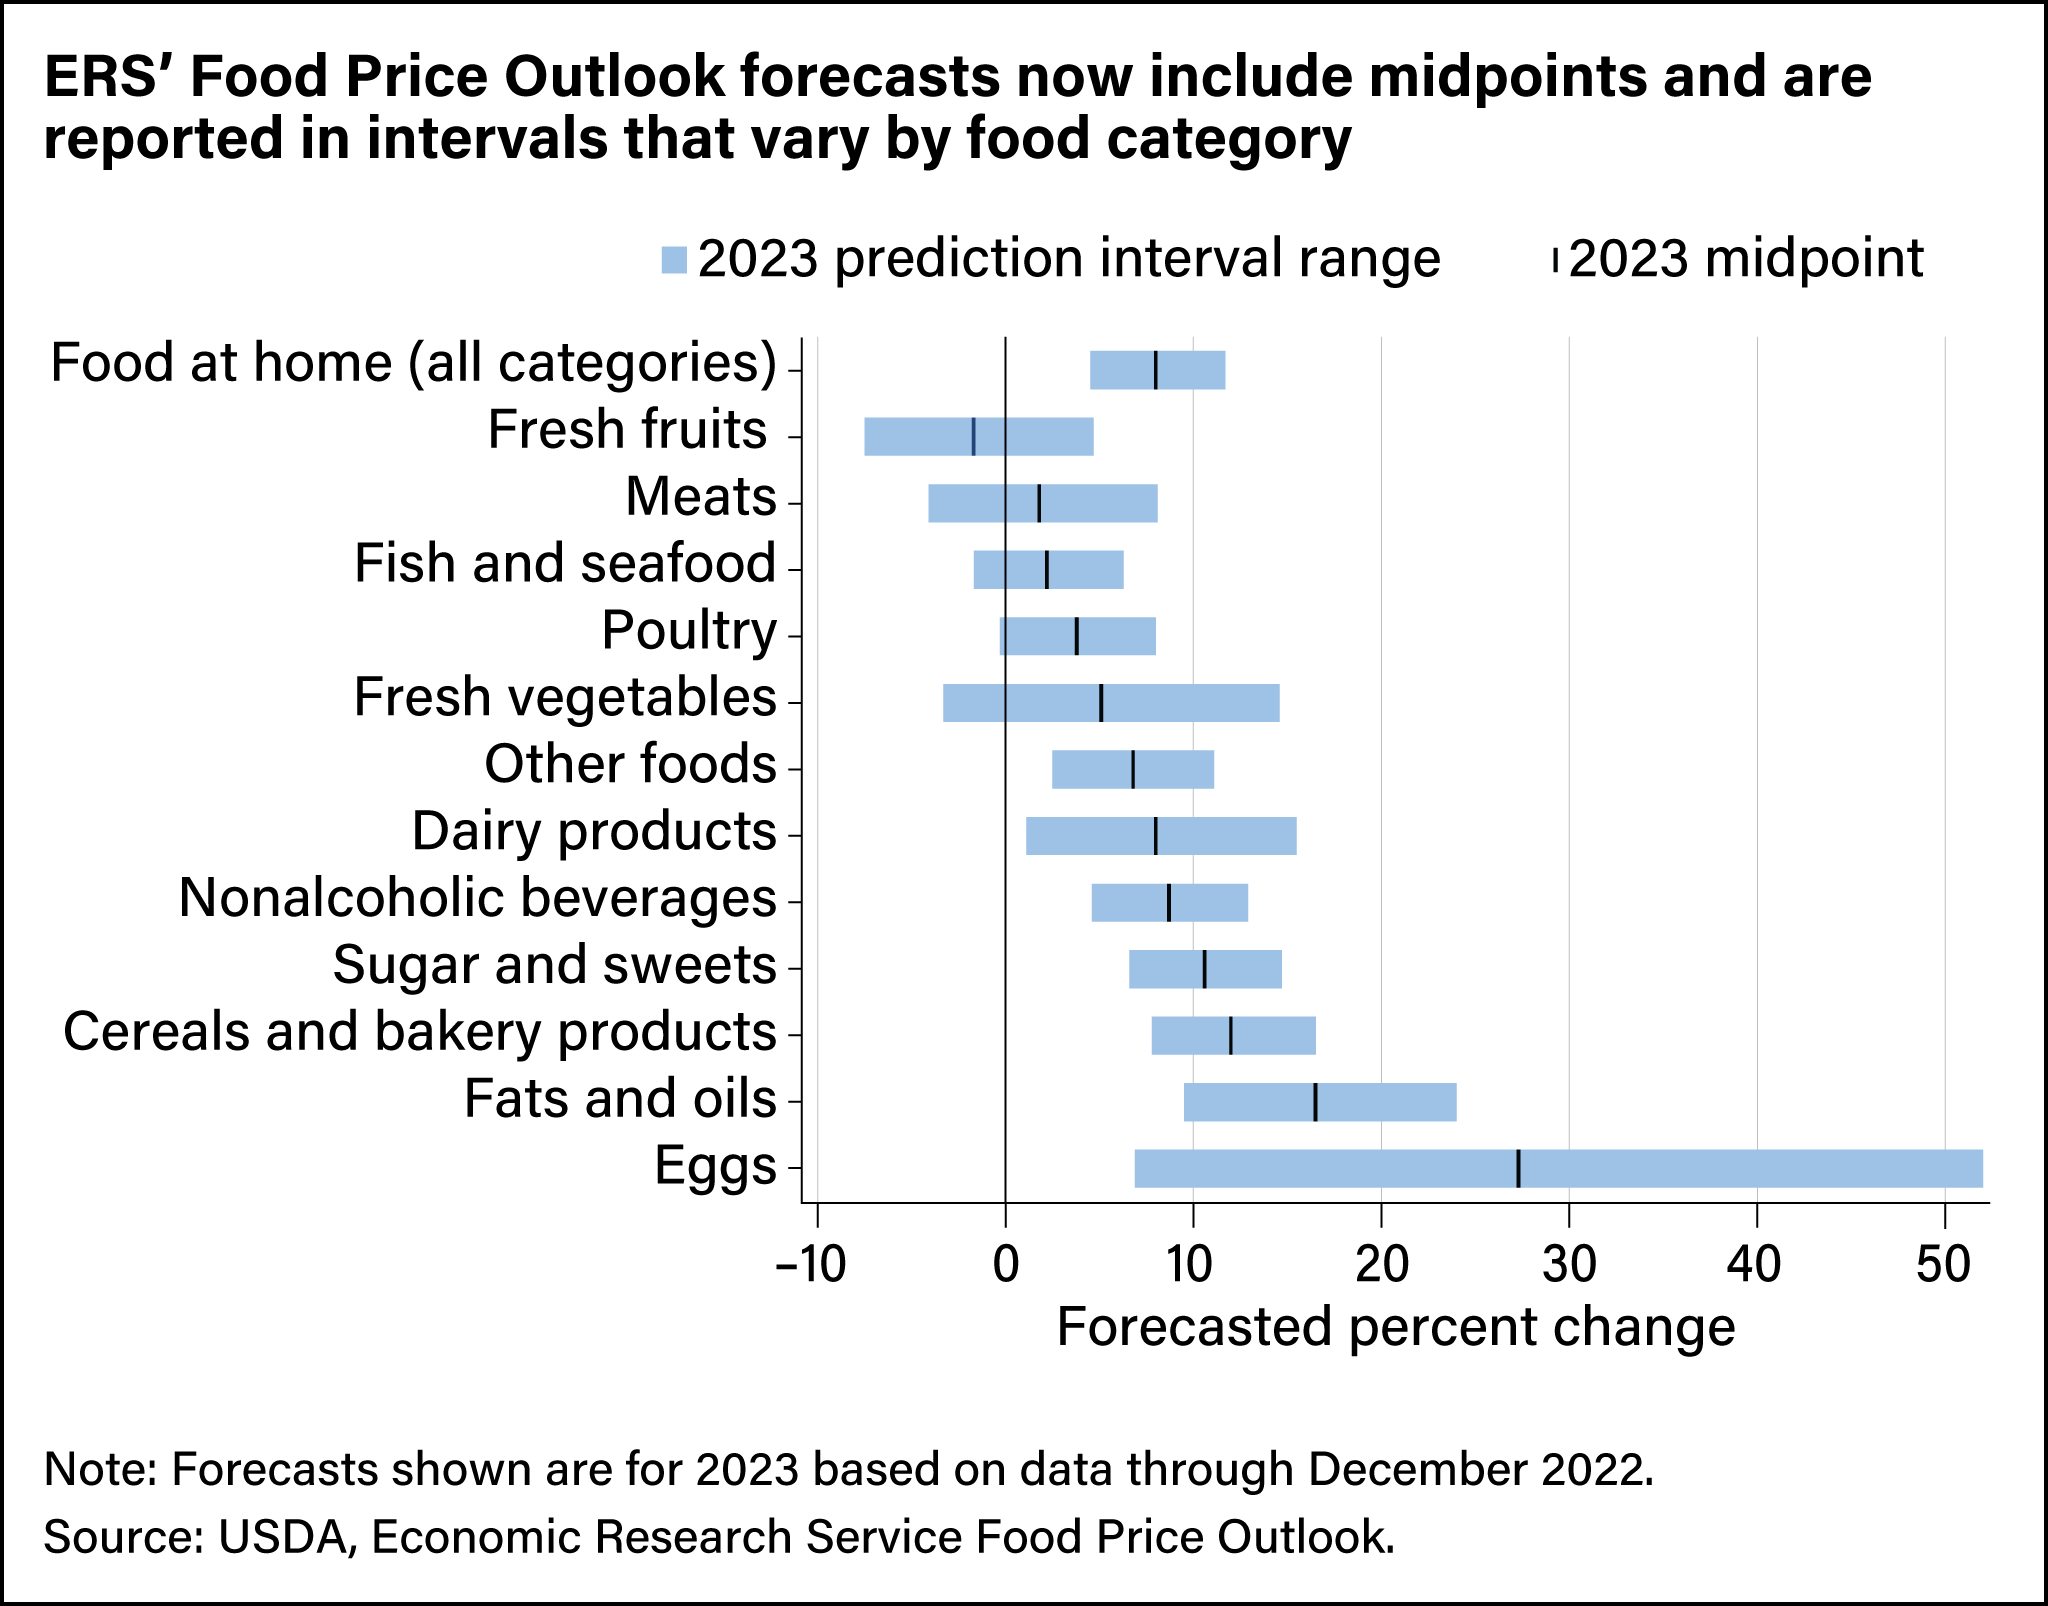
Historically, FPO forecasts have used 1-percent forecast ranges for retail food categories (such as prices are predicted to increase between 2 and 3 percent) and 3-percent ranges for farm and wholesale food categories. The FPO had reported forecasts using these uniform ranges no matter how far into the future the forecast covered, whether it was 1 month or 18 months. The new method developed by ERS presents food price forecasts as a midpoint and a prediction interval (similar to a forecast range). The intervals vary in size based on the level of uncertainty about the forecast. In addition, while the legacy method used uniform forecast ranges across all food categories, the updated method allows the size of the prediction interval to vary for different food categories based on available information and the difficulty of accurate predictions for each food category.
| Consumer Price Index item | 2023 forecast range of percentage change | ||
|---|---|---|---|
| Lower | Mid | Upper | |
| All food | 4.2 | 7.1 | 10.1 |
|
Food away from home
|
6.7 | 8.2 | 9.7 |
|
Food at home
|
4.5 | 8.0 | 11.7 |
|
Meats, poultry, and fish
|
-3.6 | 1.8 | 7.7 |
|
Meats
|
-4.1 | 1.8 | 8.1 |
|
Beef and veal
|
-10.4 | -1.8 | 8.0 |
|
Pork
|
-10.3 | -3.0 | 5.1 |
|
Other meats
|
7.1 | 12.8 | 18.7 |
|
Poultry
|
-0.3 | 3.8 | 8.0 |
|
Fish and seafood
|
-1.7 | 2.2 | 6.3 |
|
Eggs
|
6.9 | 27.3 | 52.0 |
|
Dairy products
|
1.1 | 8.0 | 15.5 |
|
Fats and oils
|
9.5 | 16.5 | 24.0 |
|
Fruits and vegetables
|
-2.6 | 2.0 | 7.1 |
|
Fresh fruits and vegetables
|
-4.6 | 1.0 | 7.0 |
|
Fresh fruits
|
-7.5 | -1.7 | 4.5 |
|
Fresh vegetables
|
-3.3 | 5.1 | 14.6 |
|
Processed fruits and vegetables
|
4.1 | 9.6 | 15.3 |
|
Sugar and sweets
|
6.6 | 10.6 | 14.7 |
|
Cereals and bakery products
|
7.8 | 12.0 | 16.5 |
|
Nonalcoholic beverages
|
4.6 | 8.7 | 12.9 |
|
Other foods
|
2.5 | 6.8 | 11.1 |
| Note: Forecast using data through December 2022. Source: USDA, Economic Research Service. |
|||
Prediction Intervals Illustrate Uncertainty in Price Forecasts
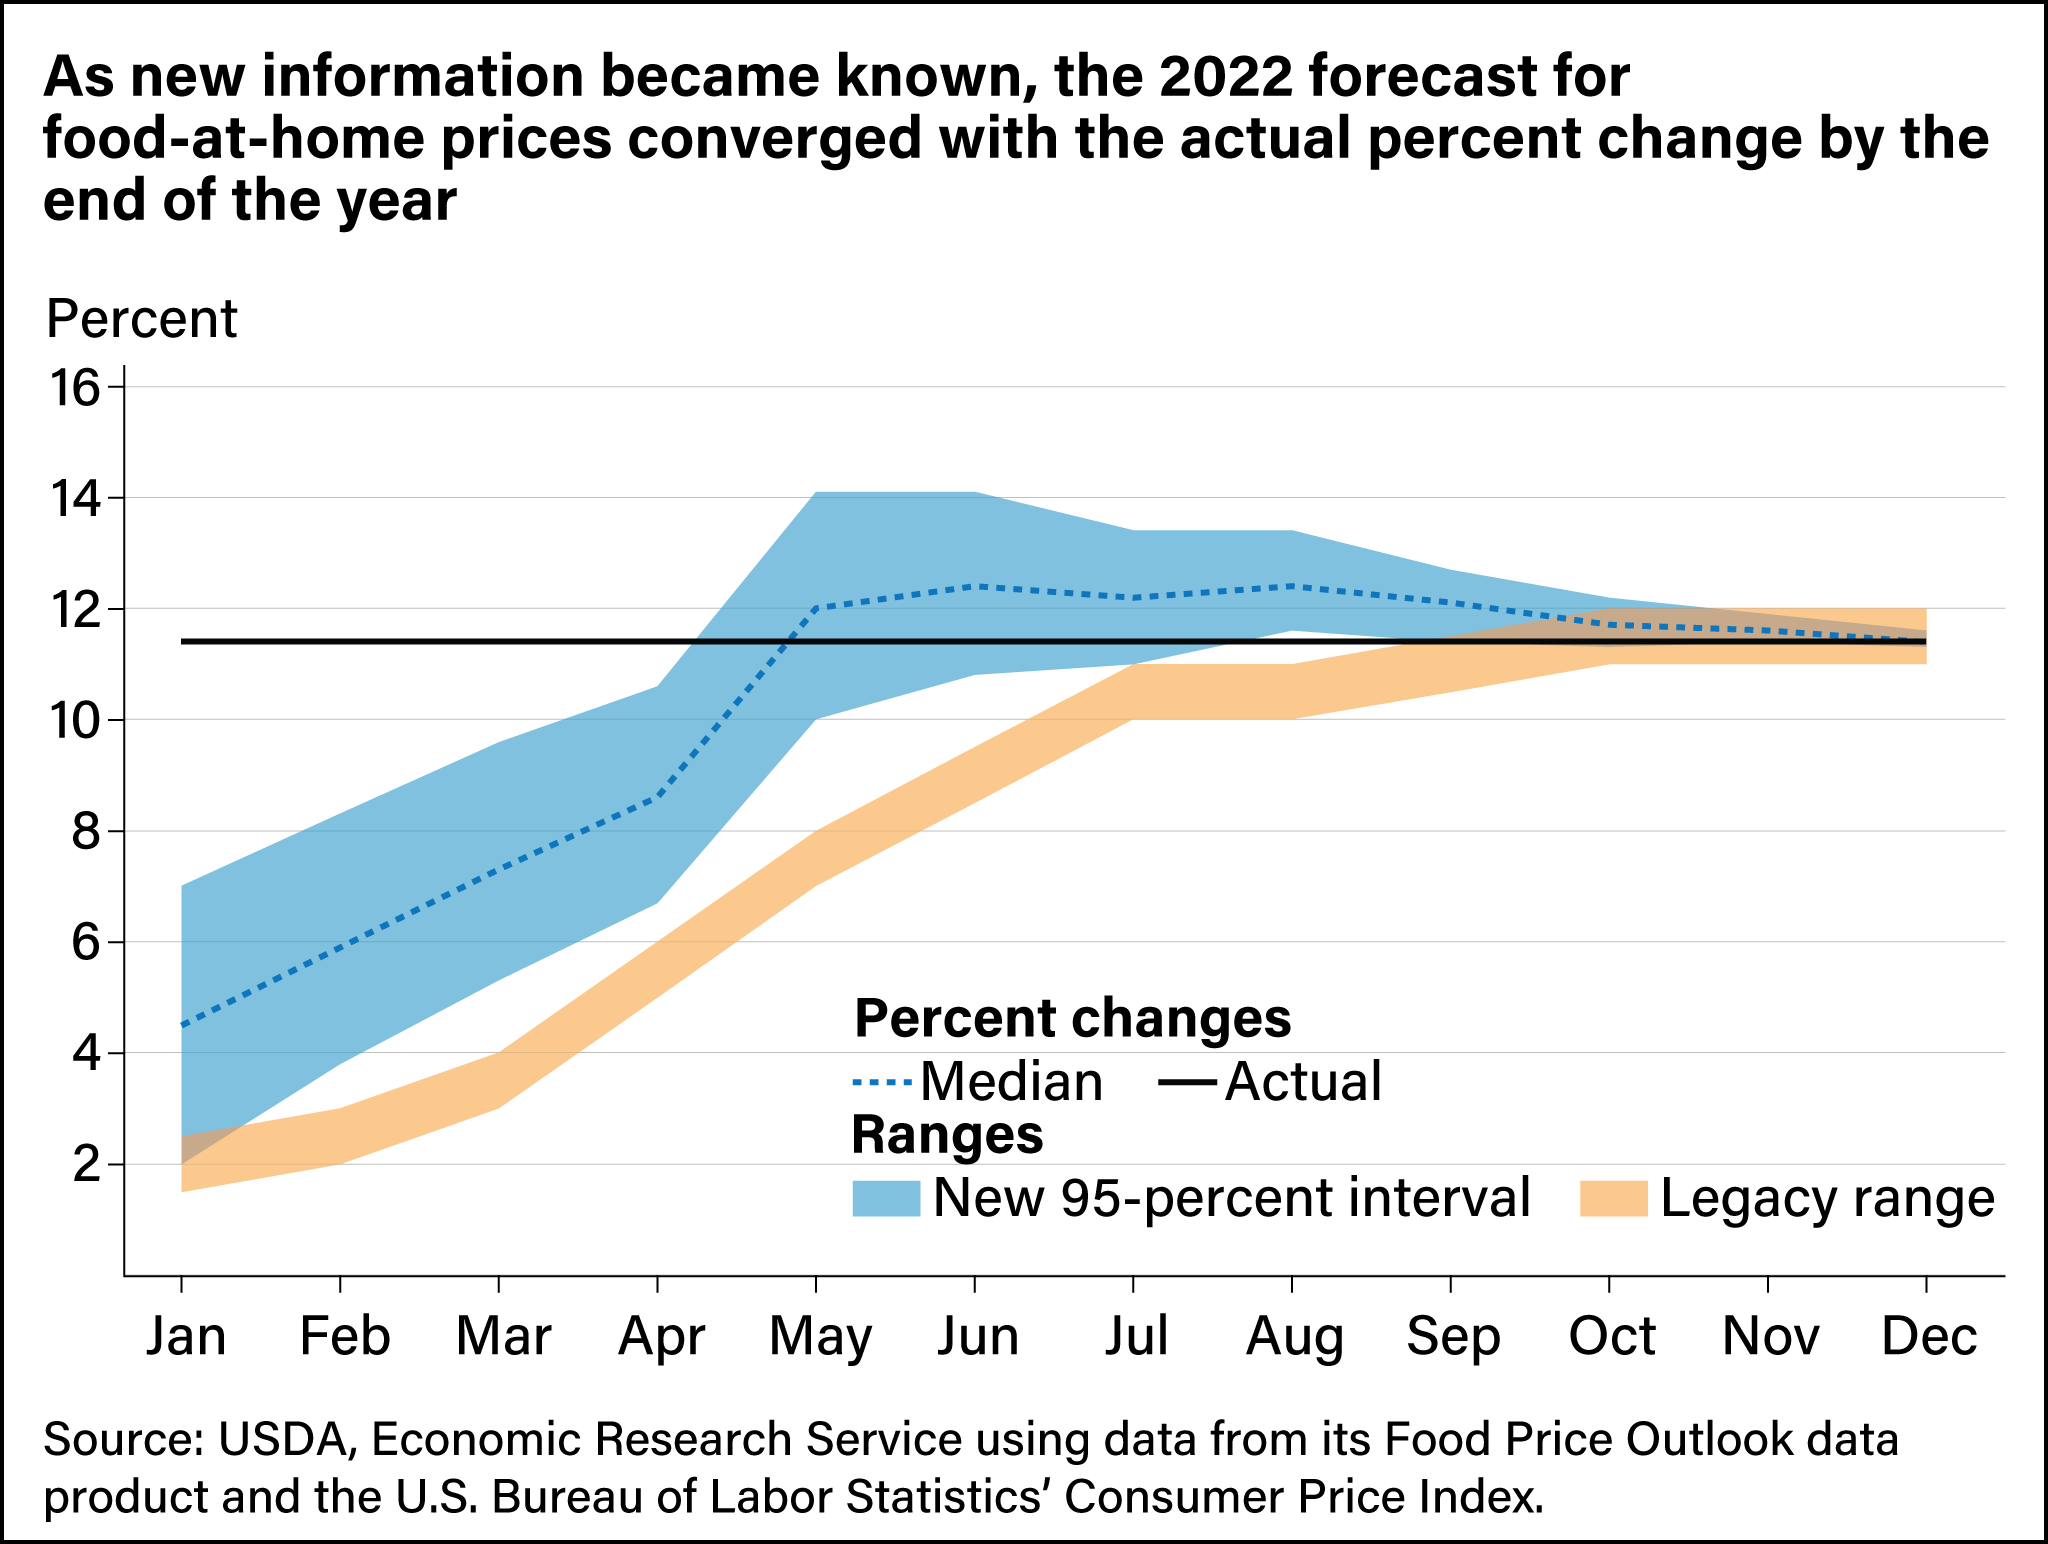
Using the updated method, prediction intervals start out wider at the beginning of the year and narrow as forecasts incorporate more months of observed data and the forecast period shortens. Researchers applied the updated forecasting method to previous years to test how it compared with the legacy method. The charts below illustrate the differences in the two methods, showing how they forecast food-at-home prices in 2022. The blue band represents the new prediction interval at a 95-percent confidence level, and the dashed line is the midpoint of the interval. The yellow band is the legacy forecast range method. The solid line is the actual change in prices for that year.
Across food categories and years, the updated method captures the actual percent change in prices more frequently. When using the legacy method from 2011 to 2020, about 16 percent of the forecast ranges developed a year in advance included the actual percent change in retail food prices. With the new approach for the same years, about 86 percent of prediction intervals contained the actual percent change in retail food prices using a 95-percent prediction interval.
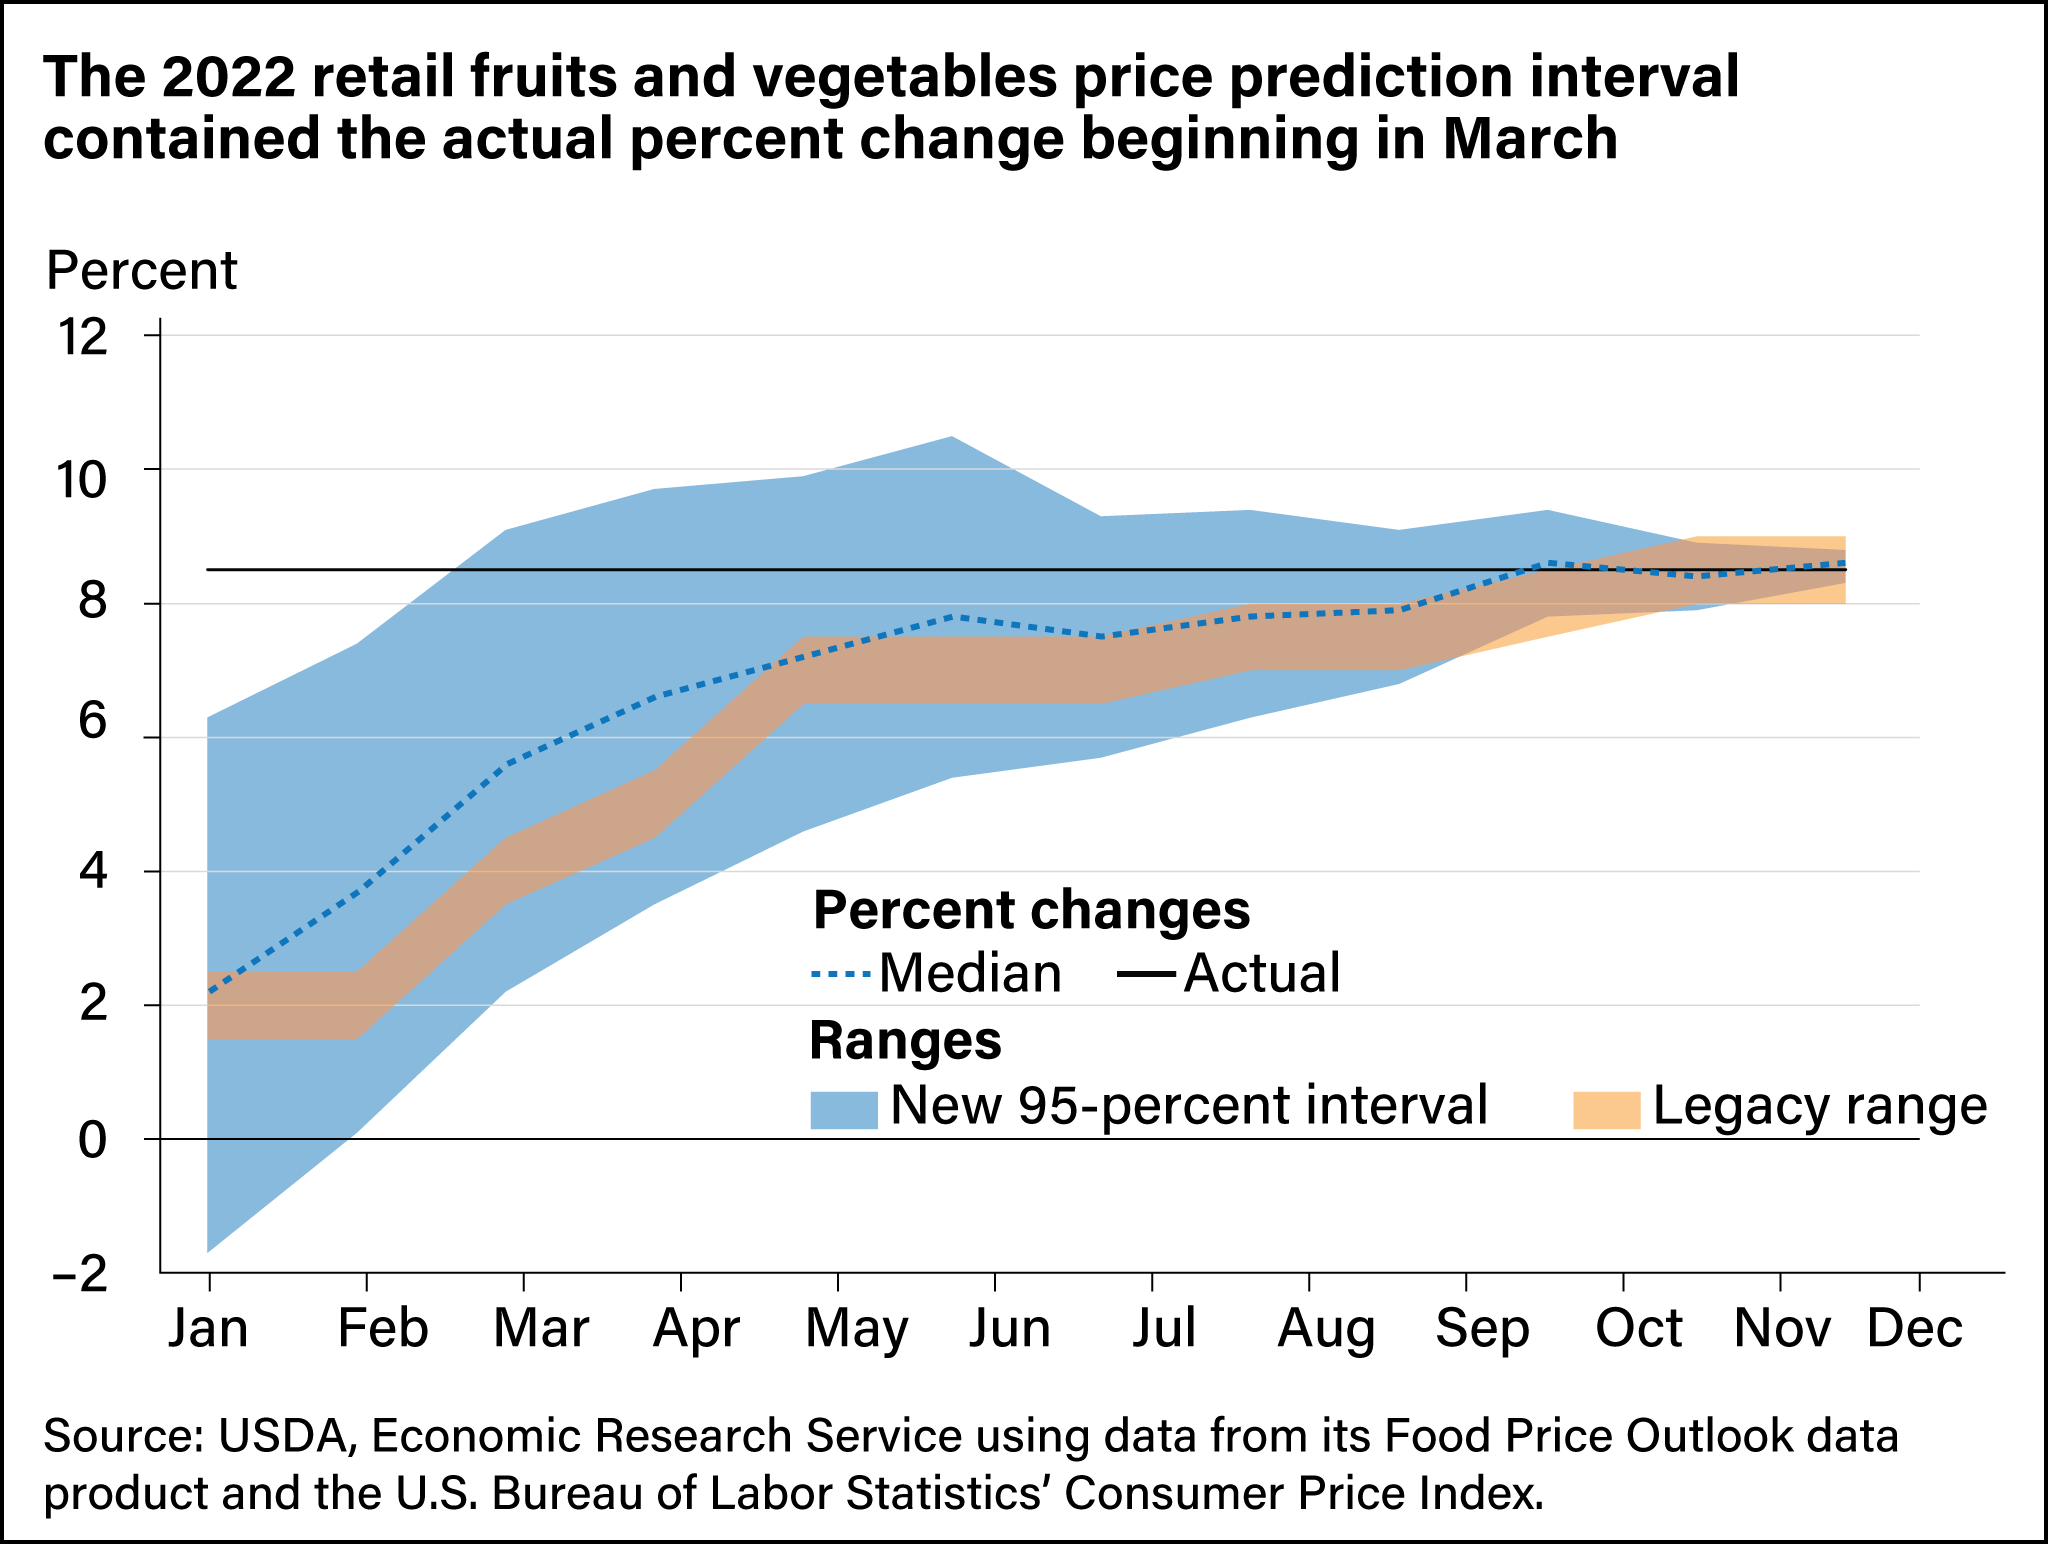
Seasonality, long-term trends, and volatility differ across food categories, and the updated methods account for these differences in the predictions. For example, fruits and vegetables often experience large price changes and can be difficult to forecast. Between 2011 and 2020, two of the legacy forecast ranges for fruits and vegetables developed a year in advance included the actual annual change in prices, compared to all years for the new method. The new method incorporates that high degree of uncertainty into the forecast ranges. In 2022, fruits and vegetables had a wide prediction interval at the beginning of the year, and the interval contained the actual percent change beginning in March, despite high volatility in prices in 2022.
In part, the prediction intervals capture the actual change in prices more frequently because they can begin with a wider range early in the year. The width reflects the distance between past predictions and actual changes in food prices. The new methods and wider prediction intervals of the updated FPO reflect a more informative and credible measure of uncertainty compared with the legacy forecast methods and ranges that were more precise but predicted the actual change in prices less often.
This article is drawn from:
- Food Price Outlook. (n.d.). U.S. Department of Agriculture, Economic Research Service.
- MacLachlan, M., Chelius, C. & Short, G. (2022). Time-Series Methods for Forecasting and Modeling Uncertainty in the Food Price Outlook. U.S. Department of Agriculture, Economic Research Service. TB-1957.


