Unpriced Corn Inventories Higher Than Other Commodities After 2019 Harvest, Study of Pandemic-Related Situation Shows
- by Noah Miller, Anil K. Giri and Dipak Subedi
- 12/11/2023
Among the disruptions from the Coronavirus (COVID-19) pandemic in early 2020 were reduced demand for food because of lockdowns, interruptions in meat supply chains after plant closures, and breaks in normal shipping patterns. Those events led to sharp declines in agricultural commodity prices. To help U.S. farmers mitigate the effects of lower commodity prices, Congress created the Coronavirus Food Assistance Program. The program’s first round (CFAP 1) made direct payments to producers who held unpriced inventories of their commodities and faced price declines of 5 percent or more between the weeks of January 13 and April 6, 2020. The payments were based on a commodity-specific per-unit rate multiplied by 50 percent of the farm’s 2019 production or its unpriced inventory as of January 15, 2020 (whichever was lower). To understand how much unpriced inventory producers held during this period, researchers with USDA, Economic Research Service examined producer responses from the 2019 Agricultural Resource Management Survey (ARMS).
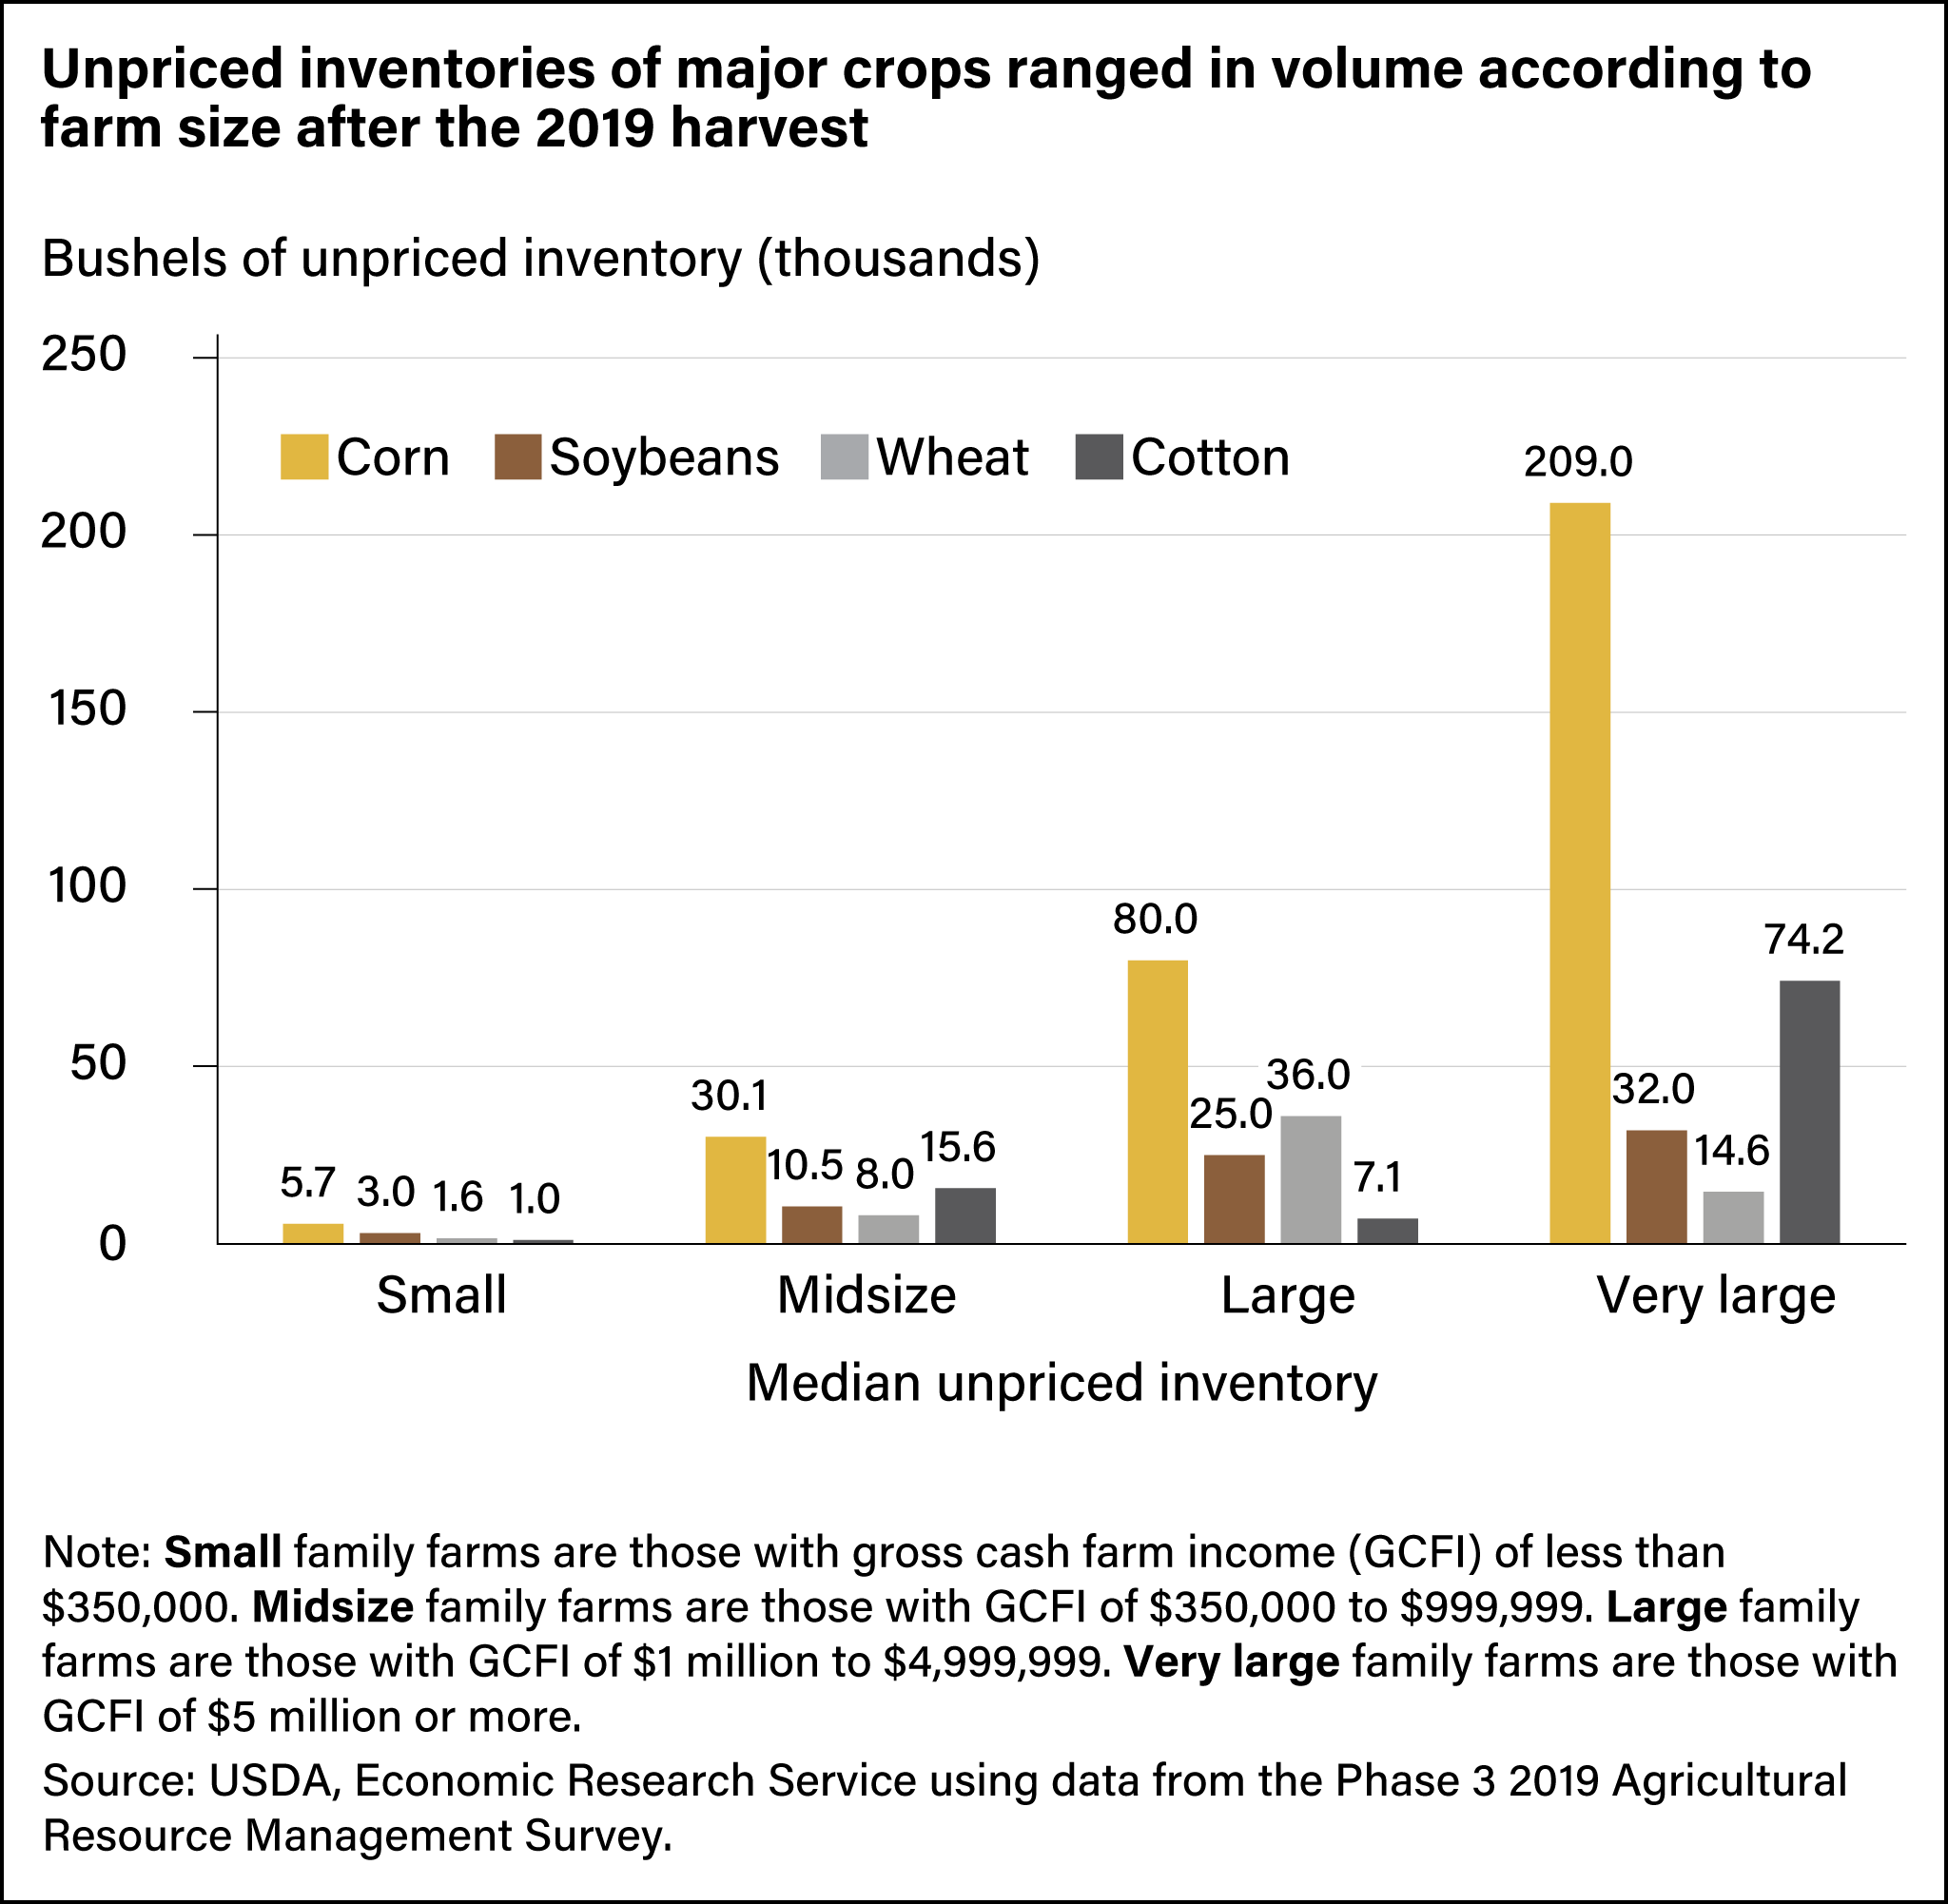
The survey asked a nationally representative sample of producers in early 2020 to report the amount of unpriced inventory they held after the 2019 harvest (used as a proxy for unpriced inventory on January 15, 2020). The median volume of unpriced corn inventory exceeded that of all other unpriced crops and increased with farm size, ranging from 5,700 bushels for small farms to 209,000 bushels for very large farms. In comparison, the median quantity of unpriced soybeans held was, on average, 33.7 percent of the amount of corn held. ERS researchers did not examine the reasons for the differences in unpriced inventory levels for corn and soybeans, which may be due to differences in yields and prices. Very large farms held the largest median quantity of unpriced soybeans (32,000 bushels). For the other crops, large farms held the largest amount of unpriced wheat inventory (36,000 bushels) and very large farms held the largest amount of unpriced cotton inventory (74,200 bushels). Corn, soybeans, wheat, and cotton accounted for more than half of total crop cash receipts in 2020 and the vast majority of CFAP 1 payments.
This article is drawn from:
- Miller, N., Giri, A.K., Subedi, D. & Williams, R. (2023). COVID-19 Working Paper: Unpriced Commodity Inventory and COVID-19 Pandemic Assistance. U.S. Department of Agriculture, Economic Research Service. AP-117.
You may also like:
- Giri, A.K., McDonald, T.M., Subedi, D. & Whitt, C. (2021, September 7). U.S. Agriculture Sector Received an Estimated $35 Billion in COVID-19-Related Assistance in 2020. Amber Waves, U.S. Department of Agriculture, Economic Research Service.
- Giri, A.K., Subedi, D. & McDonald, T.M. (2021, October 4). U.S. Farm Producers Received Almost $6 Billion From the Paycheck Protection Program in 2020. Amber Waves, U.S. Department of Agriculture, Economic Research Service.
- Giri, A.K., Litkowski, C., Subedi, D. & McDonald, T.M. (2023, August 9). U.S. Farm Sector Financial Measures Show Little Variation From Prepandemic Expectations. Amber Waves, U.S. Department of Agriculture, Economic Research Service.


