India and Mexico Top Sources of Pathogen-Based U.S. Food Import Refusals
- by Jae-Wan Ahn
- 2/7/2022
Food can be contaminated with pathogens or toxins that can cause illnesses which produce symptoms ranging from nausea, vomiting, and diarrhea to more serious outcomes, such as renal failure, paralysis, and even death. As a matter of public health, it is imperative to minimize these foodborne illness risks to U.S. consumers, including from imported foreign food products. The amount of imported food for U.S. consumption has grown nearly 80 percent from 2002 to more than 65 million tons in 2019, according to USDA’s Global Agricultural Trade System. The U.S. Food and Drug Administration (FDA) estimated that annual consumption of foreign foods in the United States accounted for approximately 94 percent of seafood, 55 percent of fresh fruit, and 32 percent of fresh vegetables, as measured by volume of total food consumed.
As part of its U.S. food safety oversight, the FDA inspects imported foods at the border or port of entry. FDA physically examines approximately 1 to 2 percent of imported foods, with the exception of meat, poultry, and egg products, which are inspected by USDA. Shipments are subject to refusal into the United States if an inspector identifies an adulteration such as poisonous ingredients, disease-causing bacteria and viruses, unsafe color additives, pesticide residues, or apparent filth. Shipments may also be refused for misbranding violations, which includes false or misleading ingredients labels, origin/manufacturer information, or quality of ingredients concerns. A recent study by USDA, Economic Research Service (ERS) examined the number of import refusals for nine pathogen and toxin violations: aflatoxin, E. coli O157, Hepatitis A, histamine, Listeria, patulin, Salmonella, Shigella, and Vibrio.
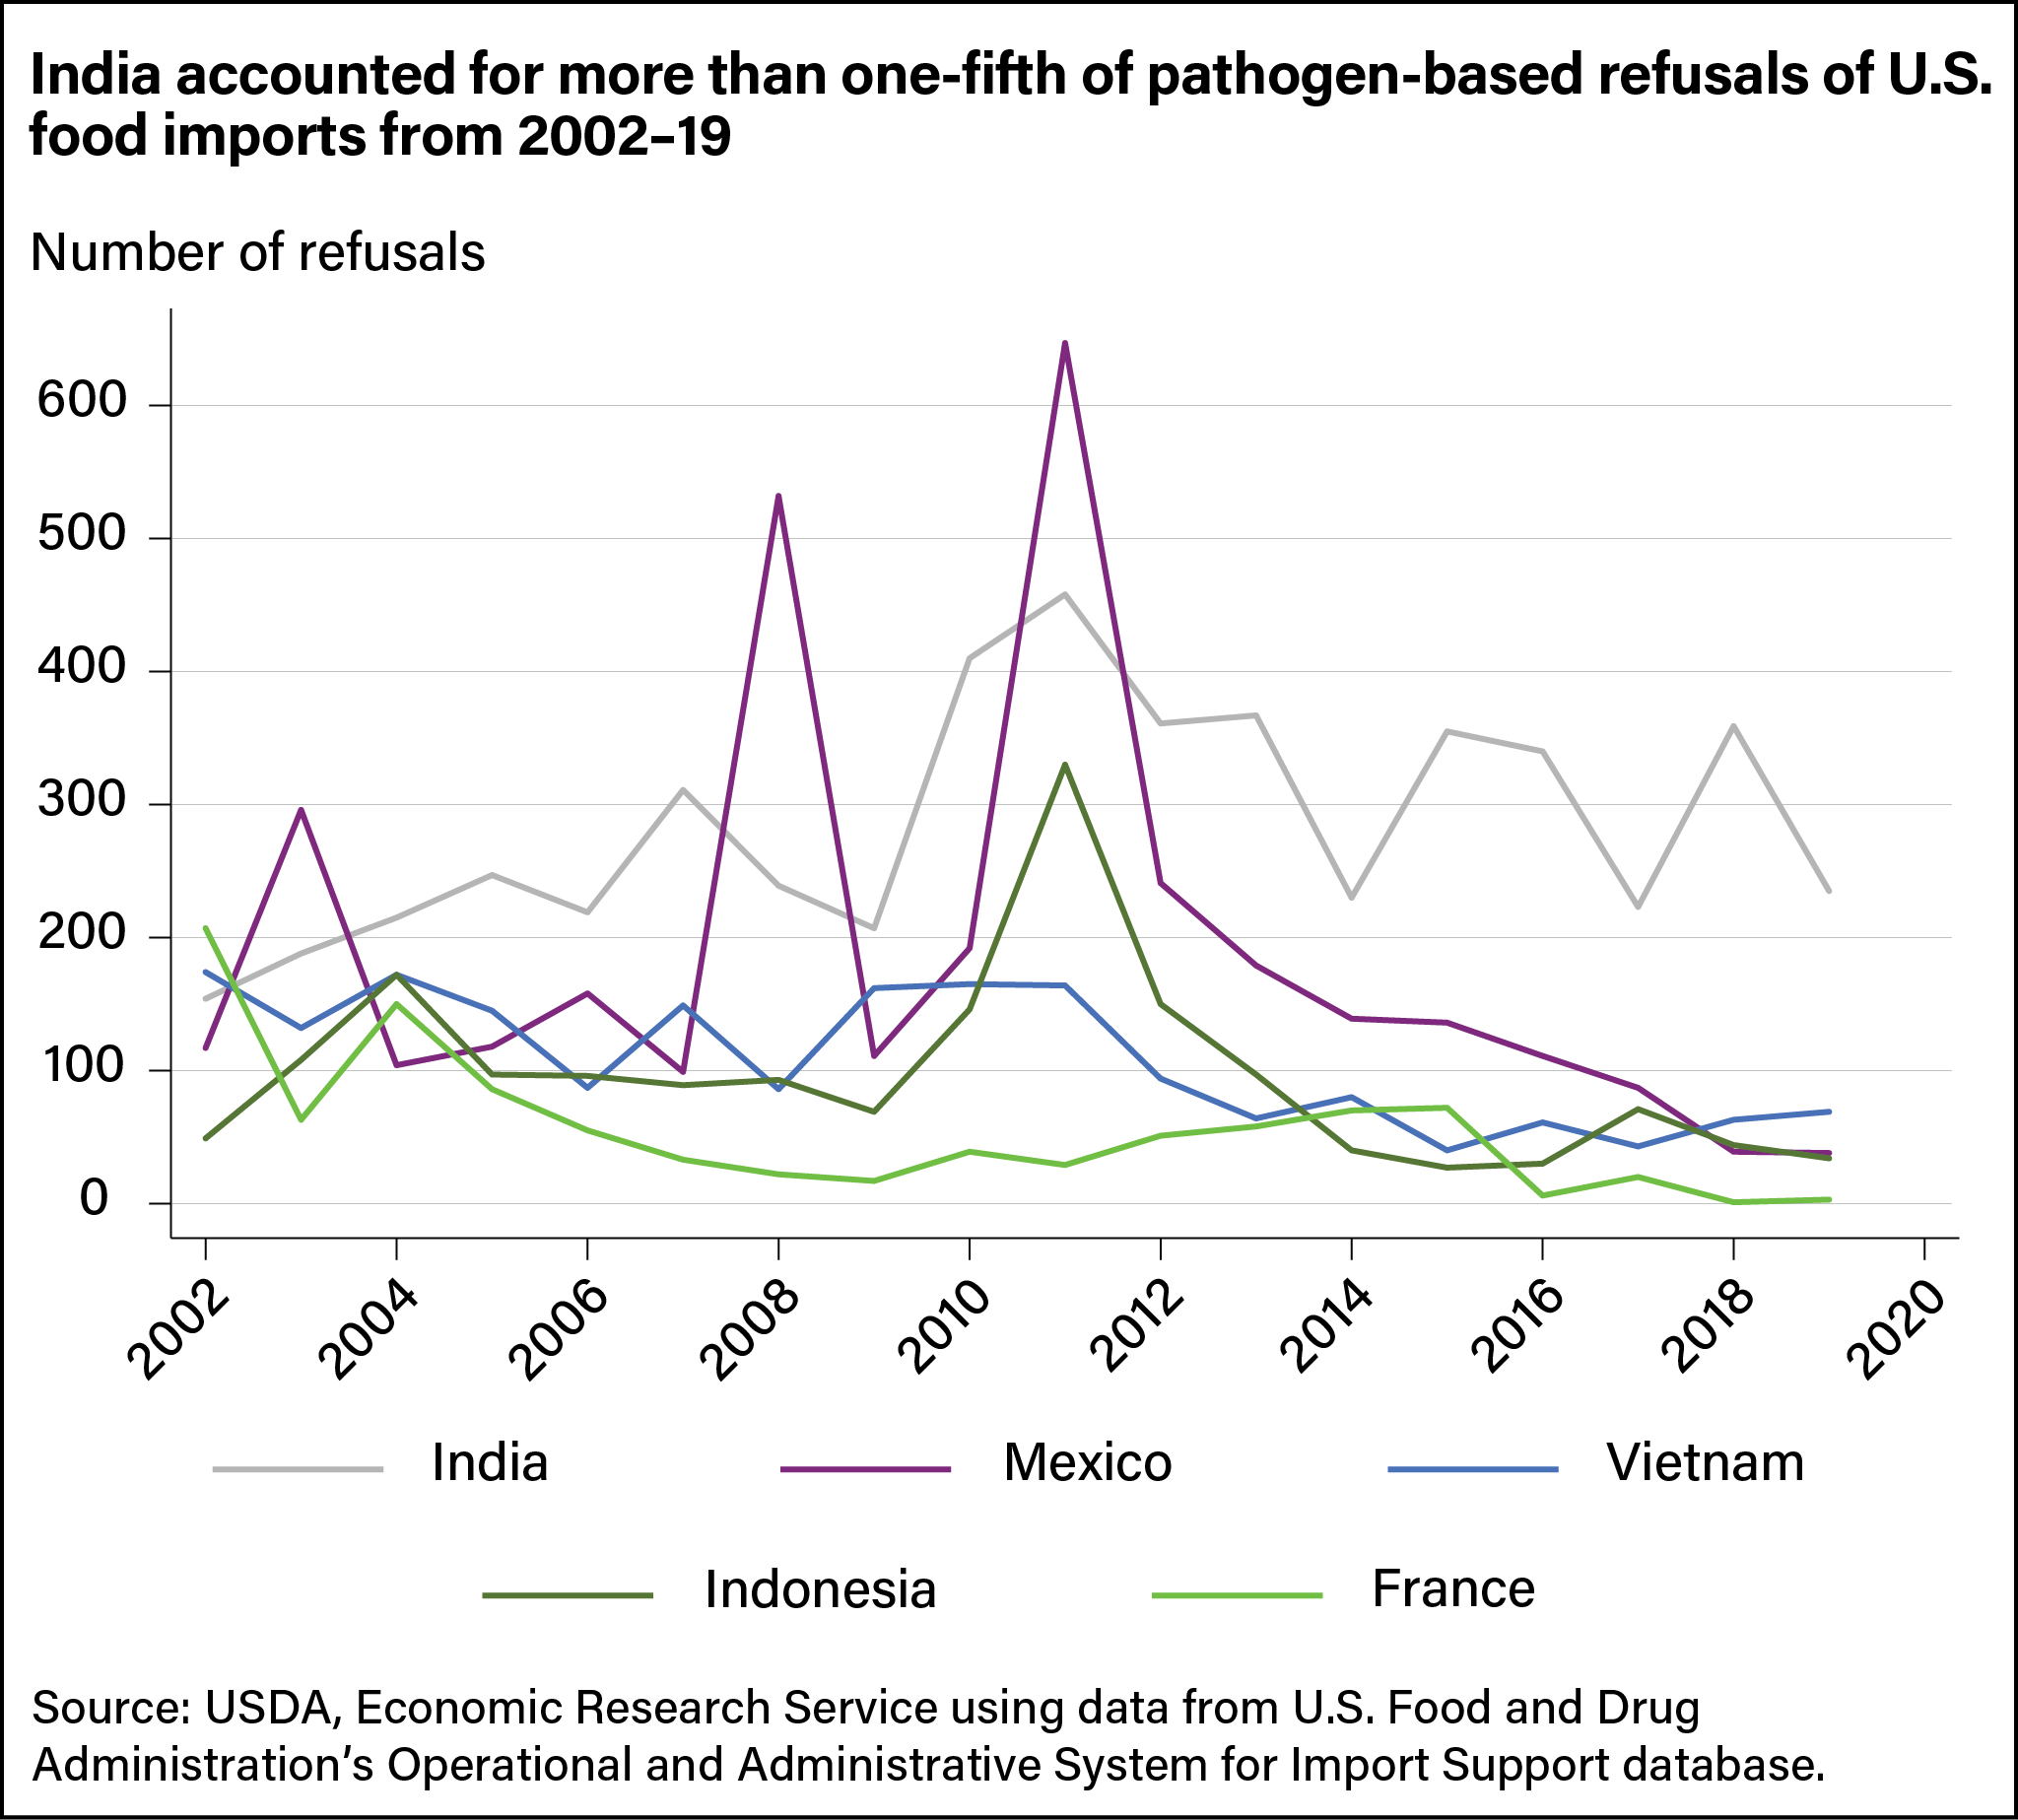
This study found that more than 22,000 pathogen and toxin violations were identified from 110 countries during 2002–19. Over the study period, India had the most pathogen-related violations with 5,115 refusals. This totaled 22.9 percent of overall import refusals for pathogen/toxin violations. Mexico had the second-most food import refusals with 3,338 (14.9 percent), followed by Vietnam with 1,929 (8.6 percent), Indonesia with 1,736 (7.8 percent), and France with 971 (4.3 percent).
The figure below shows annual violations from the countries with the most frequent detections. France and Vietnam have a relatively stable rate of violations over the study time period, with a slightly downward trend. On the other hand, the number of imported food refusals from Mexico, India, and to a lesser extent, Indonesia, fluctuated significantly over time. In 2008, there was a spike in violations from Mexican imports, mostly among spices, flavors, and salts, before sharply decreasing. A second spike occurred among all three countries—Mexico, India, and Indonesia—in 2011. The 2011 spike in import refusals were mainly from Salmonella violations. Three industry categories led those spikes: fishery and seafood; spices, flavors, and salts; and fruit.
The total volume of imported foods from Mexico increased 45 percent in recent years, from 10.5 million tons in 2012 to 15.3 million tons in 2019. Despite this, the number of pathogen and toxin violations dropped from 241 in 2012 to 38 in 2019, an 85-percent decrease. And even though Mexico had the most refusals in 2008 and 2011, shipments from India were denied more frequently than those from other countries over the entire study period. These violations were primarily from Salmonella contamination.
This article is drawn from:
- Ahn, J. & Rhodes, M.T. (2021). Examining Pathogen-Based Import Refusals: Trends and Analysis From 2002 to 2019. U.S. Department of Agriculture, Economic Research Service. EIB-232.
You may also like:
- Bovay, J. (2016, March 28). Patterns in FDA Food Import Refusals Highlight Most Frequently Detected Problems. Amber Waves, U.S. Department of Agriculture, Economic Research Service.
- Bovay, J. (2016). FDA Refusals of Imported Food Products by Country and Category, 2005-2013. U.S. Department of Agriculture, Economic Research Service. EIB-151.
- Buzby, J.C., Unnevehr, L. & Roberts, D. (2008). Food Safety and Imports: An Analysis of FDA Import Refusal Reports. U.S. Department of Agriculture, Economic Research Service. EIB-39.


