USDA’s Purchase to Plate Price Tool Estimates Food Costs for National Food Intake Data
- by Andrea Carlson, Elina T. Page and Rosanna Mentzer Morrison
- 11/2/2020
Benefits for the Supplemental Nutrition Assistance Program (SNAP), USDA’s largest food assistance program, are determined by the cost of the Thrifty Food Plan. The Thrifty Food Plan, one of four food plans designed by USDA, specifies the types and quantities of commonly consumed foods that people can purchase and prepare at home to obtain a nutritious diet at a minimal cost. The most recent 2018 Farm Bill mandated that the basket of foods that make up the Thrifty Food Plan be updated every 5 years using current food prices, food consumption patterns, the composition of foods, and dietary guidance.
Researchers from two USDA agencies—the Economic Research Service (ERS) and the Center for Nutrition Policy and Promotion—recently collaborated on a project to support USDA’s effort to determine the food prices needed to update the Thrifty Food Plan. Their project, the Purchase to Plate Price Tool, uses grocery store scanner data to estimate the retail cost of foods and beverages participants reported eating in a national dietary intake survey. These monetary costs, in turn, can be used to calculate daily at-home food costs for Americans.
Purchase to Plate Price Tool Built From Multiple Data Sources
The National Health and Nutrition Examination Survey (NHANES), a Federal survey used to assess health and nutritional status of adults and children in the United States, includes a dietary component, What We Eat in America. Participants complete two 24-hour dietary recalls of all foods and beverages consumed. Participants record the foods they eat, but not necessarily the foods they purchase. For example, a participant who records eating a slice of meatloaf may have actually bought ground beef, eggs, breadcrumbs, and other ingredients.
Using a USDA recipe database (the Food and Nutrient Database for Dietary Studies) and conversion factors, the researchers were able to translate foods and beverages that NHANES participants reported consuming into the ingredients and ready-to-eat foods purchased from grocery stores, supercenters, convenience stores, and other food retailers (food at home). When this study began, the latest available NHANES data was from 2011-12 and provided a list of 3,542 foods and beverages for the conversion. For example, a slice of homemade apple pie gets translated into purchases of apples, sugar, flour, shortening, etc. For ready-to-eat or ready-to-heat foods, such as bread, pre-cut produce items, and frozen apple pie, the edible weight was considered to be the same as the retail weight. For some non-ready-to-eat foods and ingredients (such as many fresh fruits and vegetables), the researchers used USDA conversion factors to convert from retail weight to edible weight by accounting for the weight of inedible parts of food, such as peels, pits, shells, and bones.
The researchers then used 2013 store-level sales data from IRI, a market research company, to calculate prices for the food-at-home purchases. The sales dataset from IRI, called InfoScan, includes weekly store-level information on quantities sold and revenues earned for more than 350,000 food products sold at chain stores, such as supermarkets, supercenters, and convenience stores. The researchers matched the IRI foods to ingredients in the recipe database and then calculated average national prices for the ingredients using the IRI revenue and quantity data. These ingredient costs were then used to calculate the monetary cost of foods reported eaten by NHANES participants. By totaling the cost of the day’s consumption, researchers can estimate individual daily cost of at-home foods and beverages.
Cost of Food At Home Varies by Age and Income
The researchers found that across all ages, including male and female NHANES participants, the average daily cost for at-home food was $4.54 per person in 2013. The median daily cost—where half the participants’ at-home food costs were above and half were below—was $3.82 per person in 2013. Additionally, for half the participants, their at-home food costs were between $2.12 and $6.03 per day in 2013.
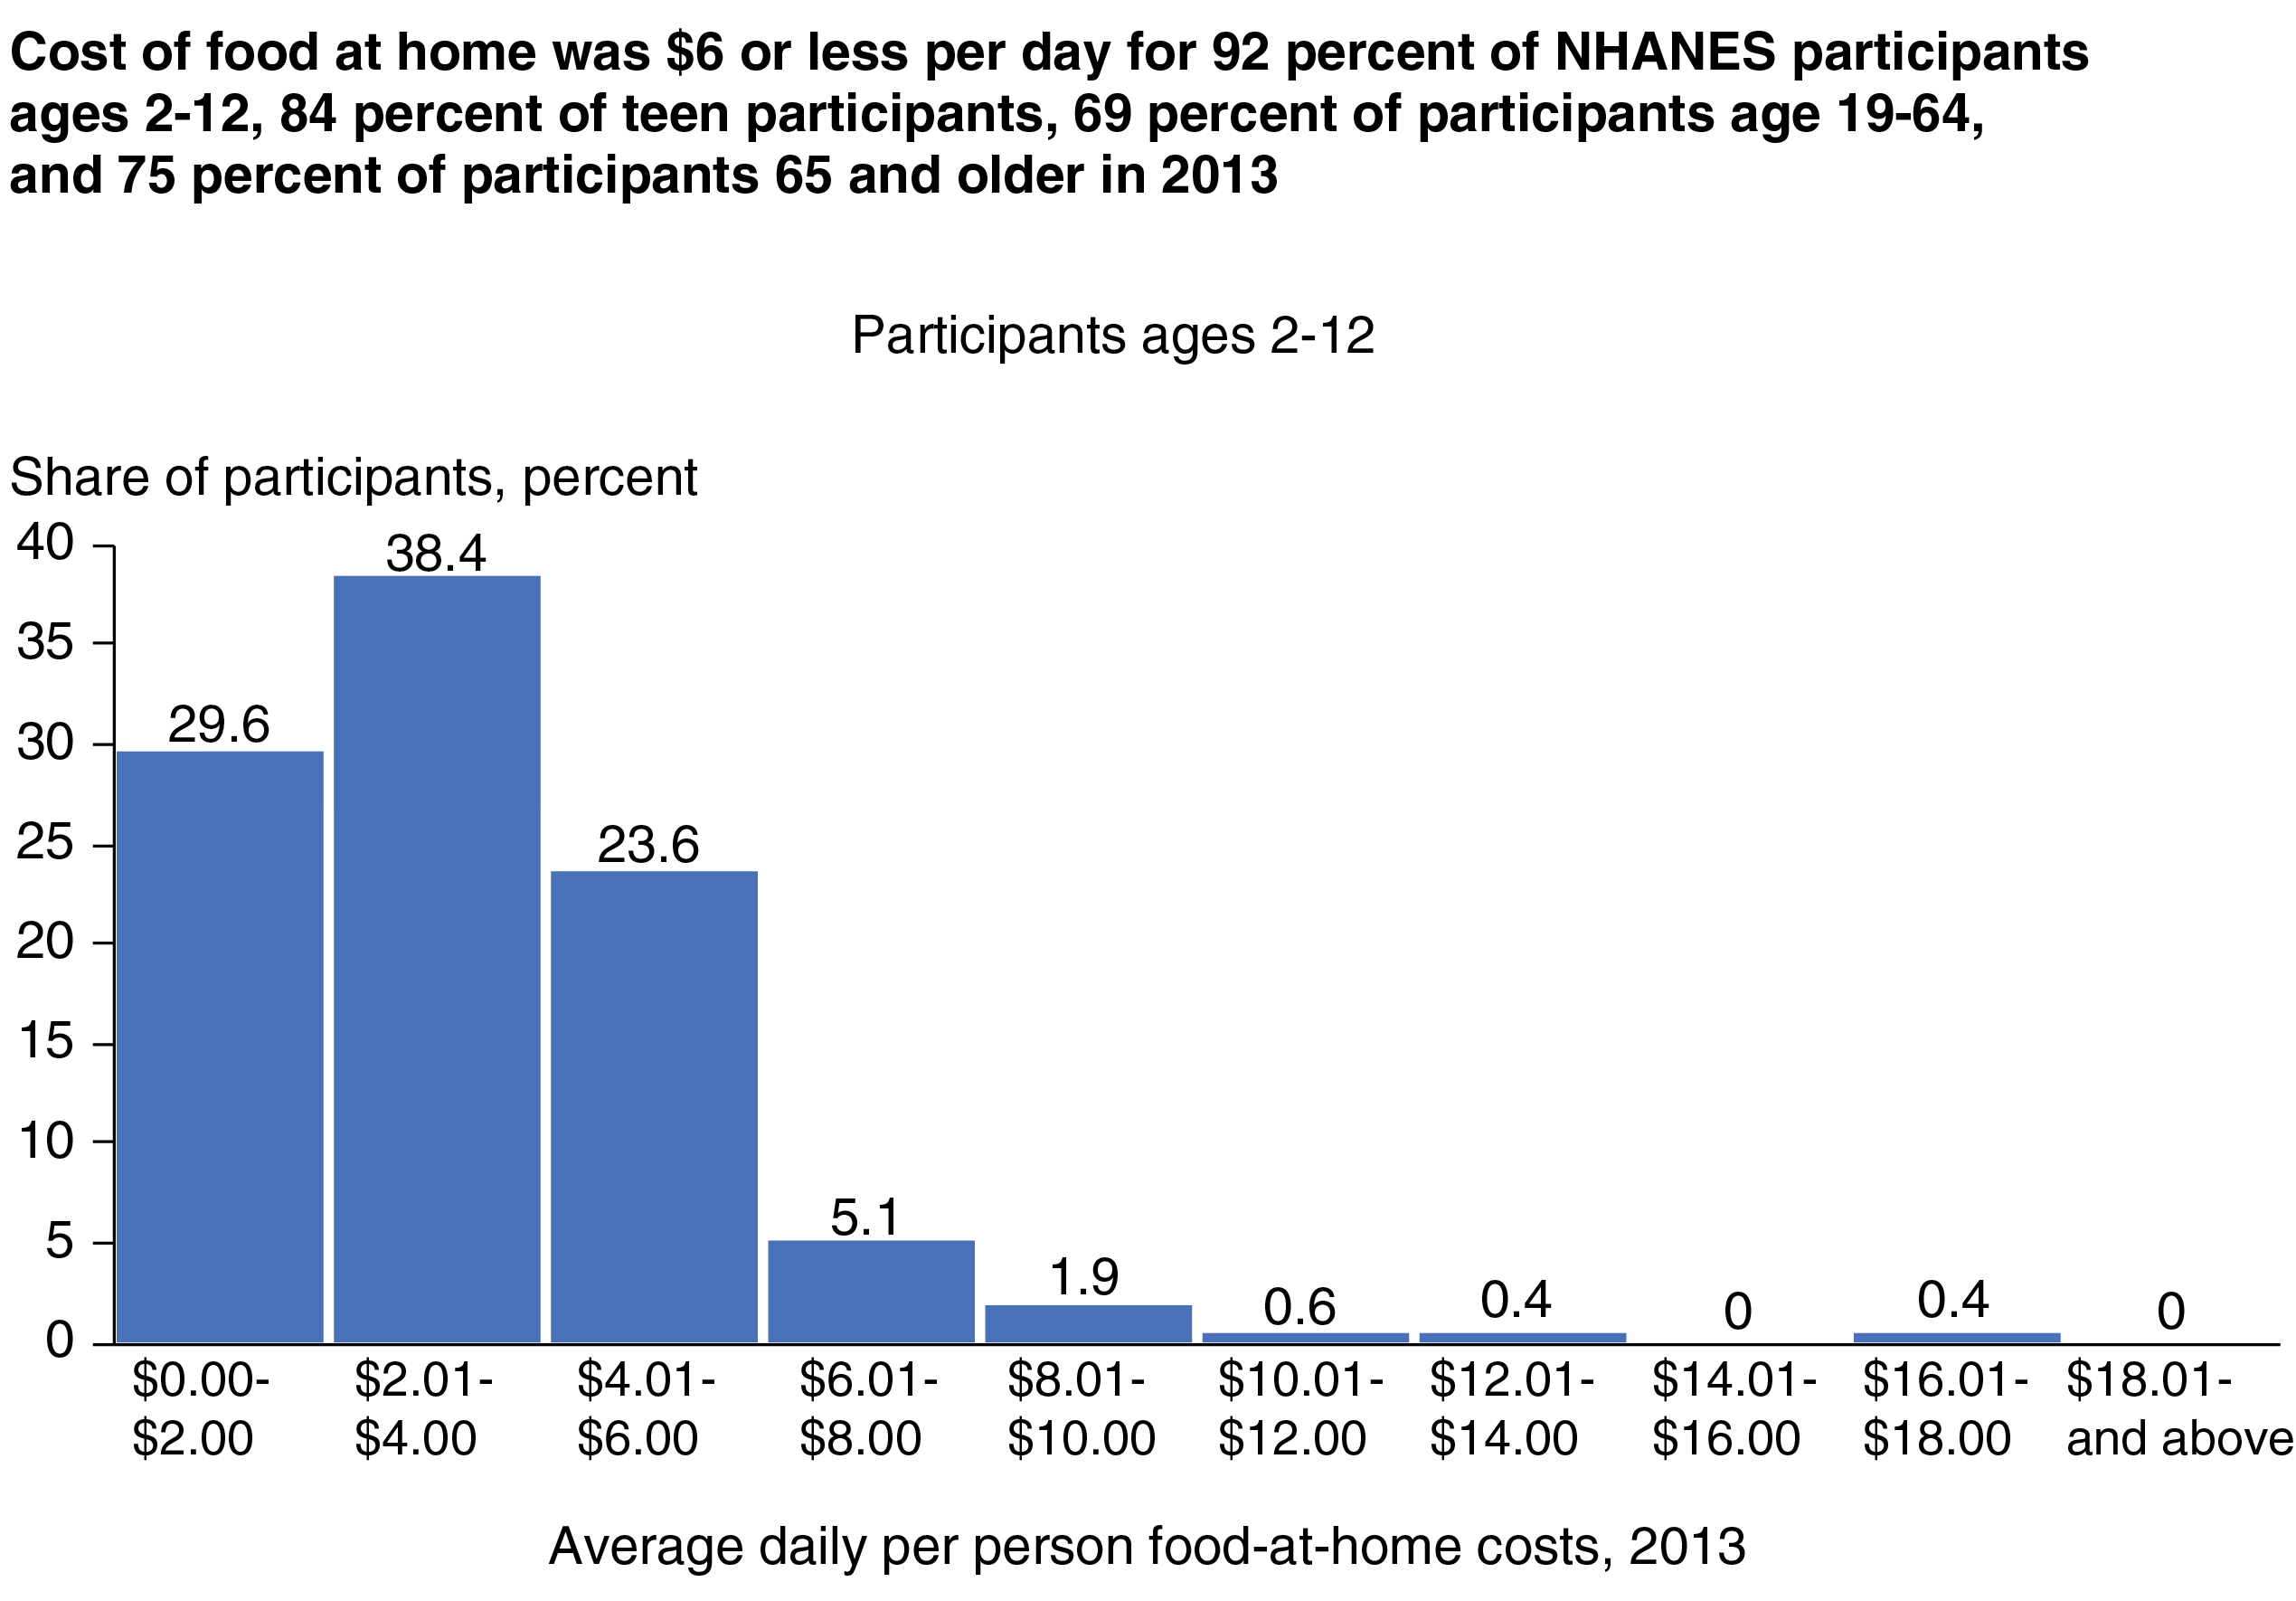
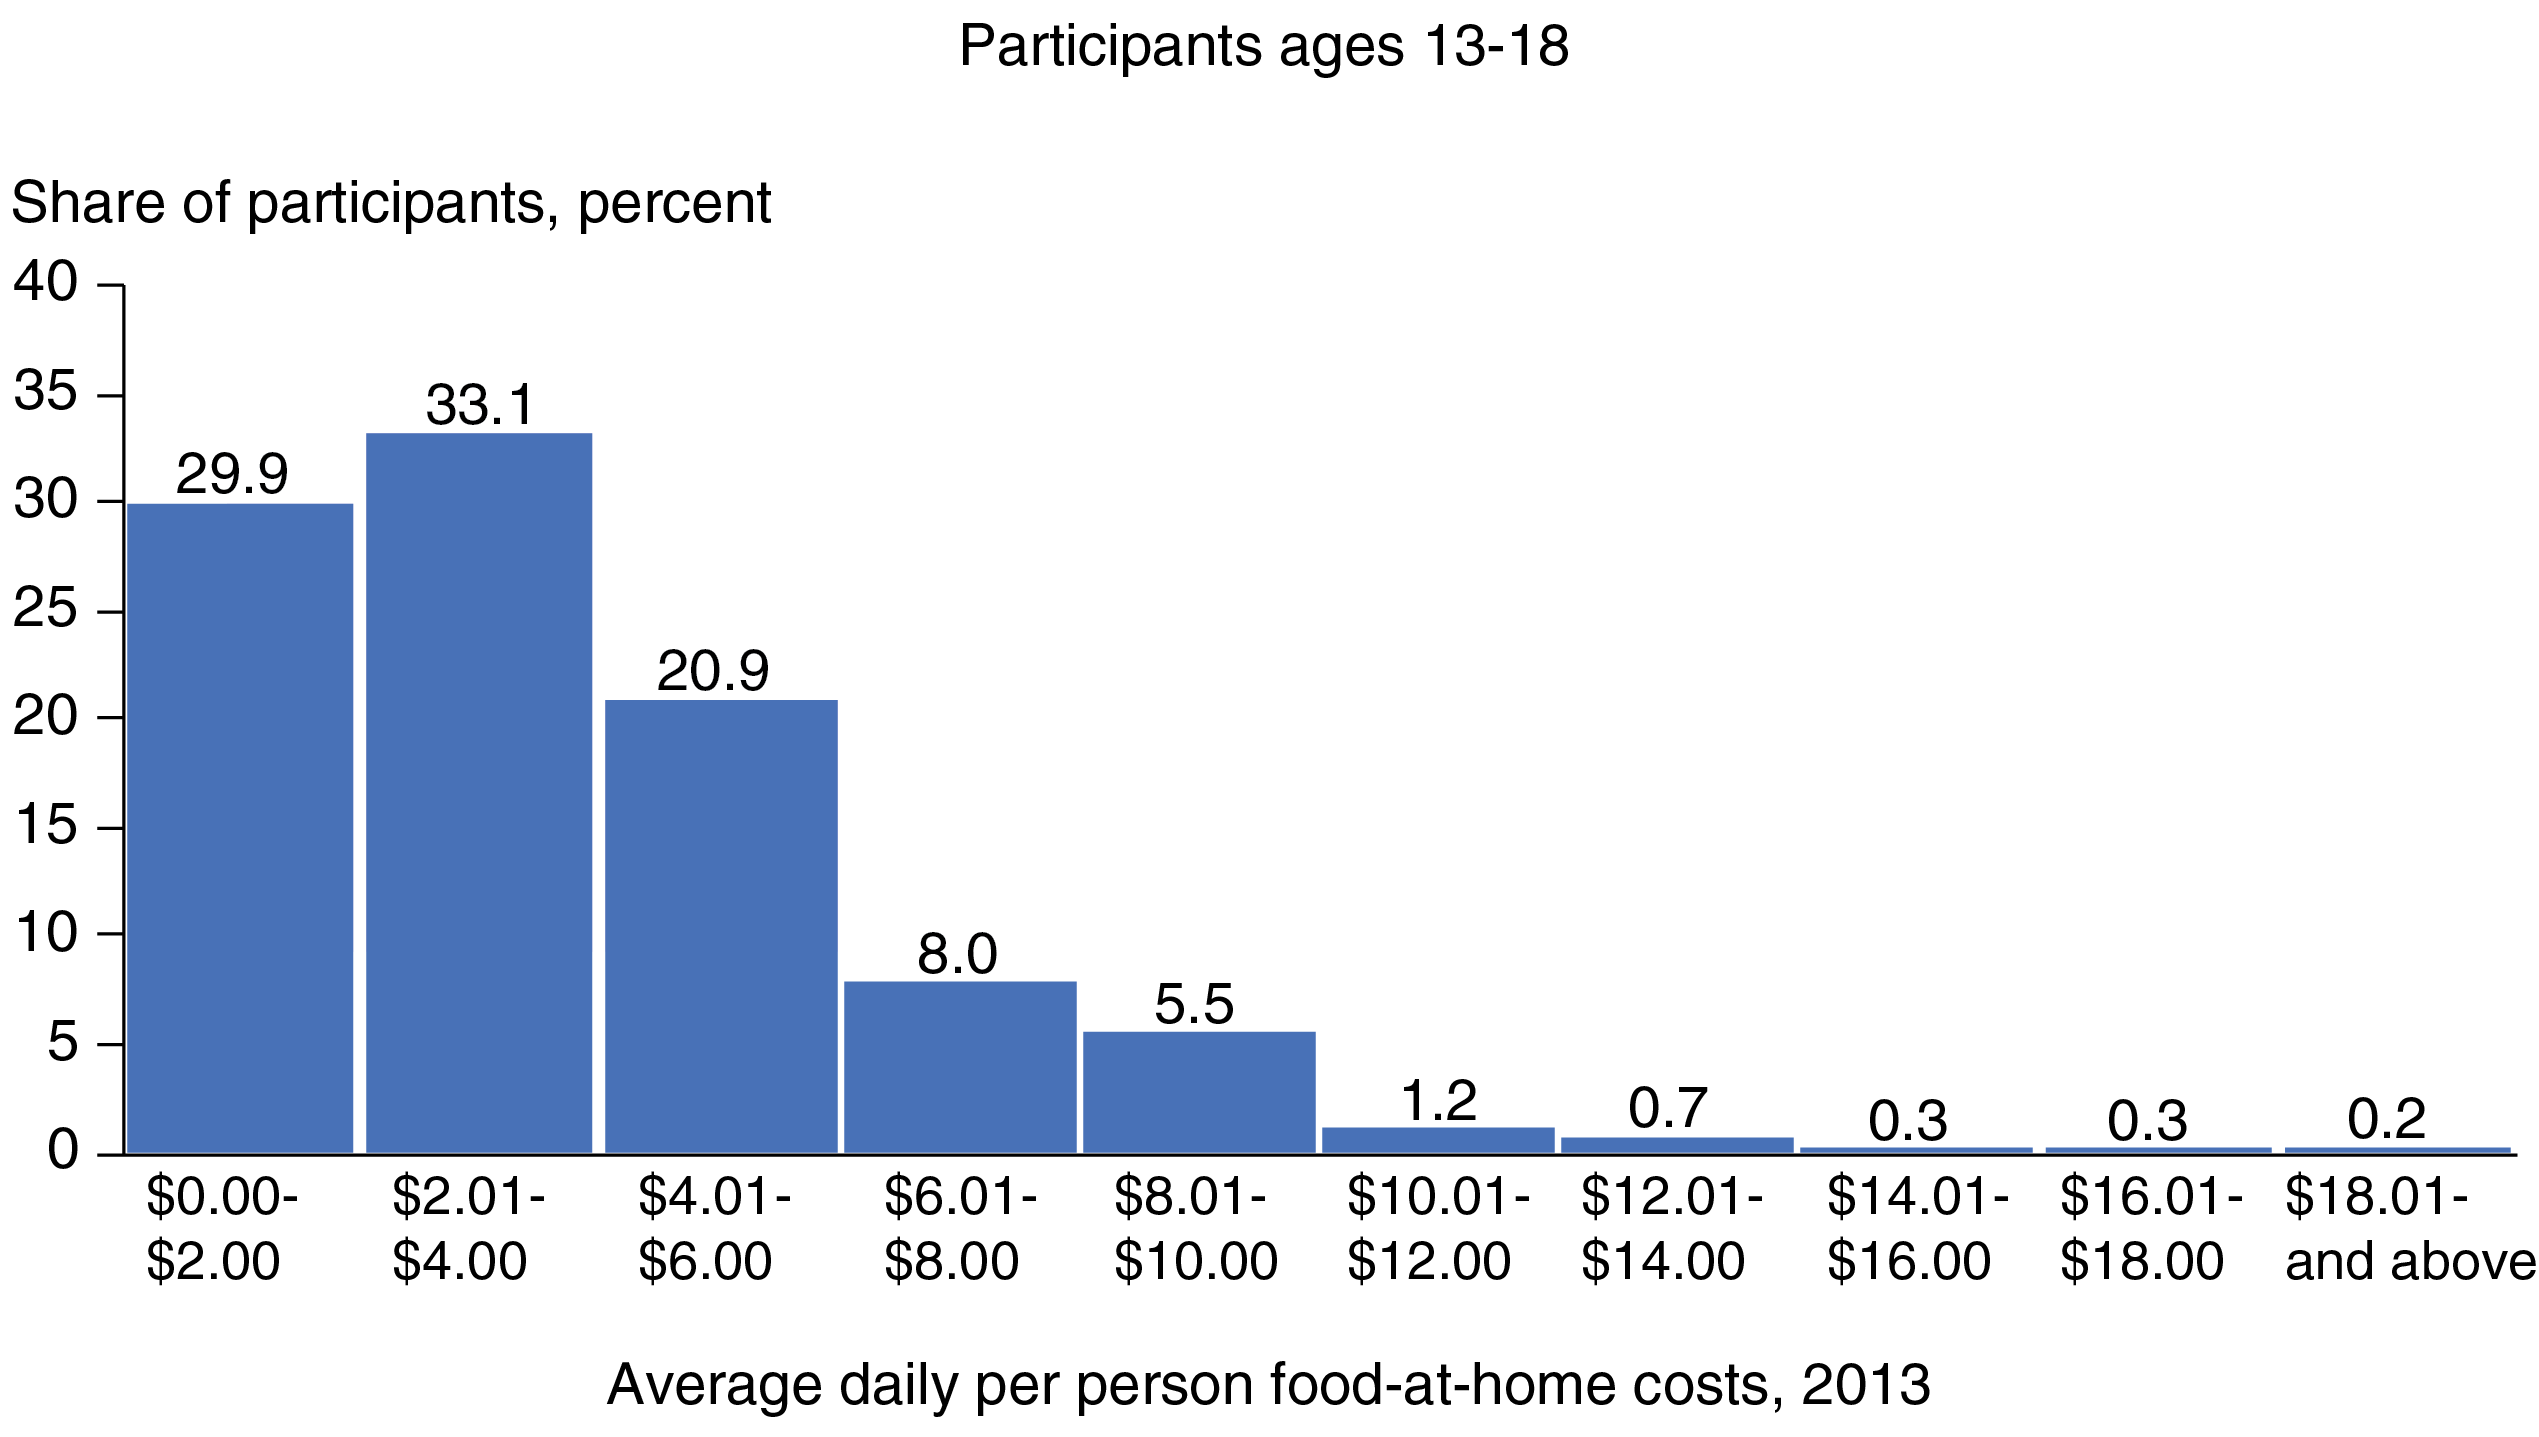
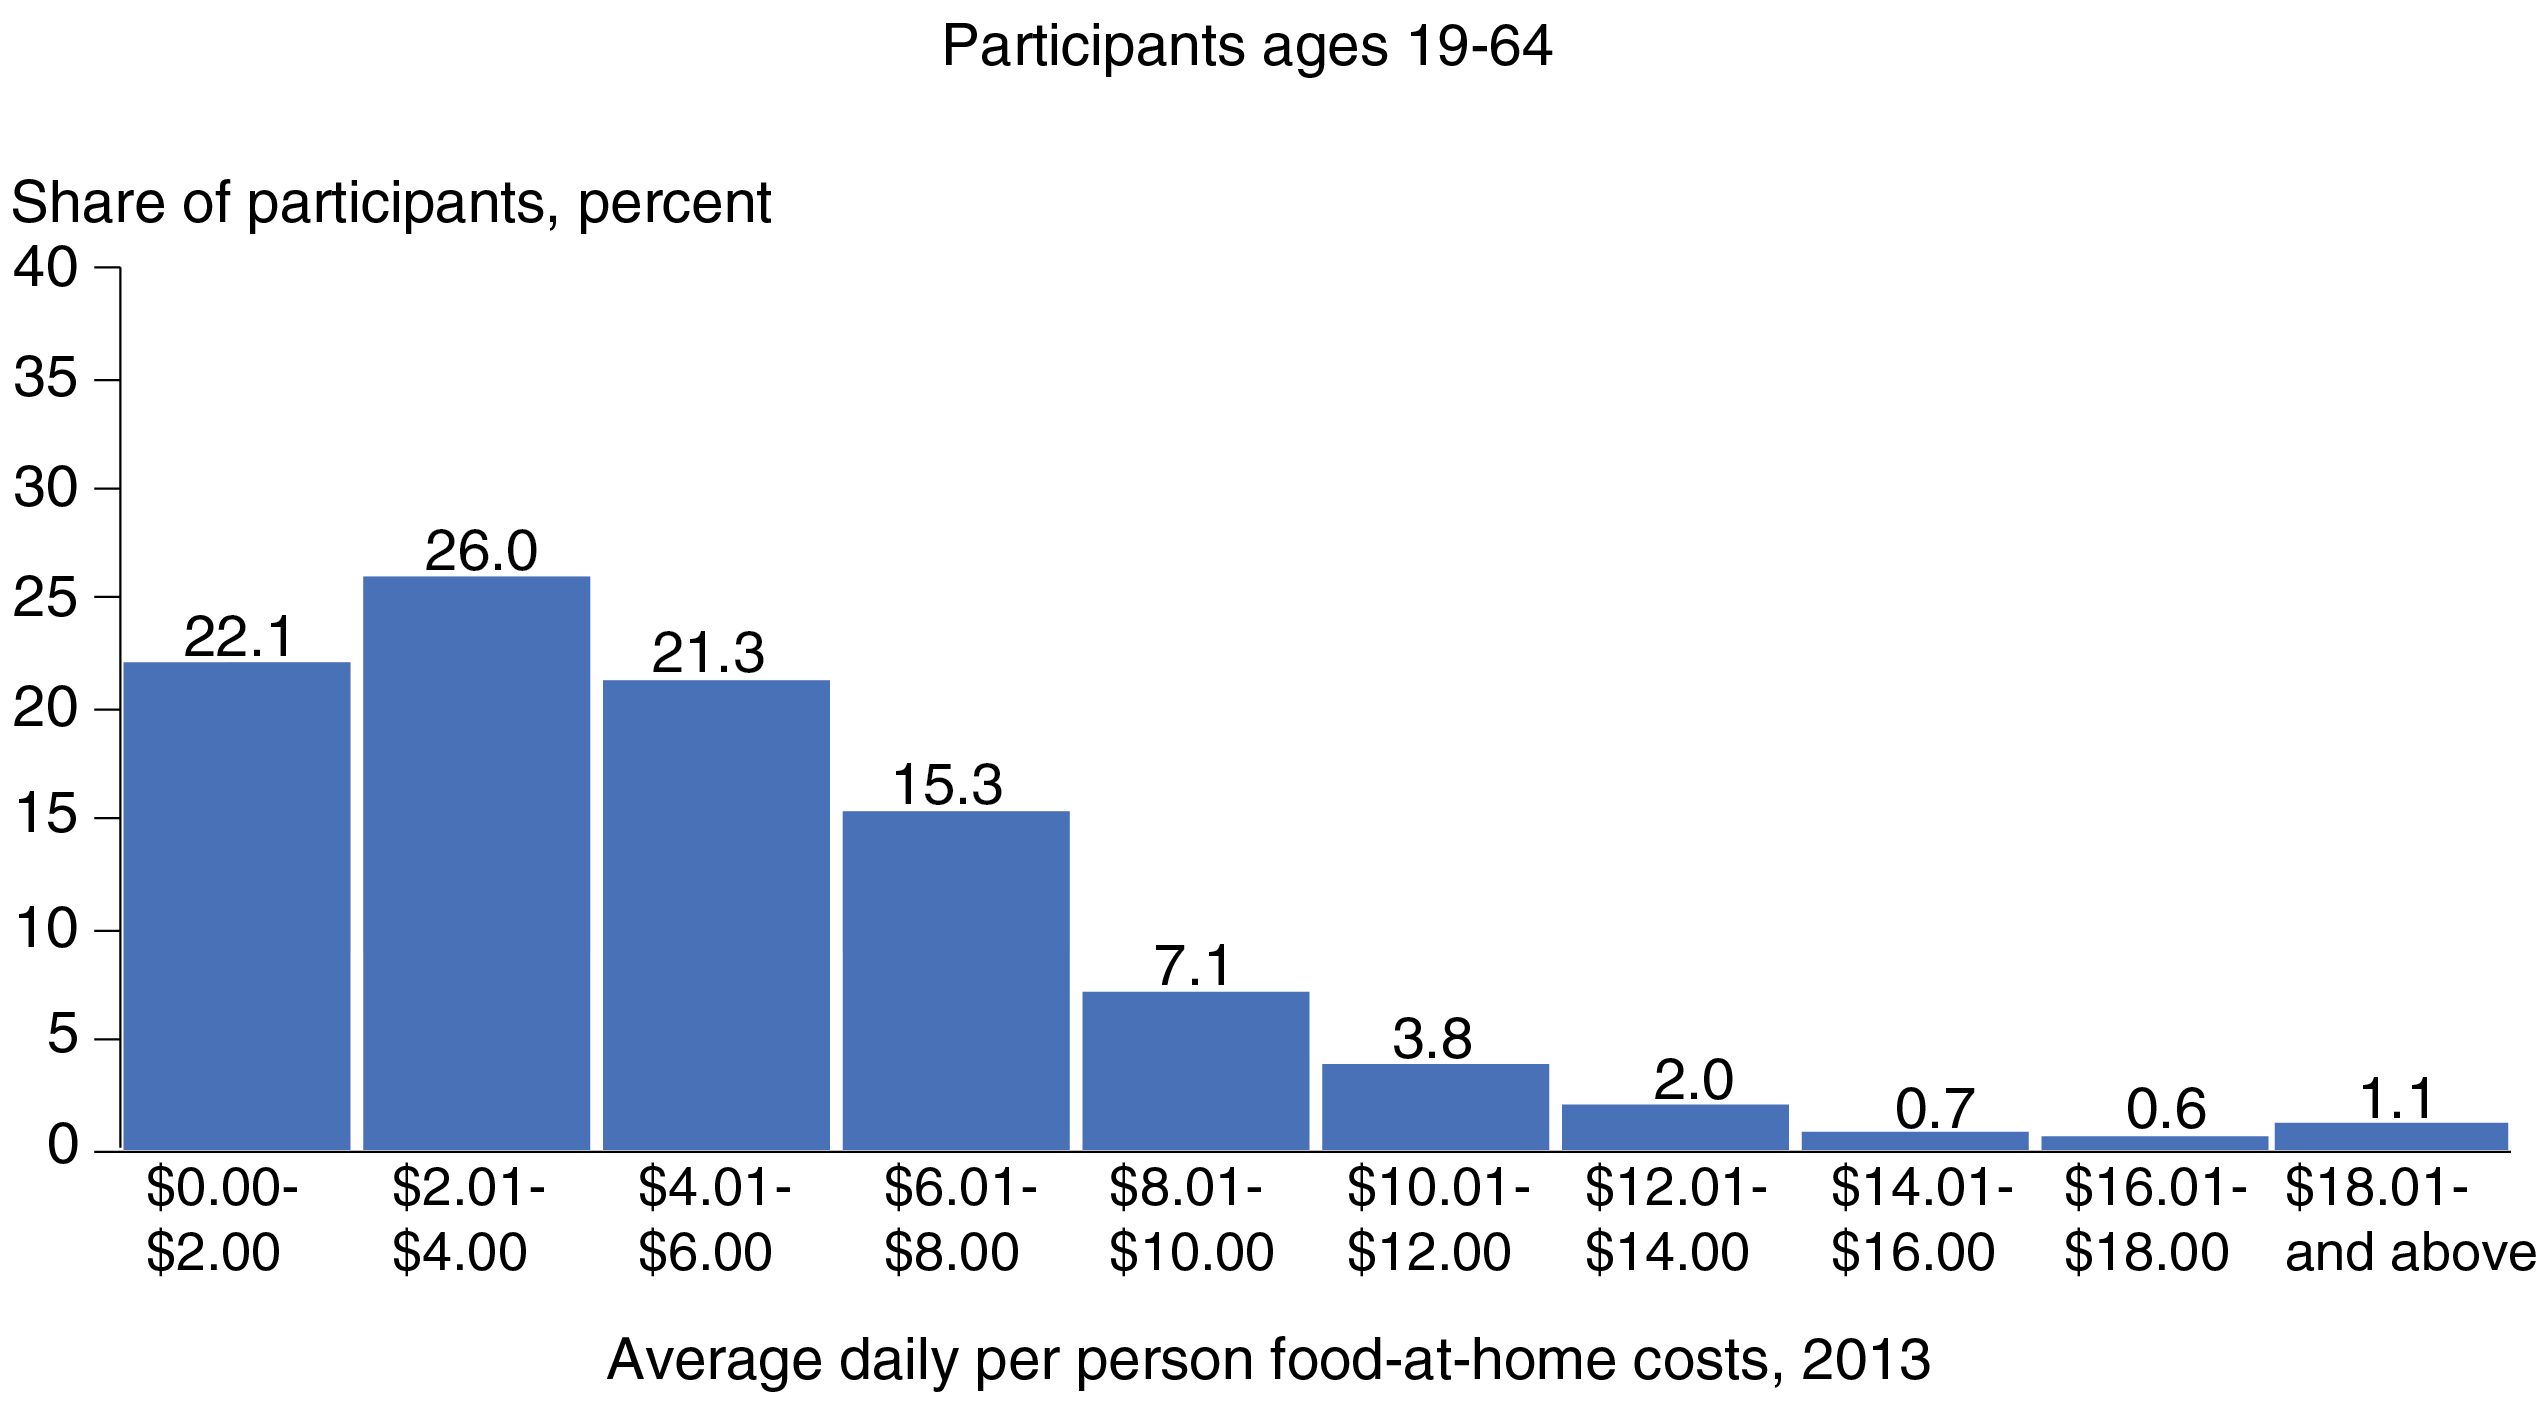
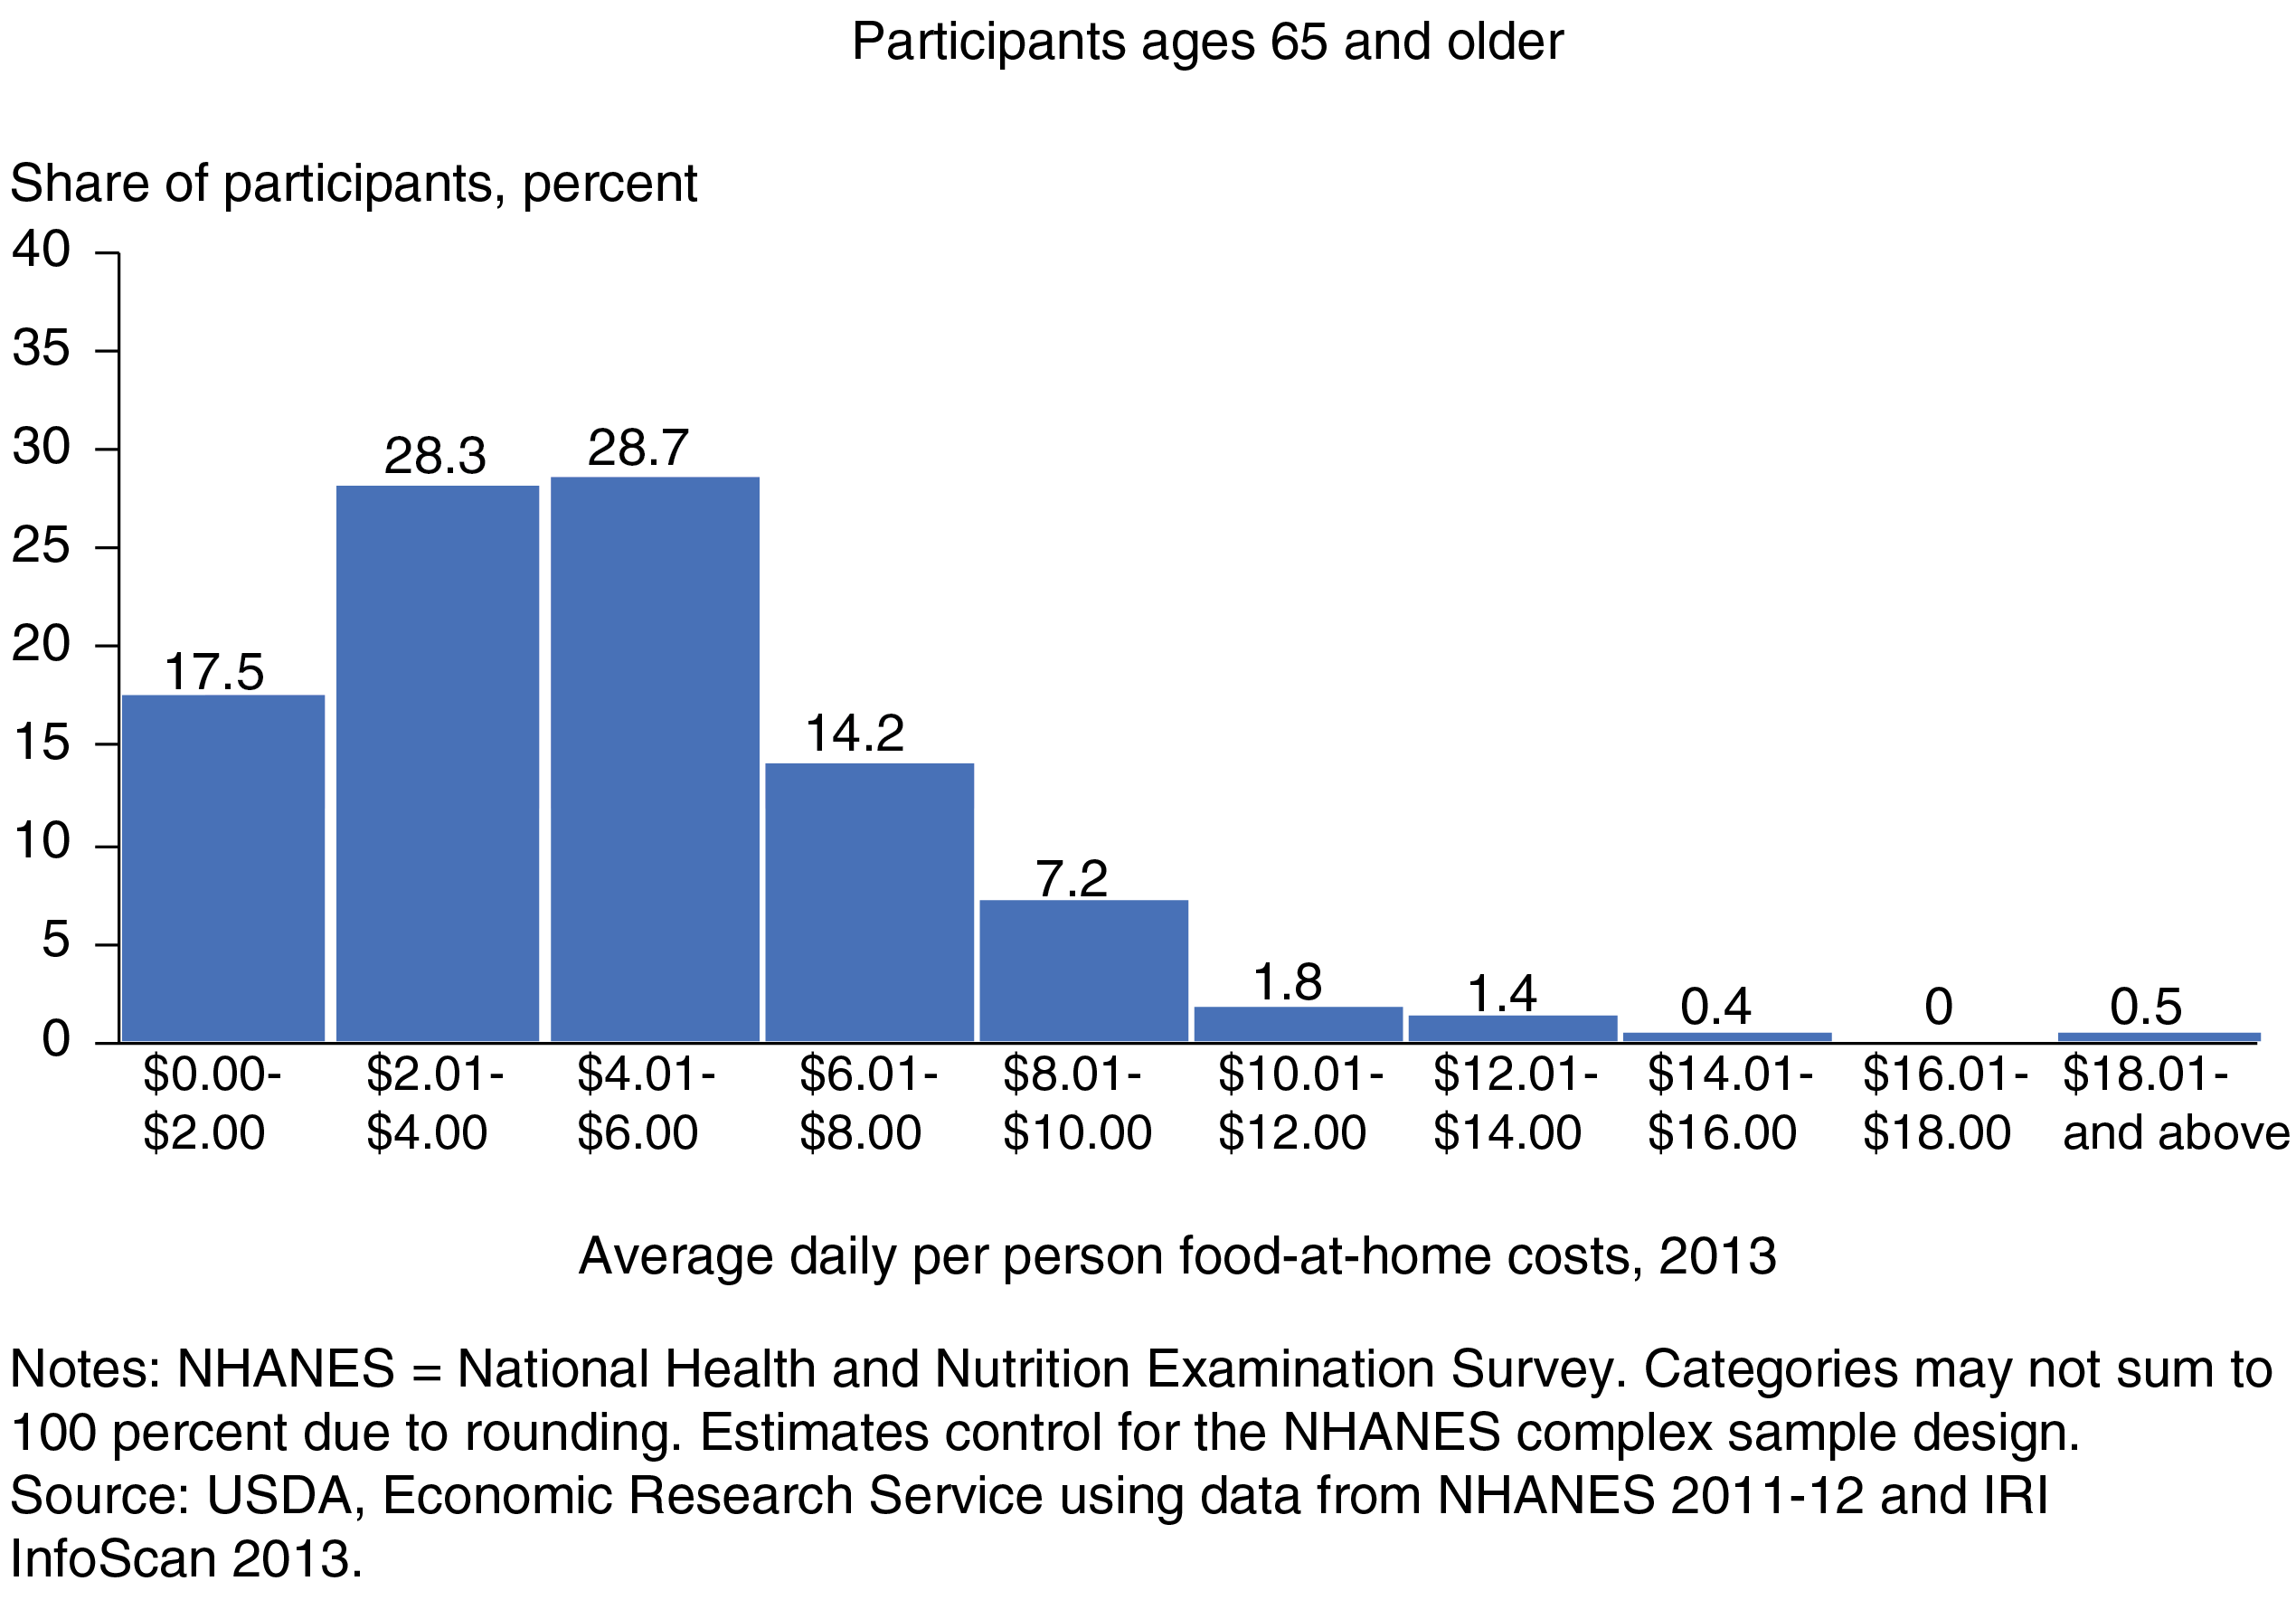
Some of the people consuming foods with smaller daily dollar values are likely to be children, who consume less food than teenagers and adults. When the NHANES participants were separated by age, the researchers found that the median cost of at-home foods and beverages consumed was $3.04 for children between the ages of 2 and 12 and teens aged 13 to 18, compared with $4.16 per day for adults aged 19 to 64 and $4.26 per day for Americans 65 and older.
Teens and adults also had a wider distribution of food-at-home costs. ERS researchers estimate that just over 90 percent of children’s reported daily food-at-home intake costs less than $6 in 2013, while only 84 percent of teens’ food costs and 69 and 75 percent of the adult groups’ food costs fell into this range. These differences may reflect different amounts (such as for teenagers experiencing growth spurts) and varieties of foods consumed at home, as well as differences in relative amounts of at-home and away-from-home food spending. Away-from-home spending includes spending at restaurants, coffee shops, school cafeterias, and other food-away-from-home places.
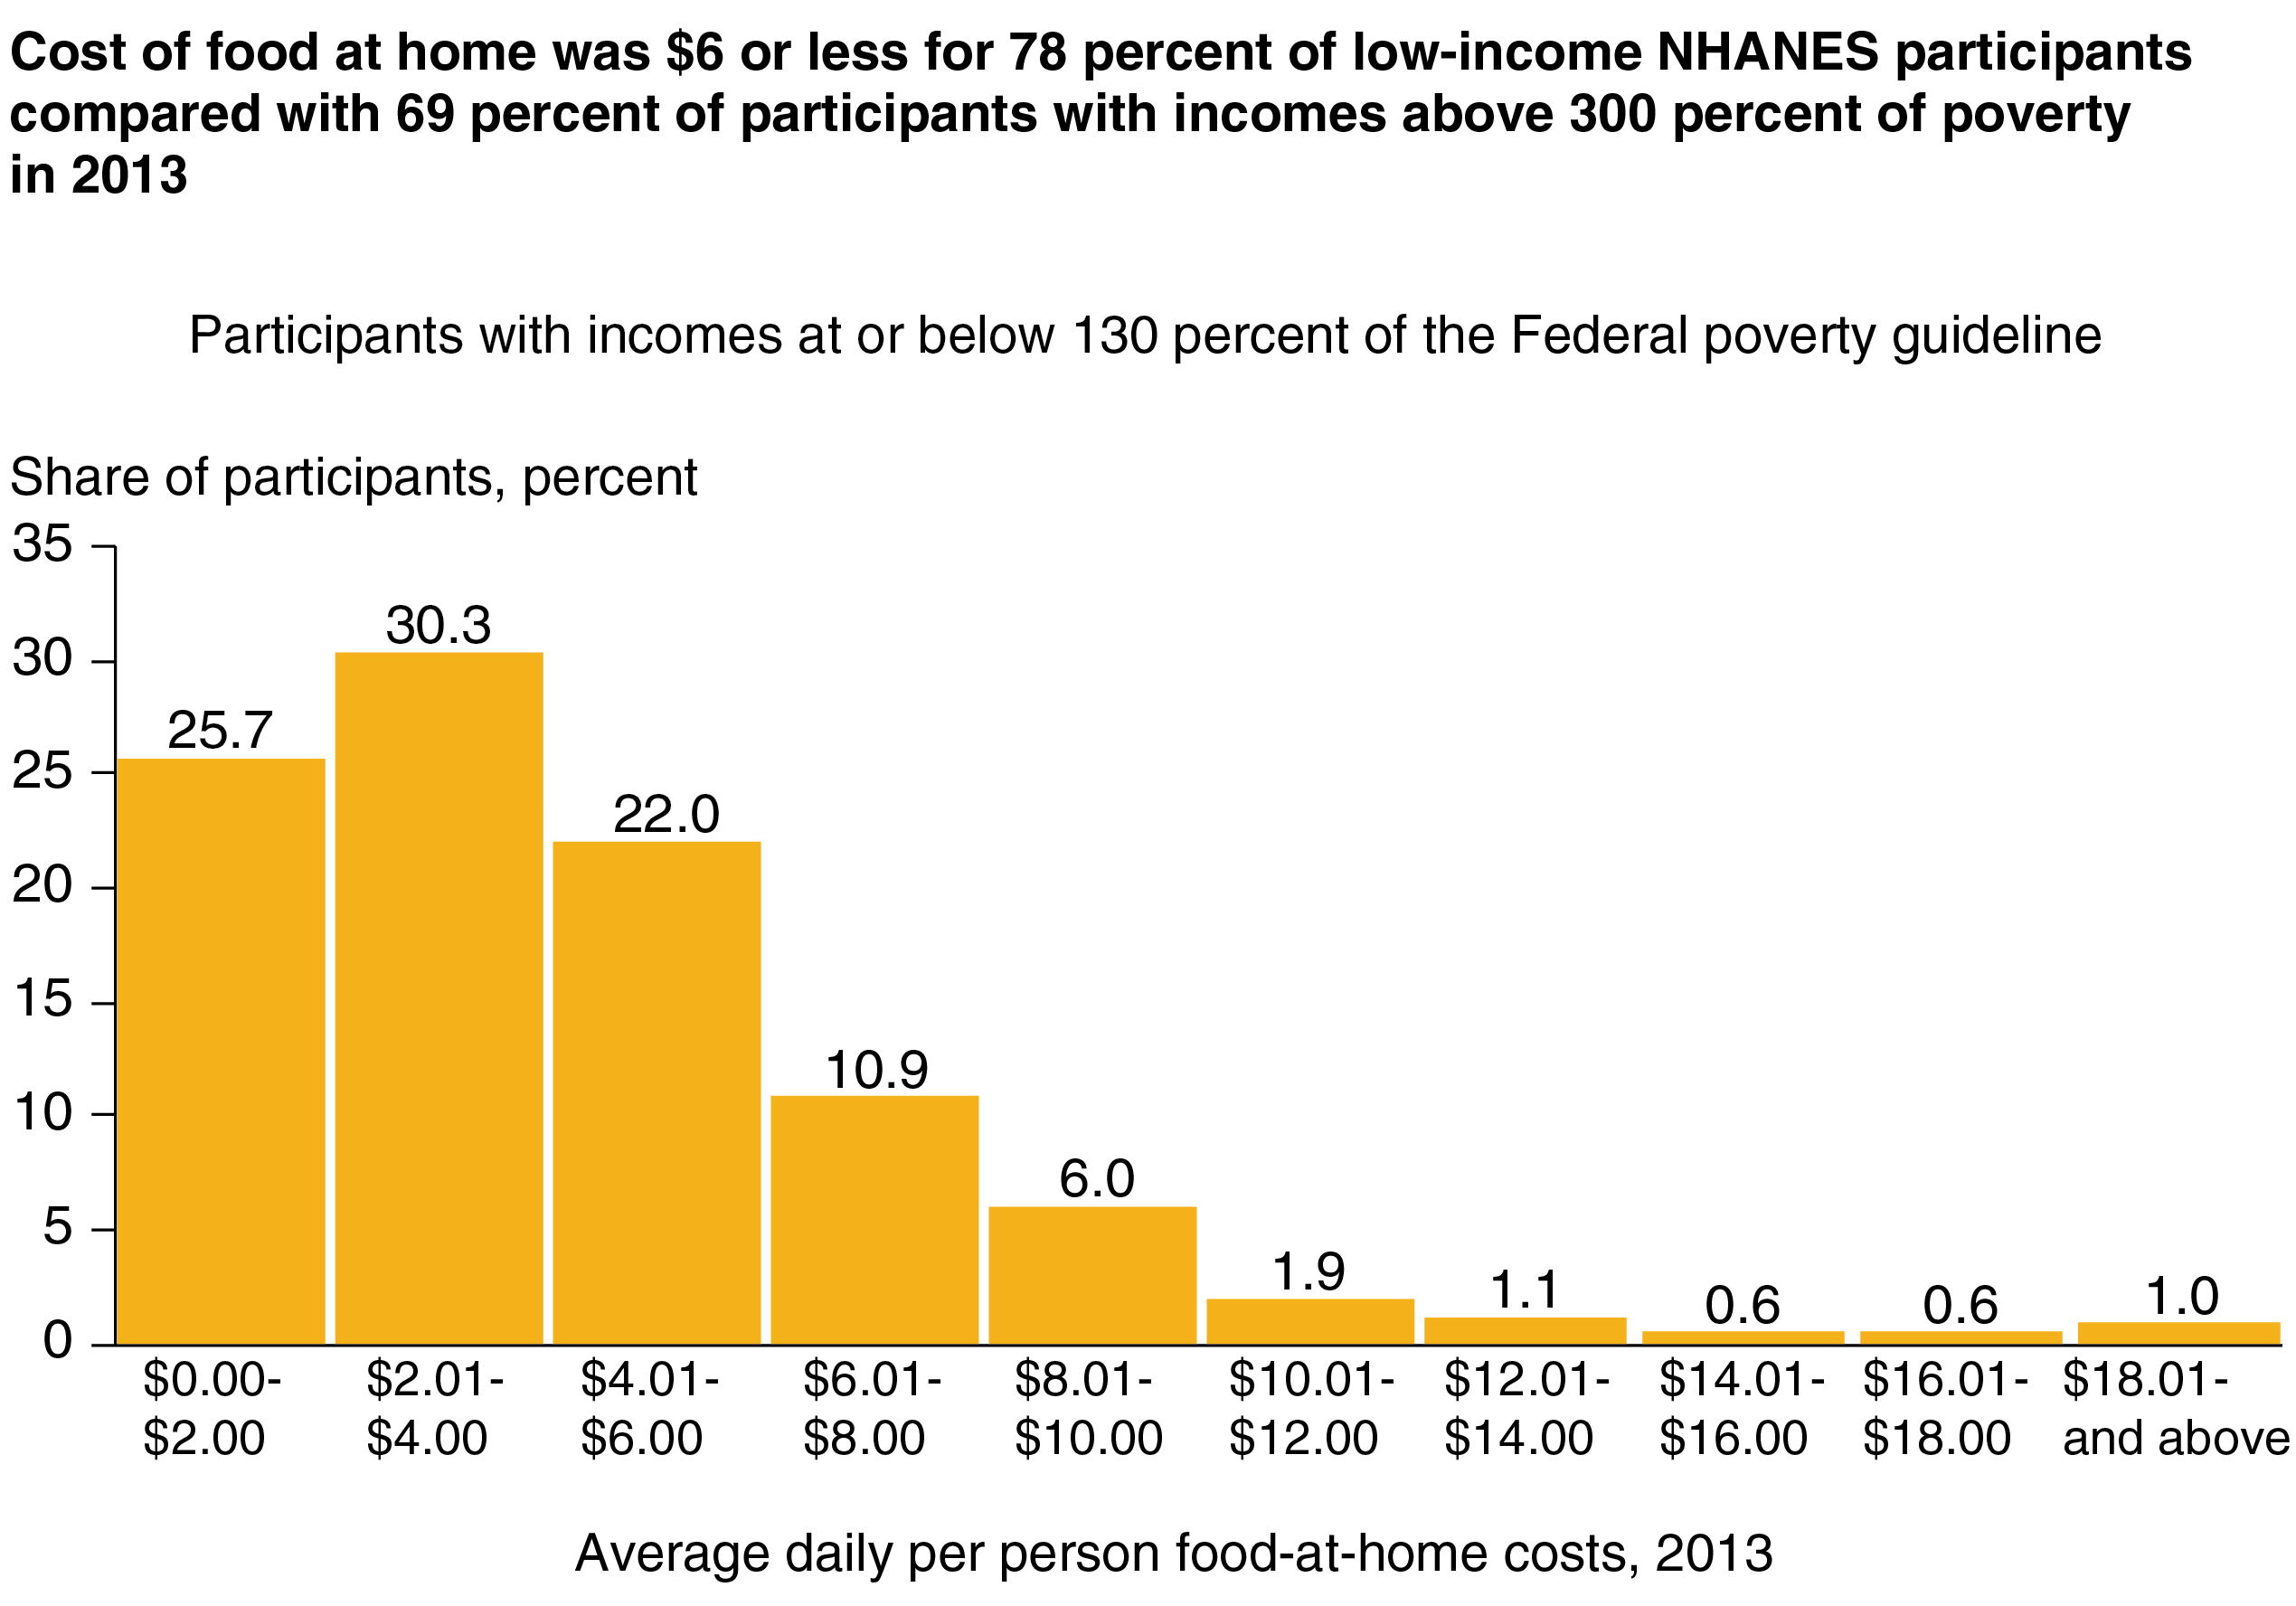
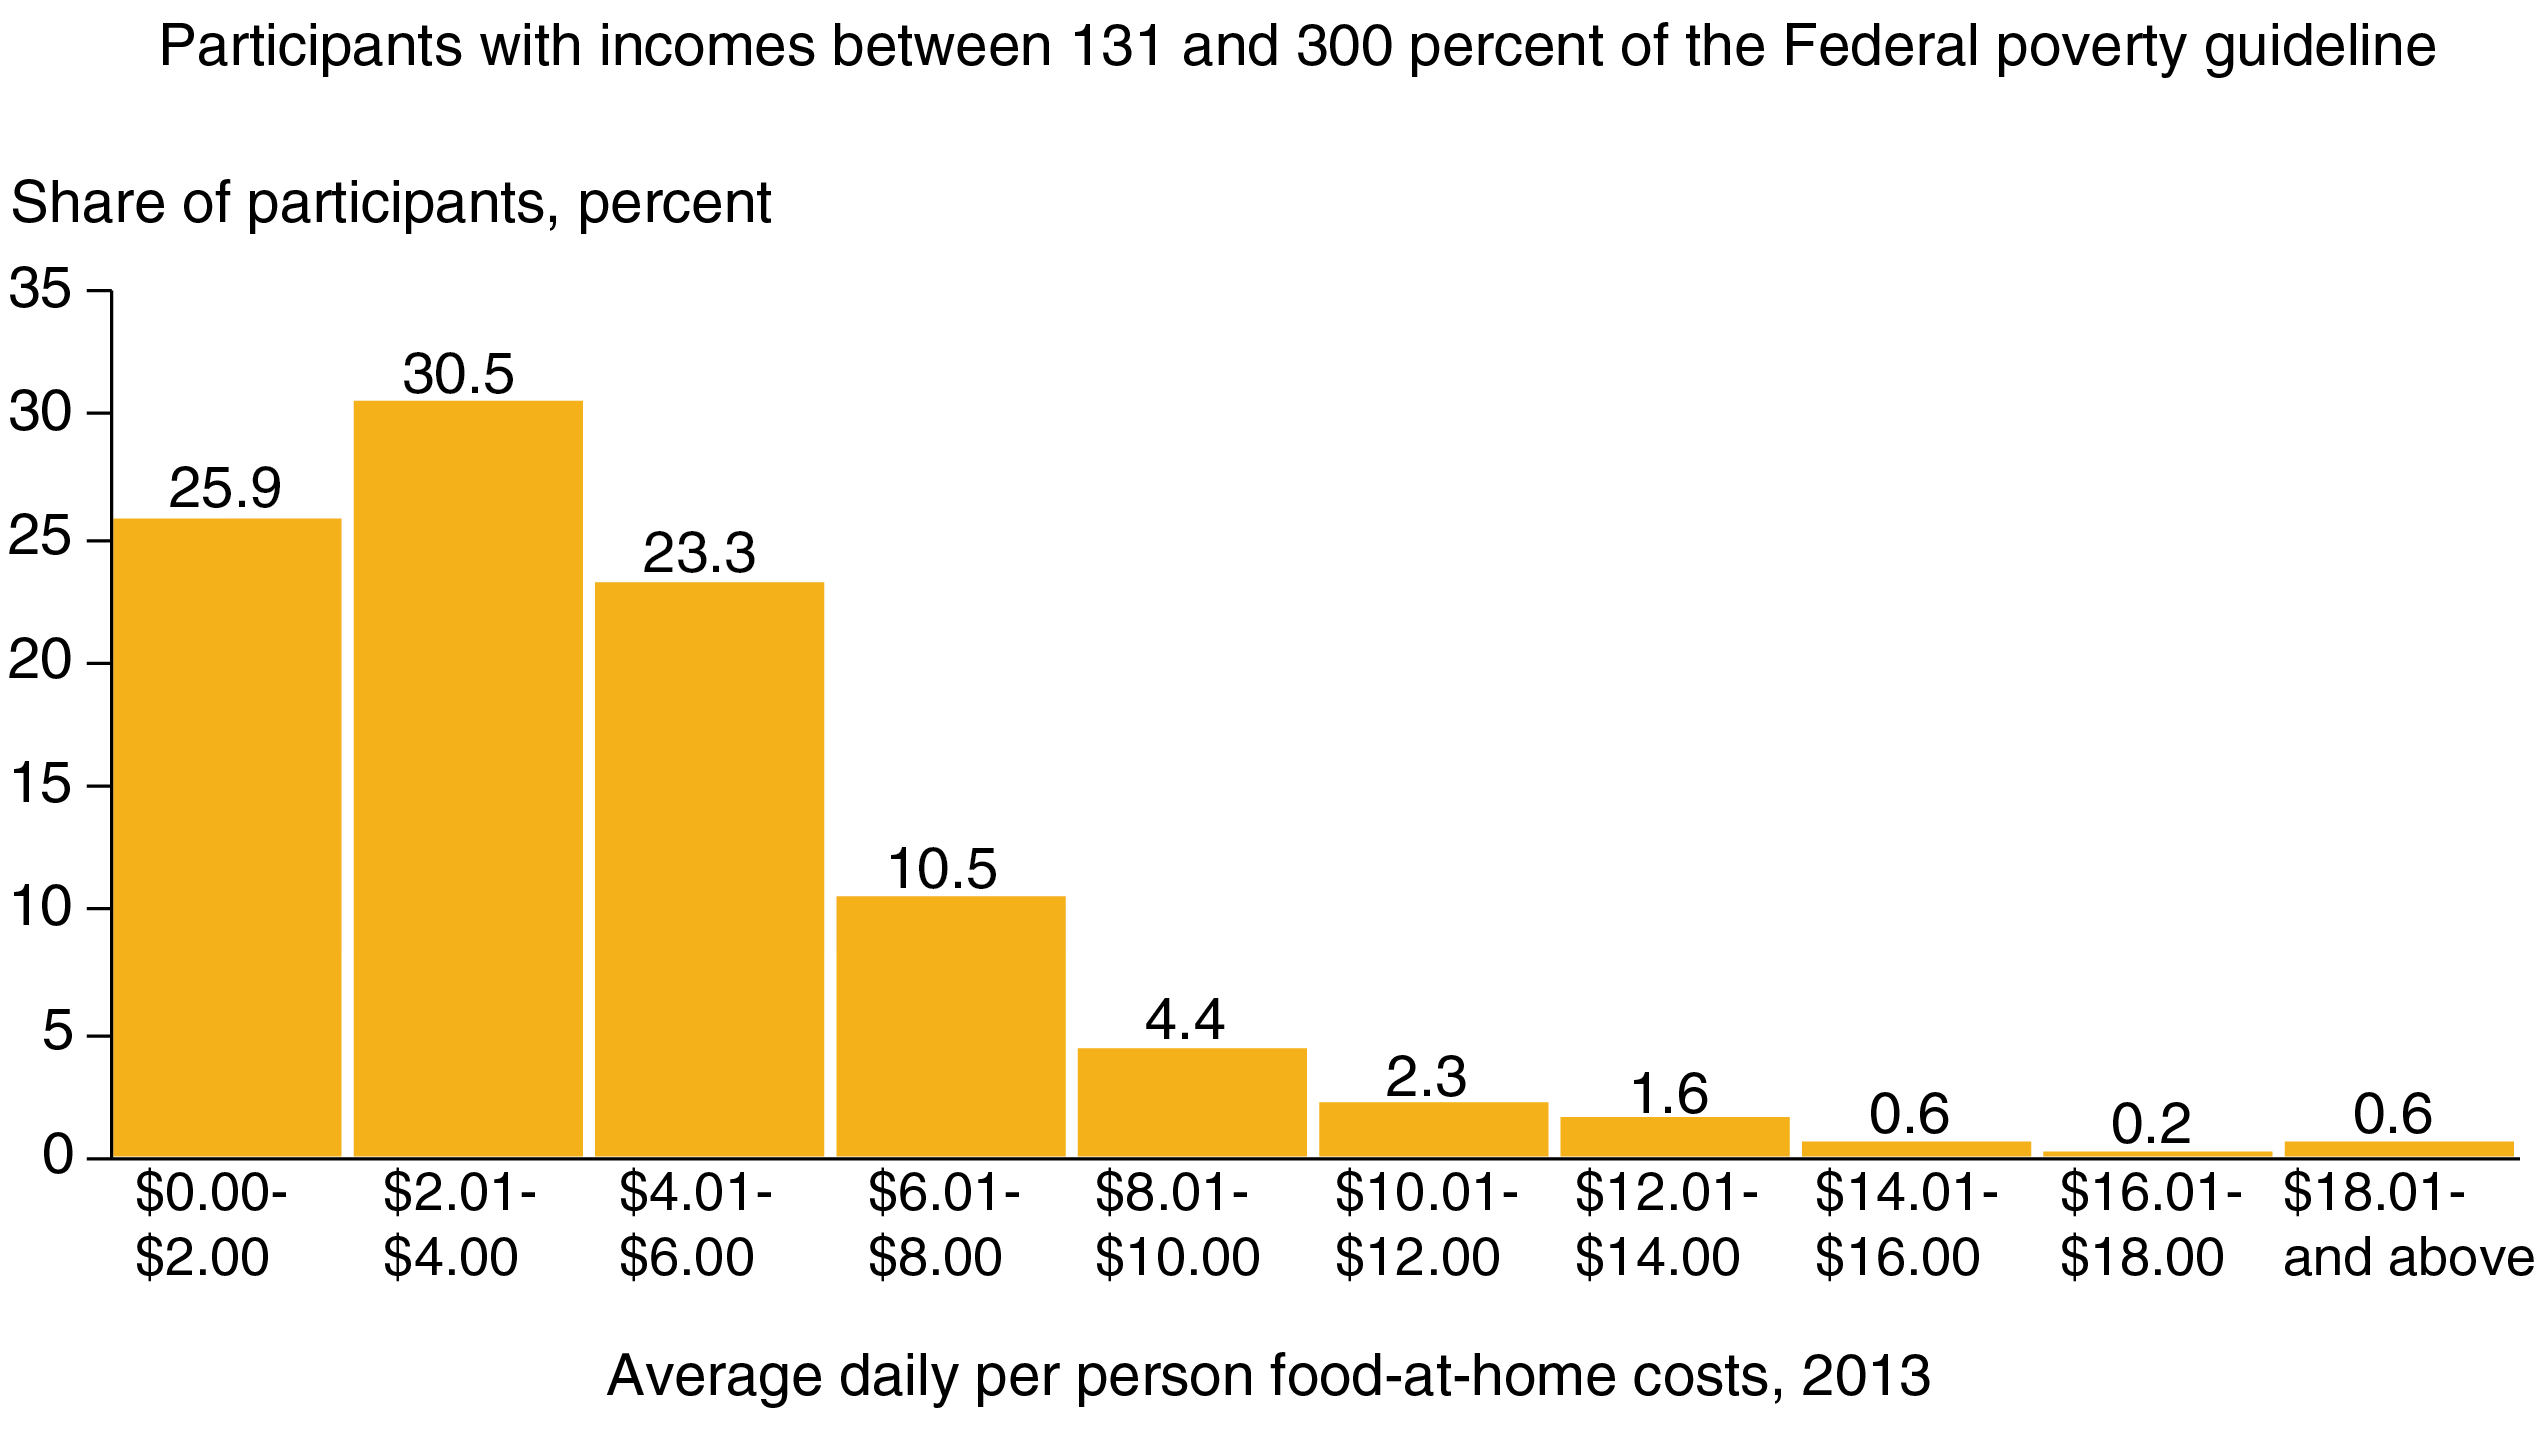
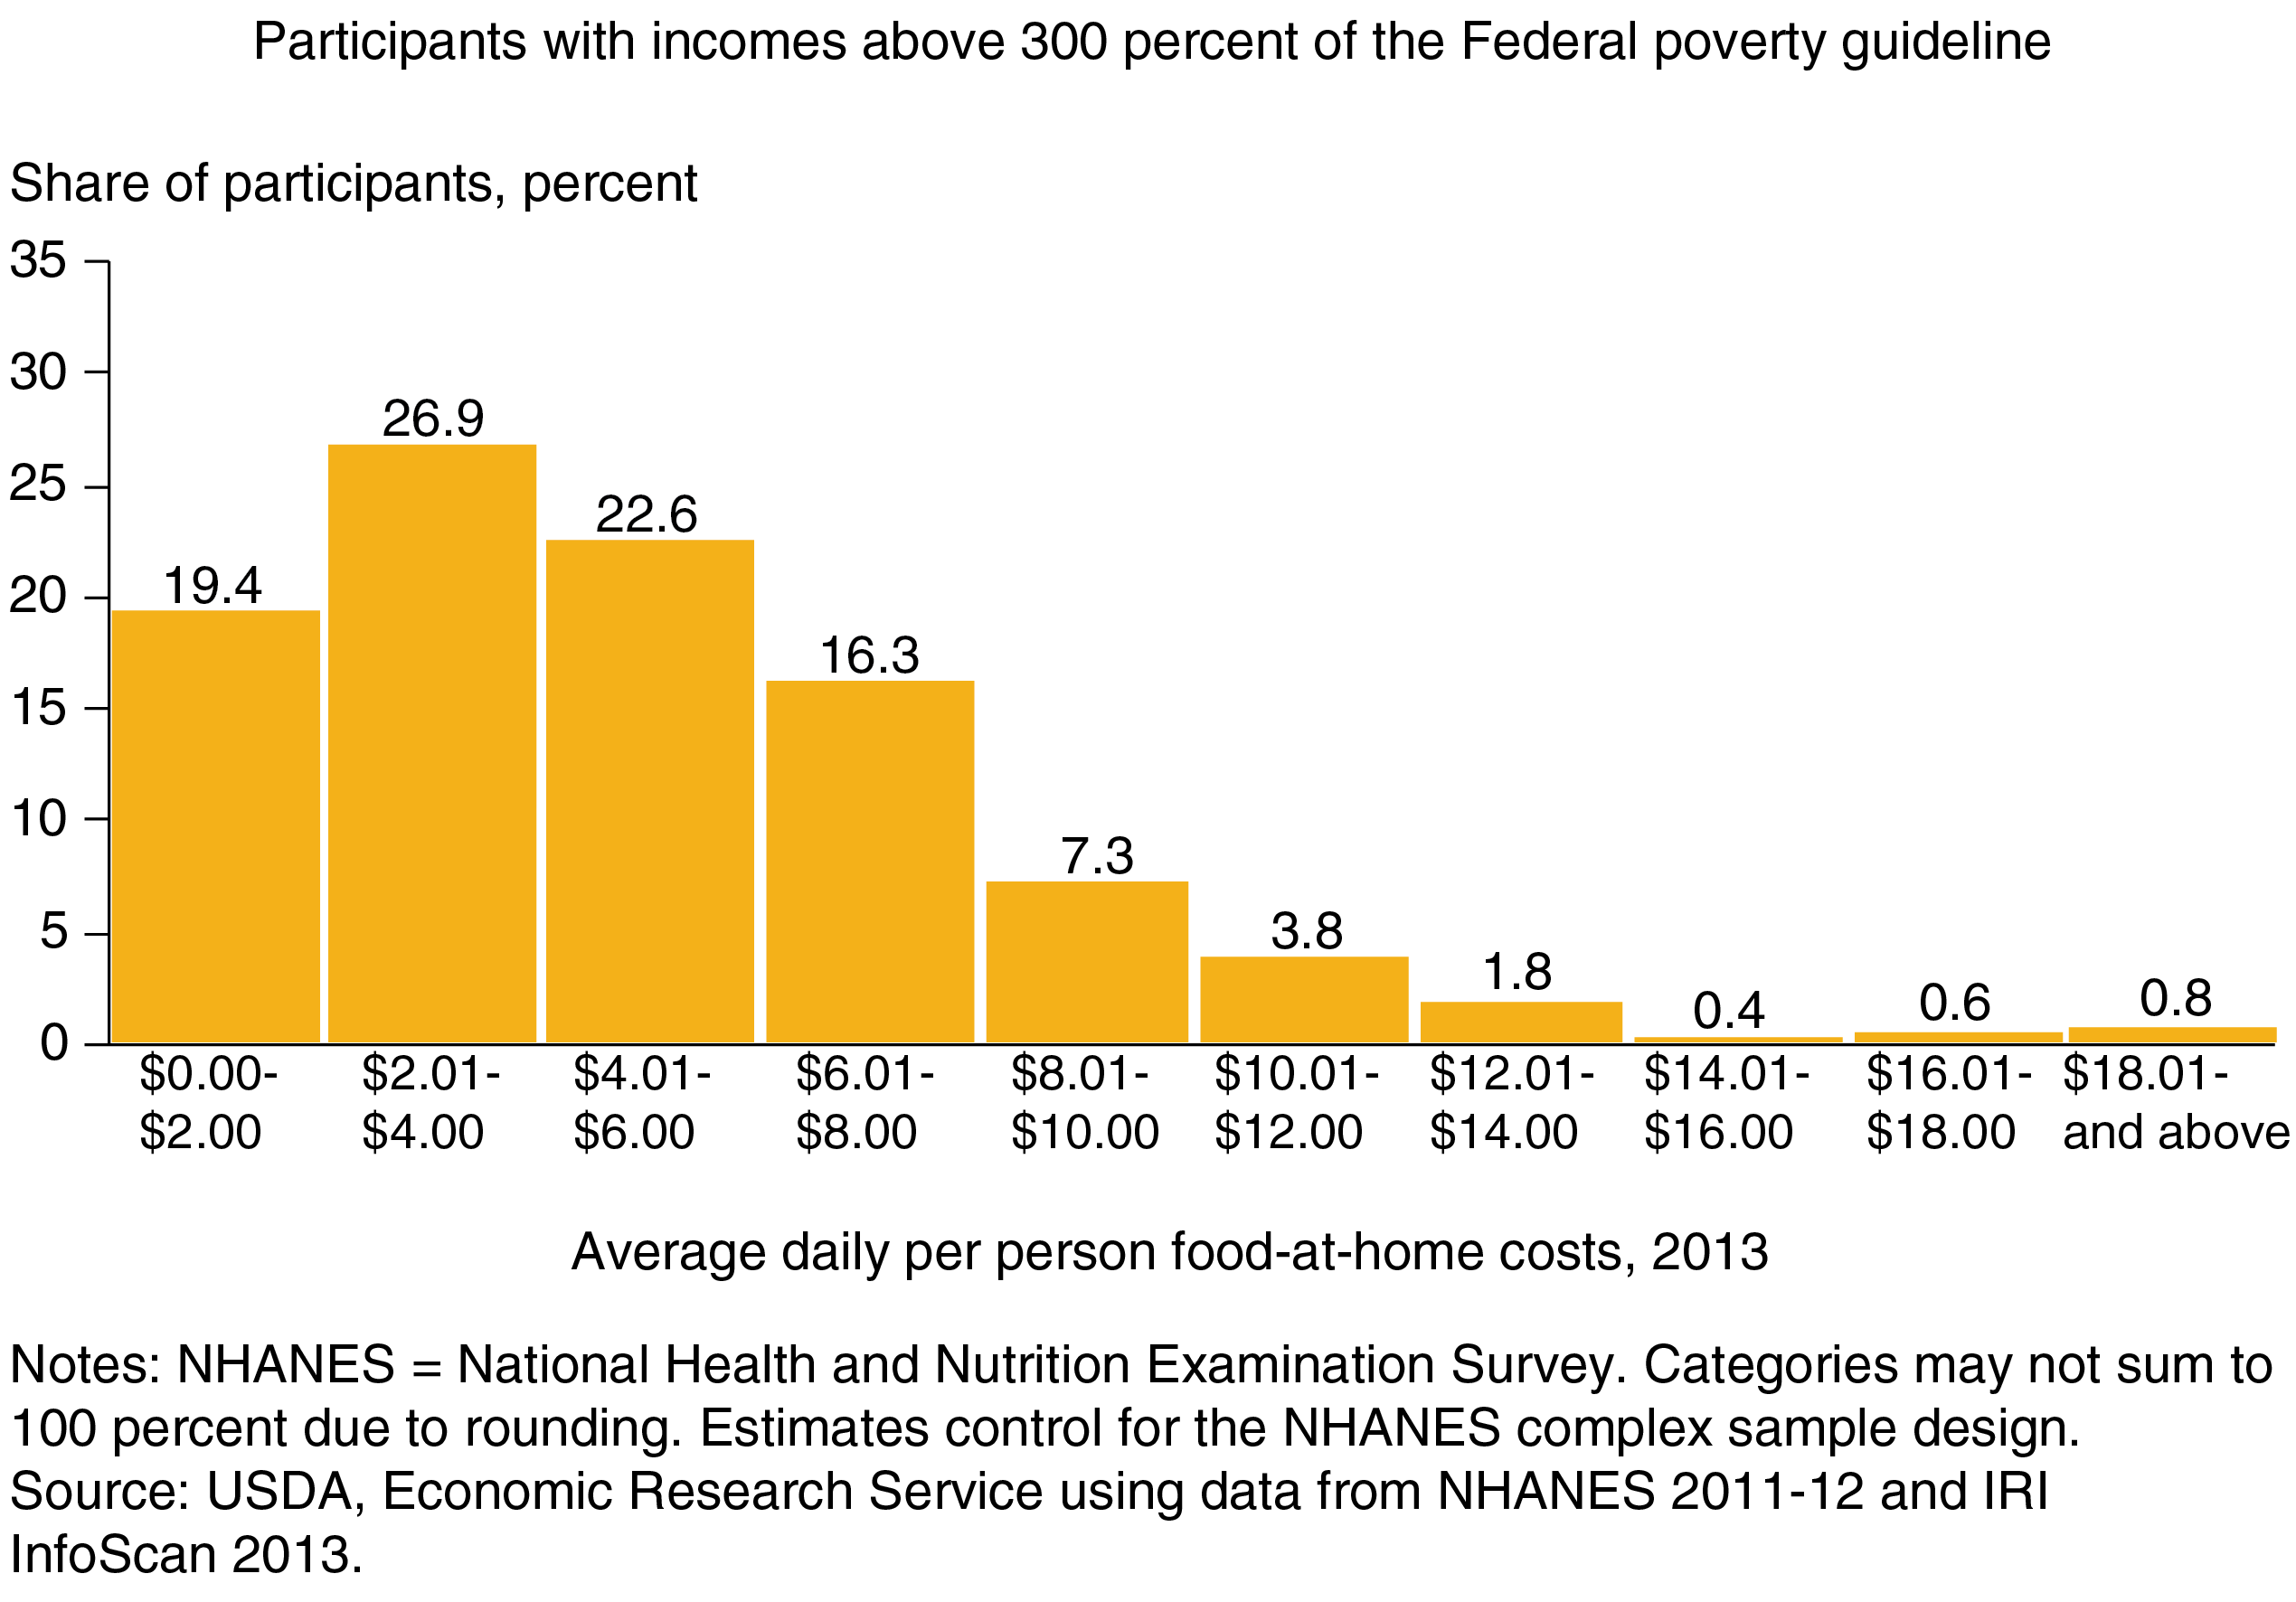
The Purchase to Plate Price Tool also revealed that the median daily at-home food cost for people in households with annual incomes less than 130 percent and between 130 and 300 percent of the Federal poverty guideline was $3.56 and $3.51 in 2013, respectively. Households with incomes less than 130 percent of the poverty guideline qualify for SNAP. For people with household incomes greater than 300 percent of the Federal poverty guideline, the median average daily at-home food cost was $4.27. For approximately 80 percent of individuals with household incomes less than or equal to 300 percent of the Federal poverty guidelines, their daily at-home food consumption cost $6.00 or less, compared with only 69 percent of higher-income individuals with household incomes greater than 300 percent of the Federal poverty guideline. Moreover, for 15 percent of higher income individuals, their at-home food consumption cost more than $8.00 a day.
Purchase to Plate Price Tool Supports Policymaking and Research
The Purchase to Plate Price Tool will be updated to incorporate more recent store-level sales data and dietary intake and consumption pattern data to support USDA’s efforts to update the Thrifty Food Plan as mandated by the 2018 Farm Bill. Government and academic researchers will also be able to use the estimated food costs generated by the tool in a variety of ways, including exploring the role of prices when consumers make their food purchase decisions.
This article is drawn from:
- Carlson, A., Kuczynski, K., Pannucci, T., Koegel, K., Page, E.T., Tornow, C.E. & Palmer Zimmerman, T. (2020). Estimating Prices for Foods in the National Health and Nutrition Examination Survey: The Purchase to Plate Price Tool. U.S. Department of Agriculture, Economic Research Service. TB-1955.


