A Look At USDA, Economic Research Service’s Commodity Costs and Returns Data
- by Samantha Padilla
- 12/7/2020
The USDA, Economic Research Service (ERS) Commodity Costs and Returns data product reports estimates for 12 major field crops and animal products: corn, soybeans, wheat, cotton, grain sorghum, rice, peanuts, oats, barley, milk, hogs, and cow-calf. Updated twice a year since 1975, the estimates are available for the United States and by specific regions as delineated by ERS’s Farm Resource Regions. The Commodity Costs and Returns estimates provide a snapshot of annual changes in operating costs (seed, feed, fertilizer, fuel, etc.), allocated overhead (hired labor, taxes, insurance, opportunity cost of land, etc.), value of production, prices, yields, and quantities sold. They are useful for informing stakeholders, policymakers, and researchers of current and historical costs and returns associated with the major U.S. commodities. The estimates are also featured in numerous ERS reports and serve as the basis for research.
Since 1996, the estimates have been based on data collected through special commodity-specific versions of the Agricultural Resource Management Survey (ARMS), which is conducted jointly between USDA, ERS and USDA, National Agricultural Statistics Service. Though ARMS is an annual survey, commodity-specific versions of the survey are conducted on rotations of 4 to 8 years, depending upon the commodity. Commodity Costs and Returns estimates are developed based upon results of the commodity-specific ARMS versions and updated during non-survey years using current prices and yields. Using appropriate weights within ARMS, the Commodity Costs and Returns estimates are representative for the United States and reported regions.
Since 1995, the estimates have been developed following methods recommended by the American Agricultural Economics Association Task Force on Commodity Costs and Returns. Estimates can be accessed as Excel documents or through the ERS online interactive visualization tool (link below).
This article includes examples of the types of charts that can be developed using the Commodity Costs and Returns data product. We feature historical estimates, and estimates by region, by State, and by size.
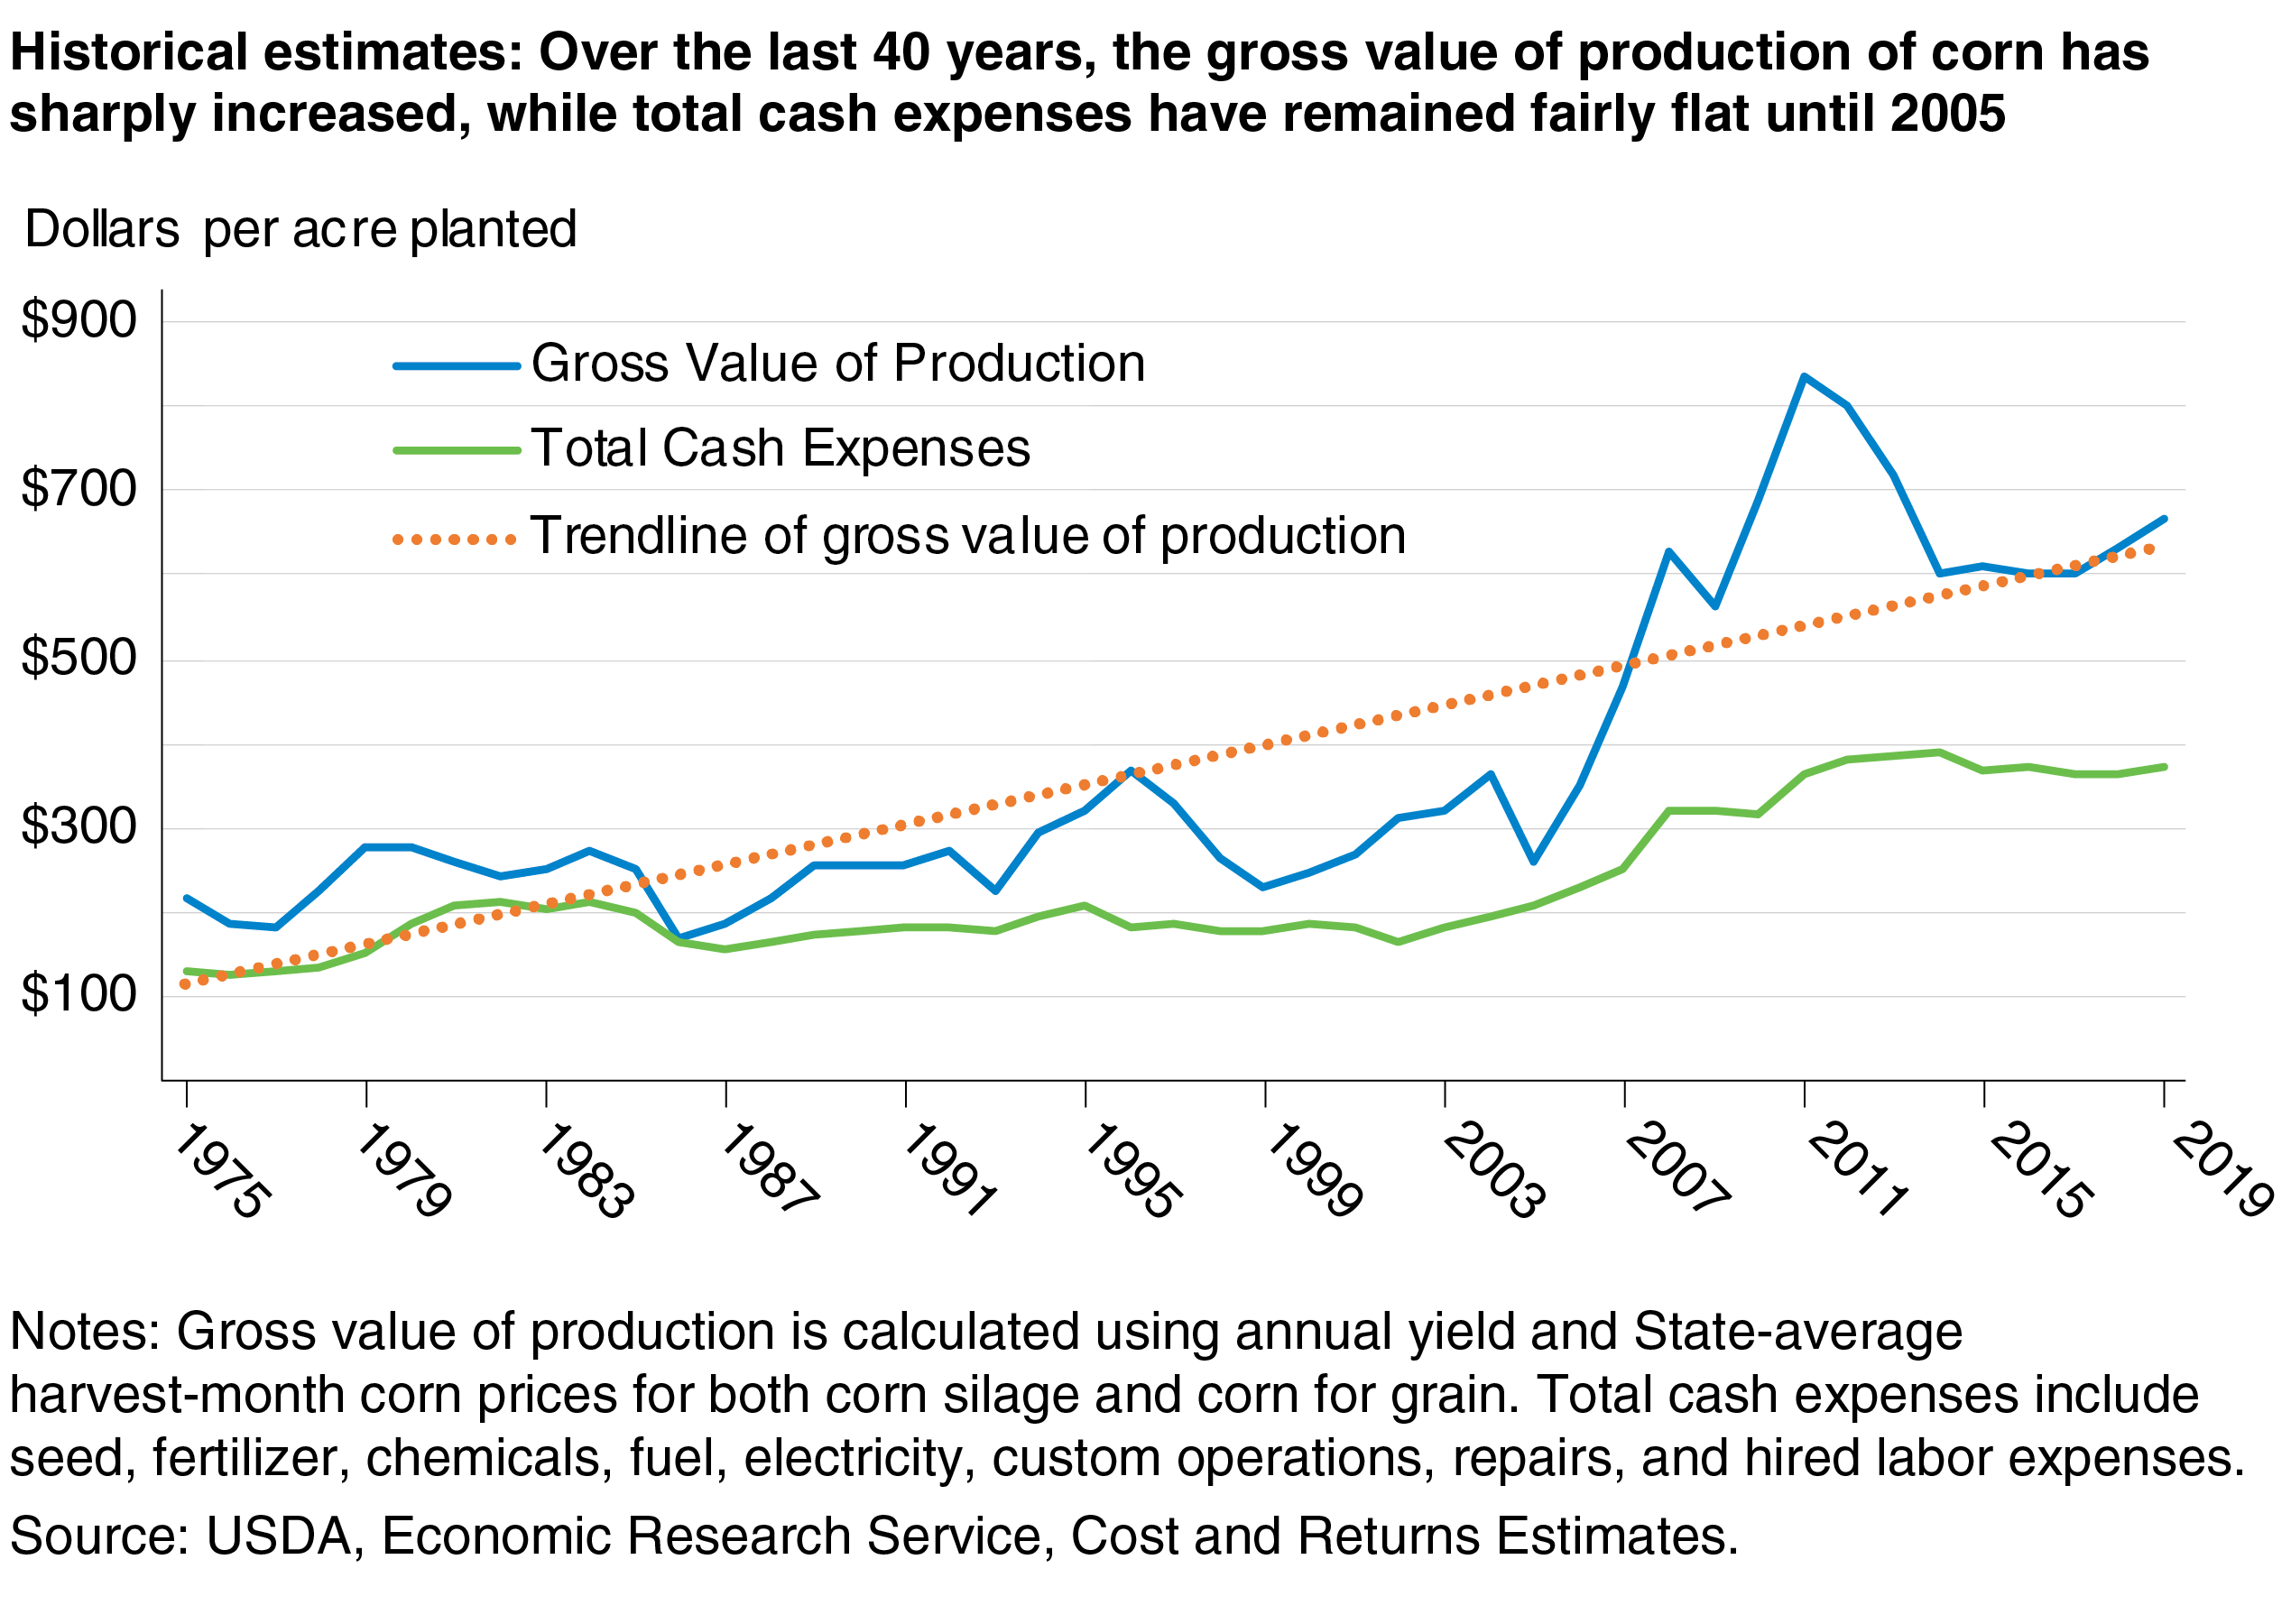
One example of how the Commodity Costs and Returns data product can be used is indicated in the figure above, which displays the gross value of production and cash expenses for a crop commodity (corn) over the last 45 years. The chart illustrates that over time, there has been more variation in the value of production of corn than in expenses; recent increases in the value of corn have resulted primarily from an increase in the share of corn used for ethanol. Meanwhile, cash expenses have only increased modestly, accelerating somewhat during 2005-2012. The high variation in the value of production less expenses might mean that corn producers’ revenue streams are also highly variable from year to year.
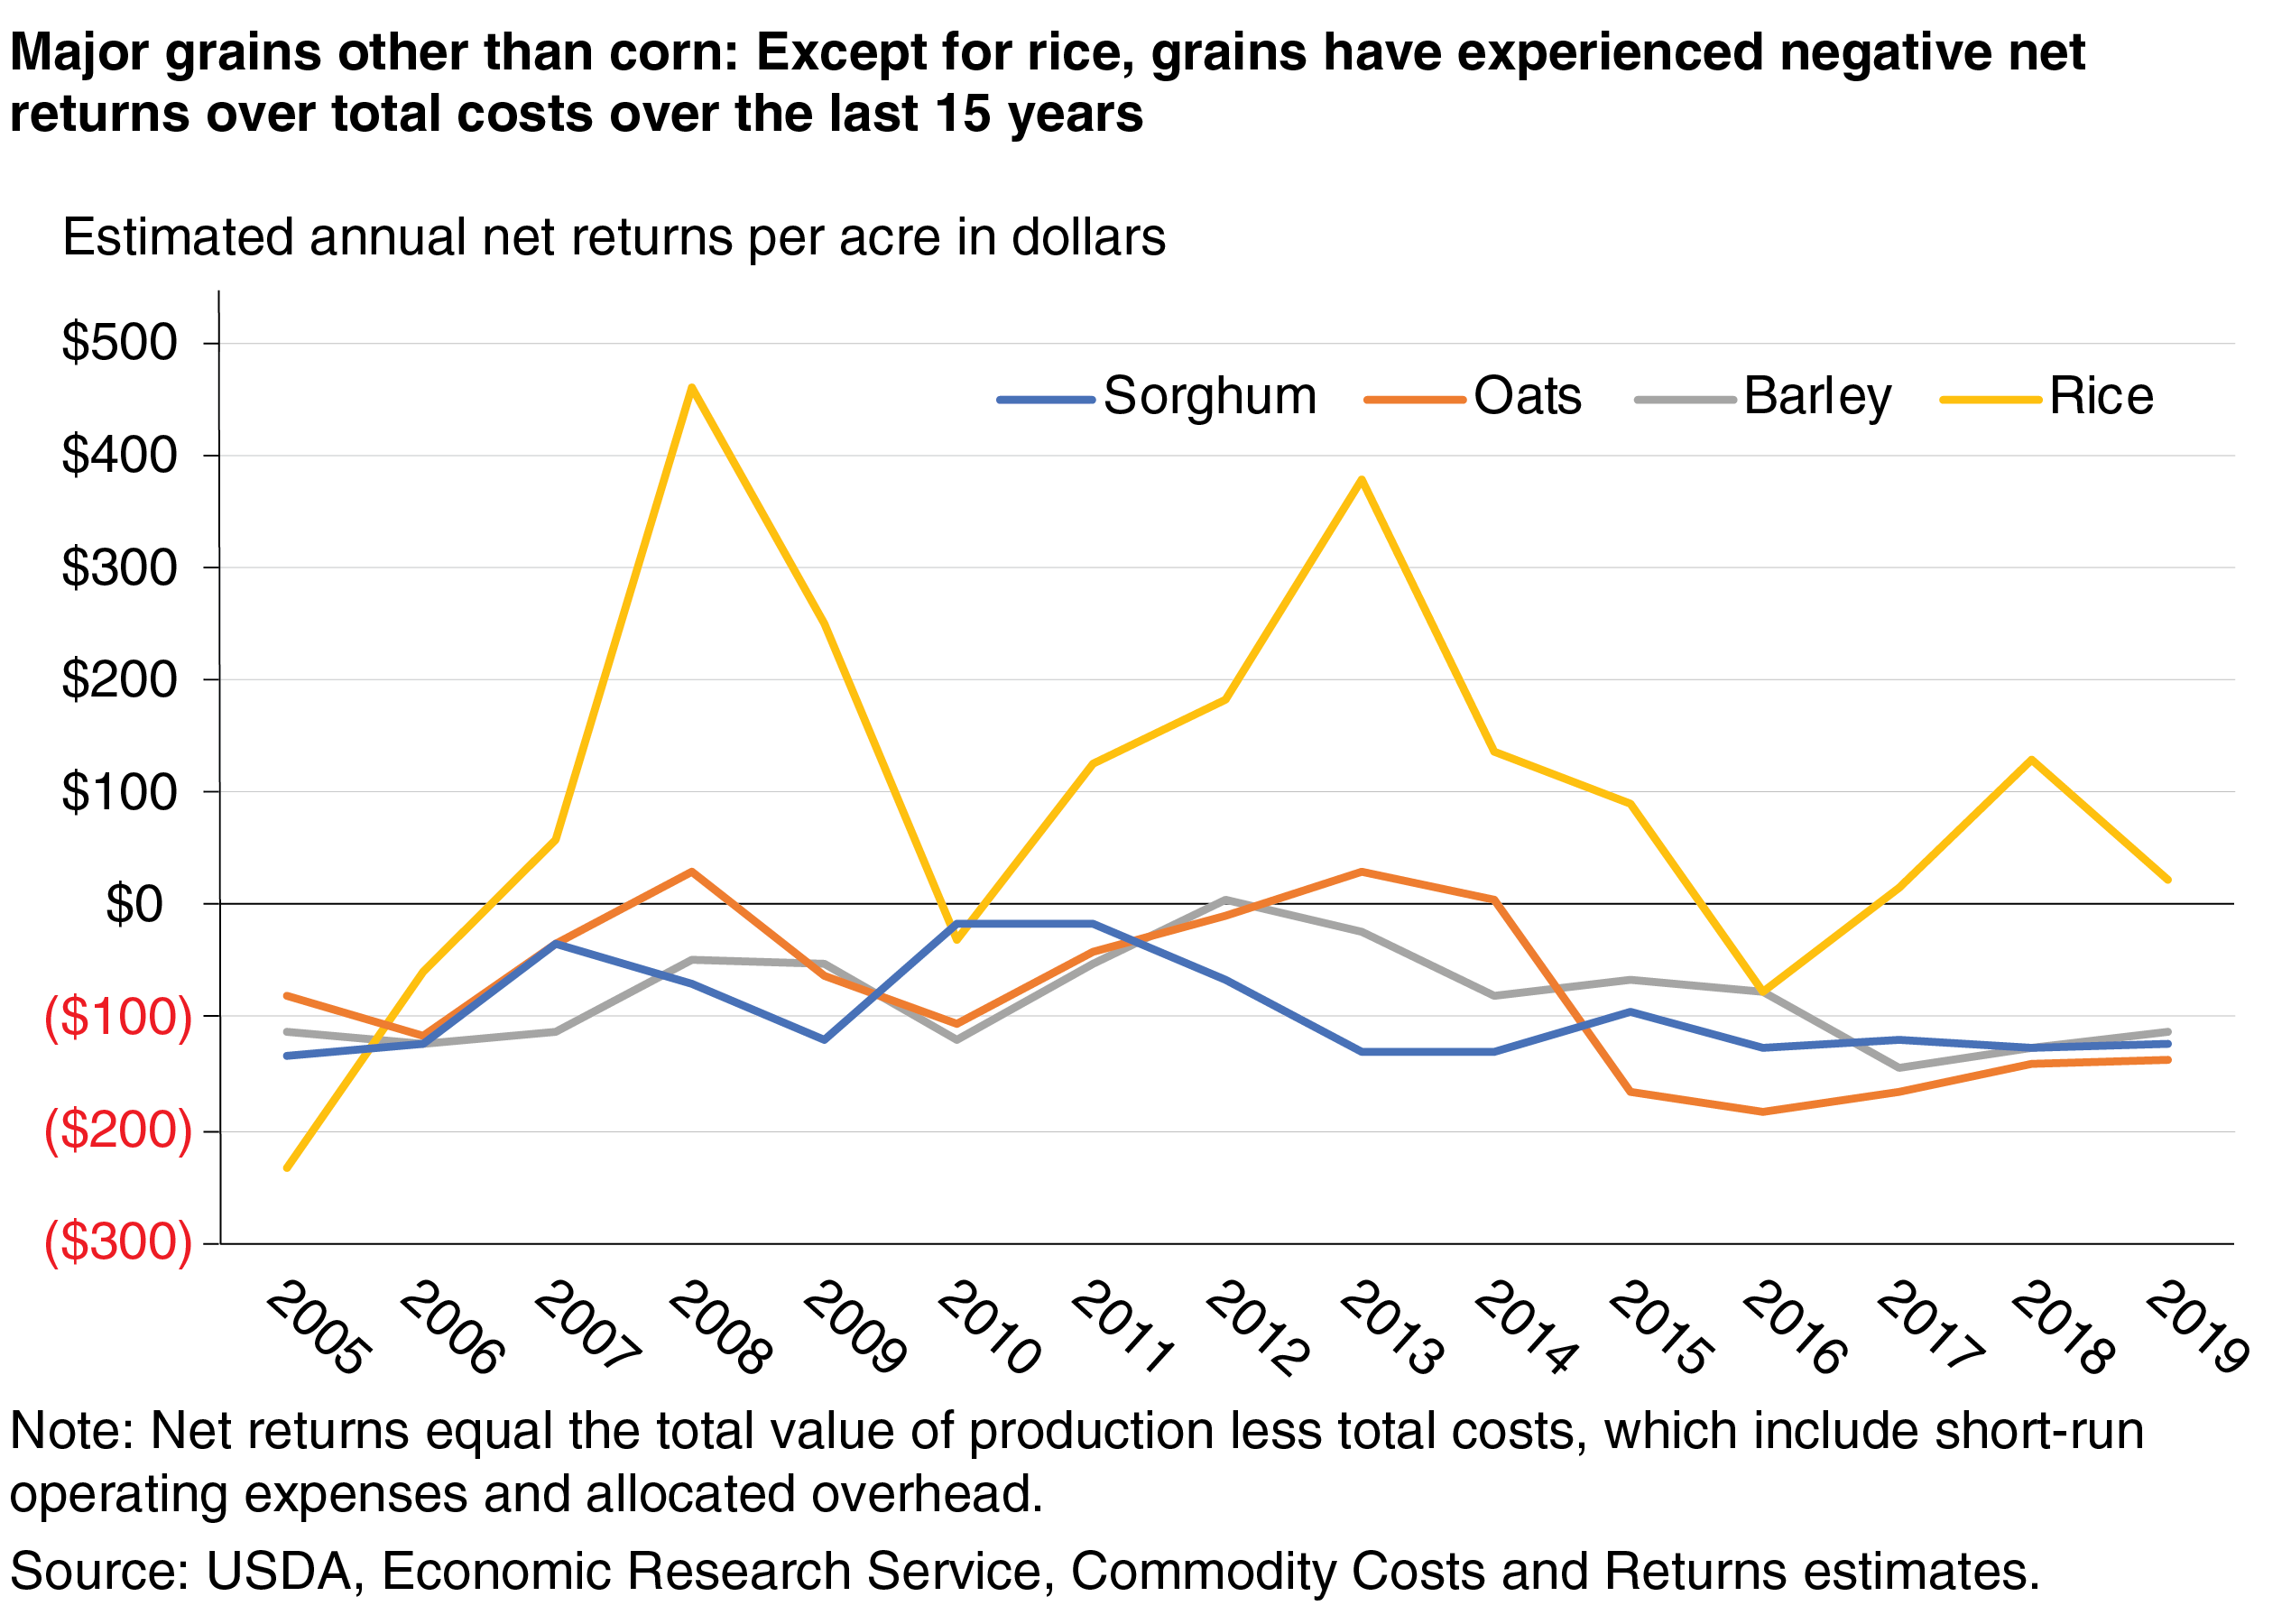
In addition to examining measures of costs and returns, researchers also can examine measures of profitability. The figure above shows, for example, that since 2005, the values of production less total costs for sorghum, barley, and oats have been mostly negative, which suggests that while operating costs may be covered, allocated overhead costs may not be in some cases. The three crops follow a similar trend and exhibit less variation over time compared with rice. The higher net returns for rice since 2009 are attributed to a higher value of production because of price increases stemming from the global rice crisis of 2008.
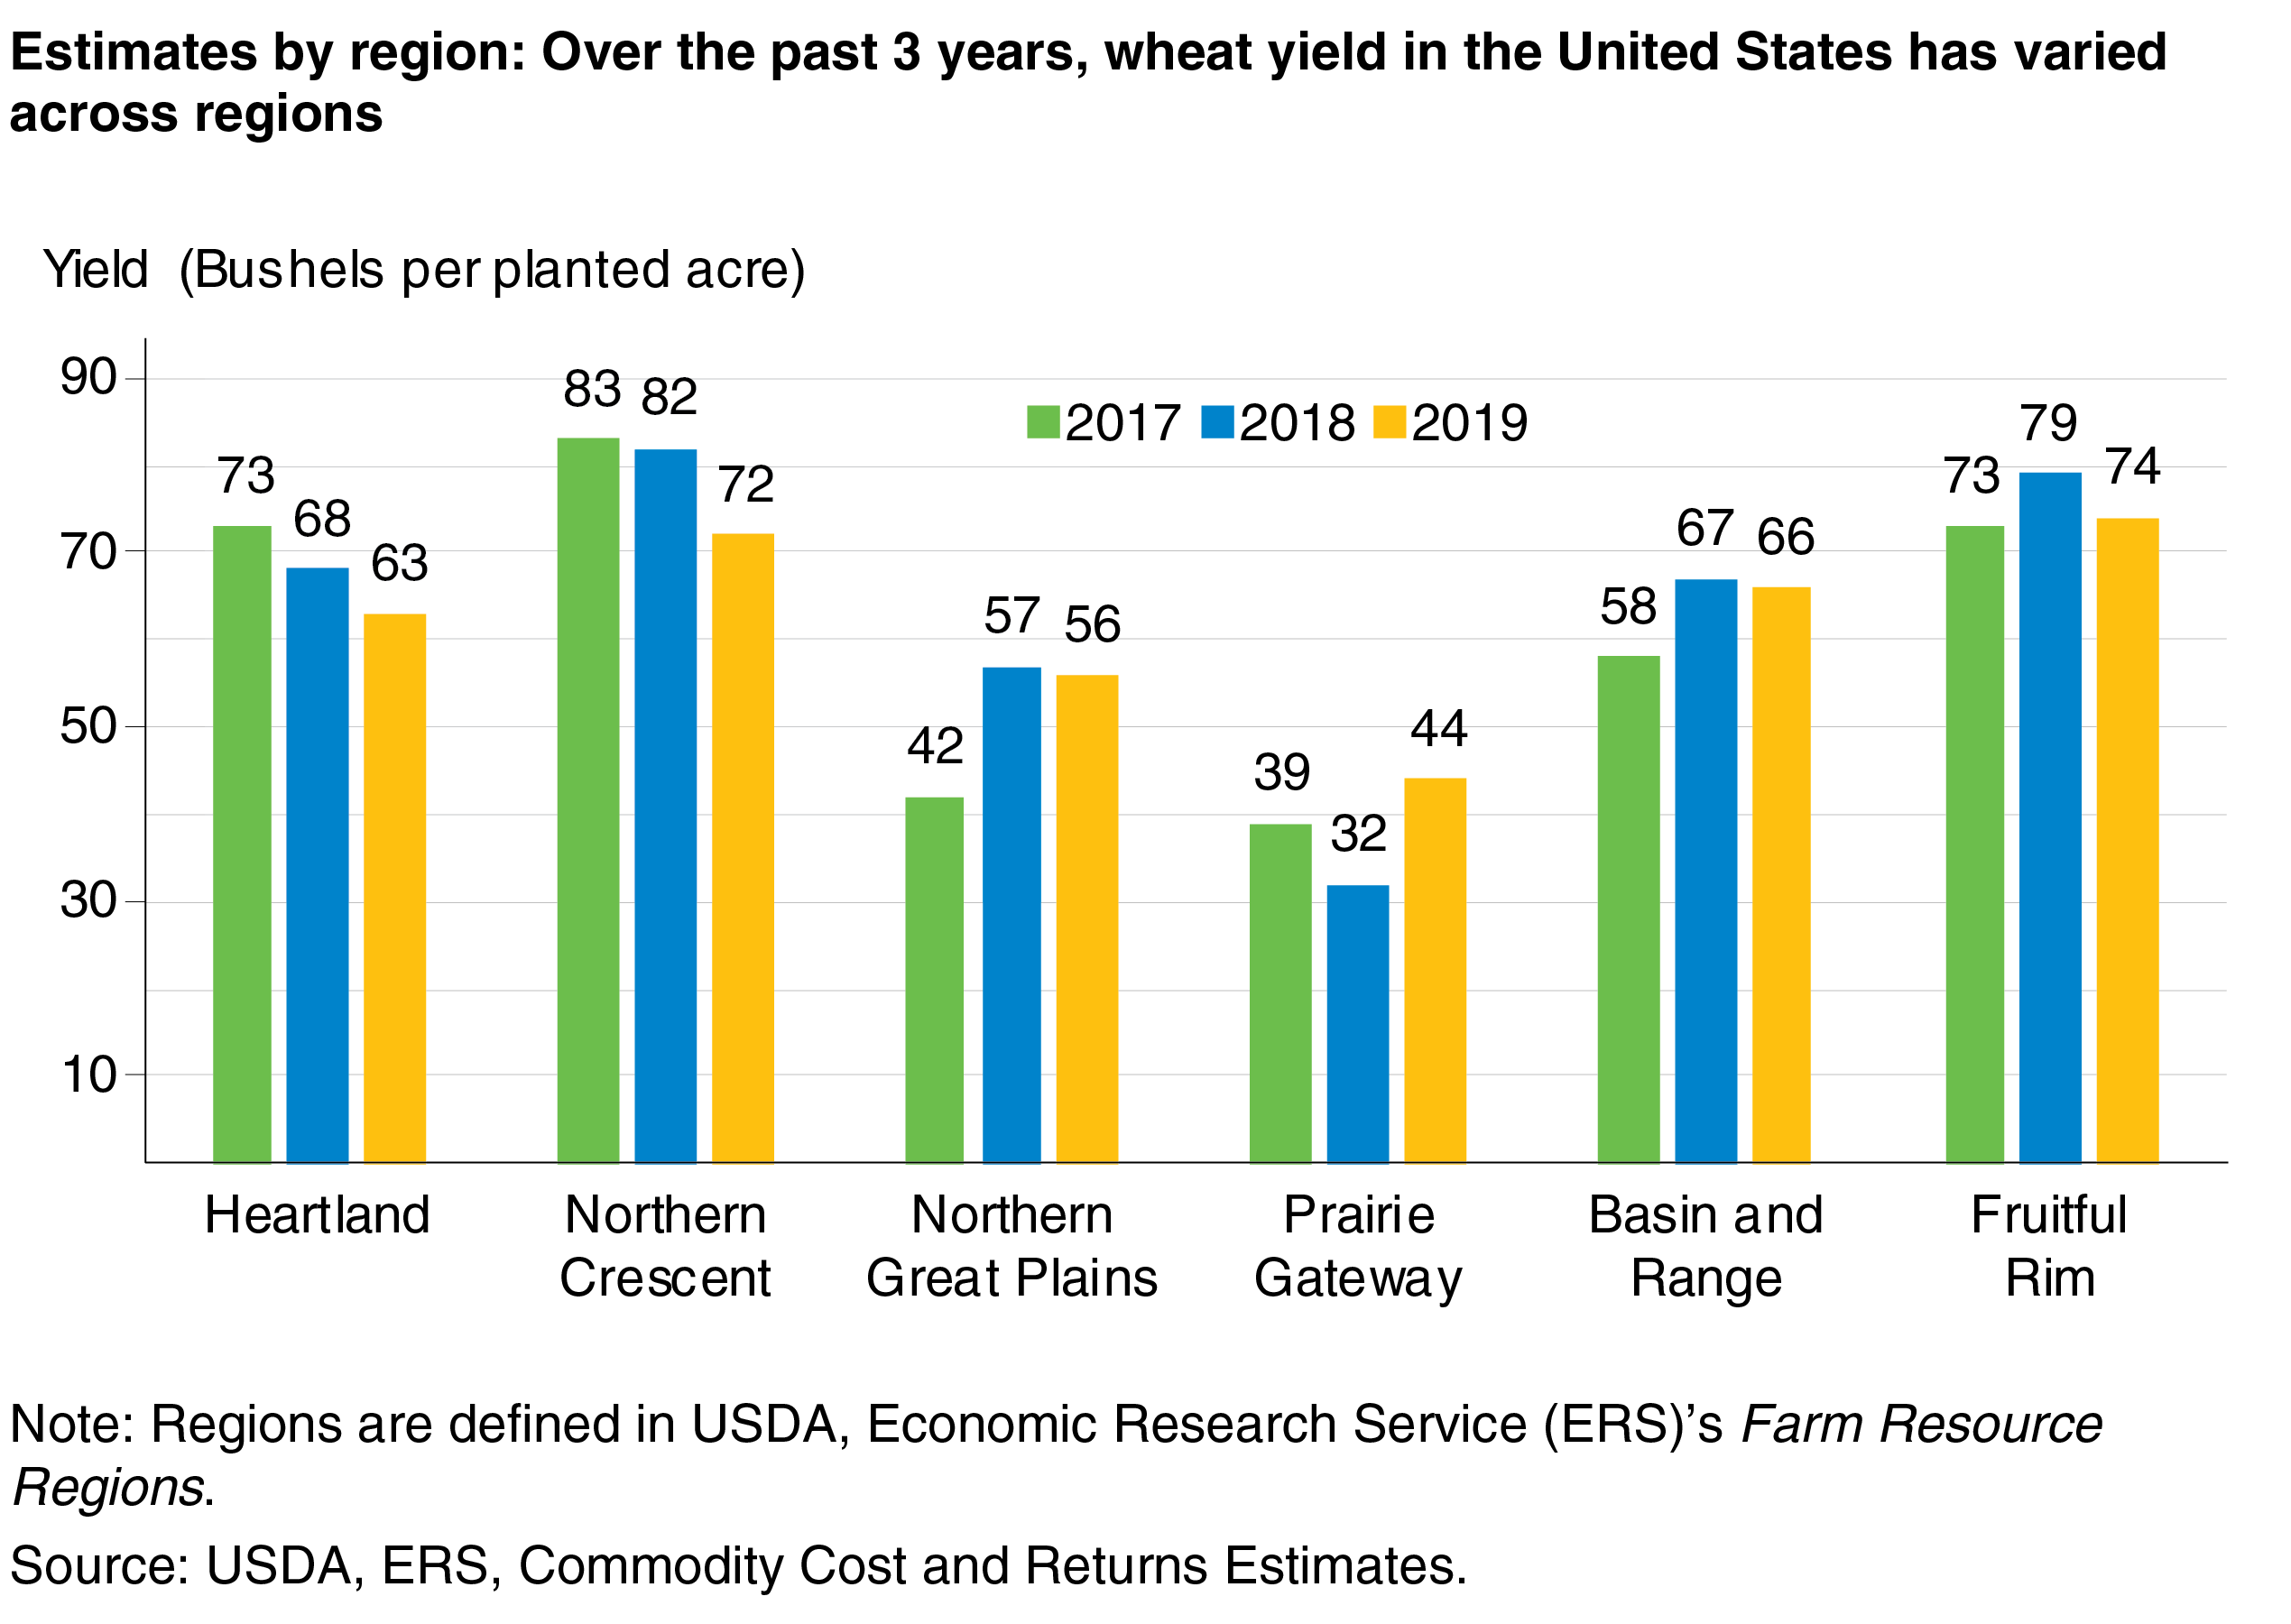
Regional estimates of commodity costs and returns and the factors that influence these costs and returns are also available from the Commodity Costs and Returns data. For example, wheat production and yields vary widely across regions, primarily because of the interaction of climate and different wheat classes (see above figure). During 2017-2019, the Northern Crescent region of the United States, which typically produces winter wheat, realized the highest yields in 2 of the 3 years. However, because farms in this region are the smallest (in terms of number of planted acres), the region is not a major wheat producer. Exploring regional variation in wheat production can help farmers make more accurate decisions about input use, accounting for regional climate differences.
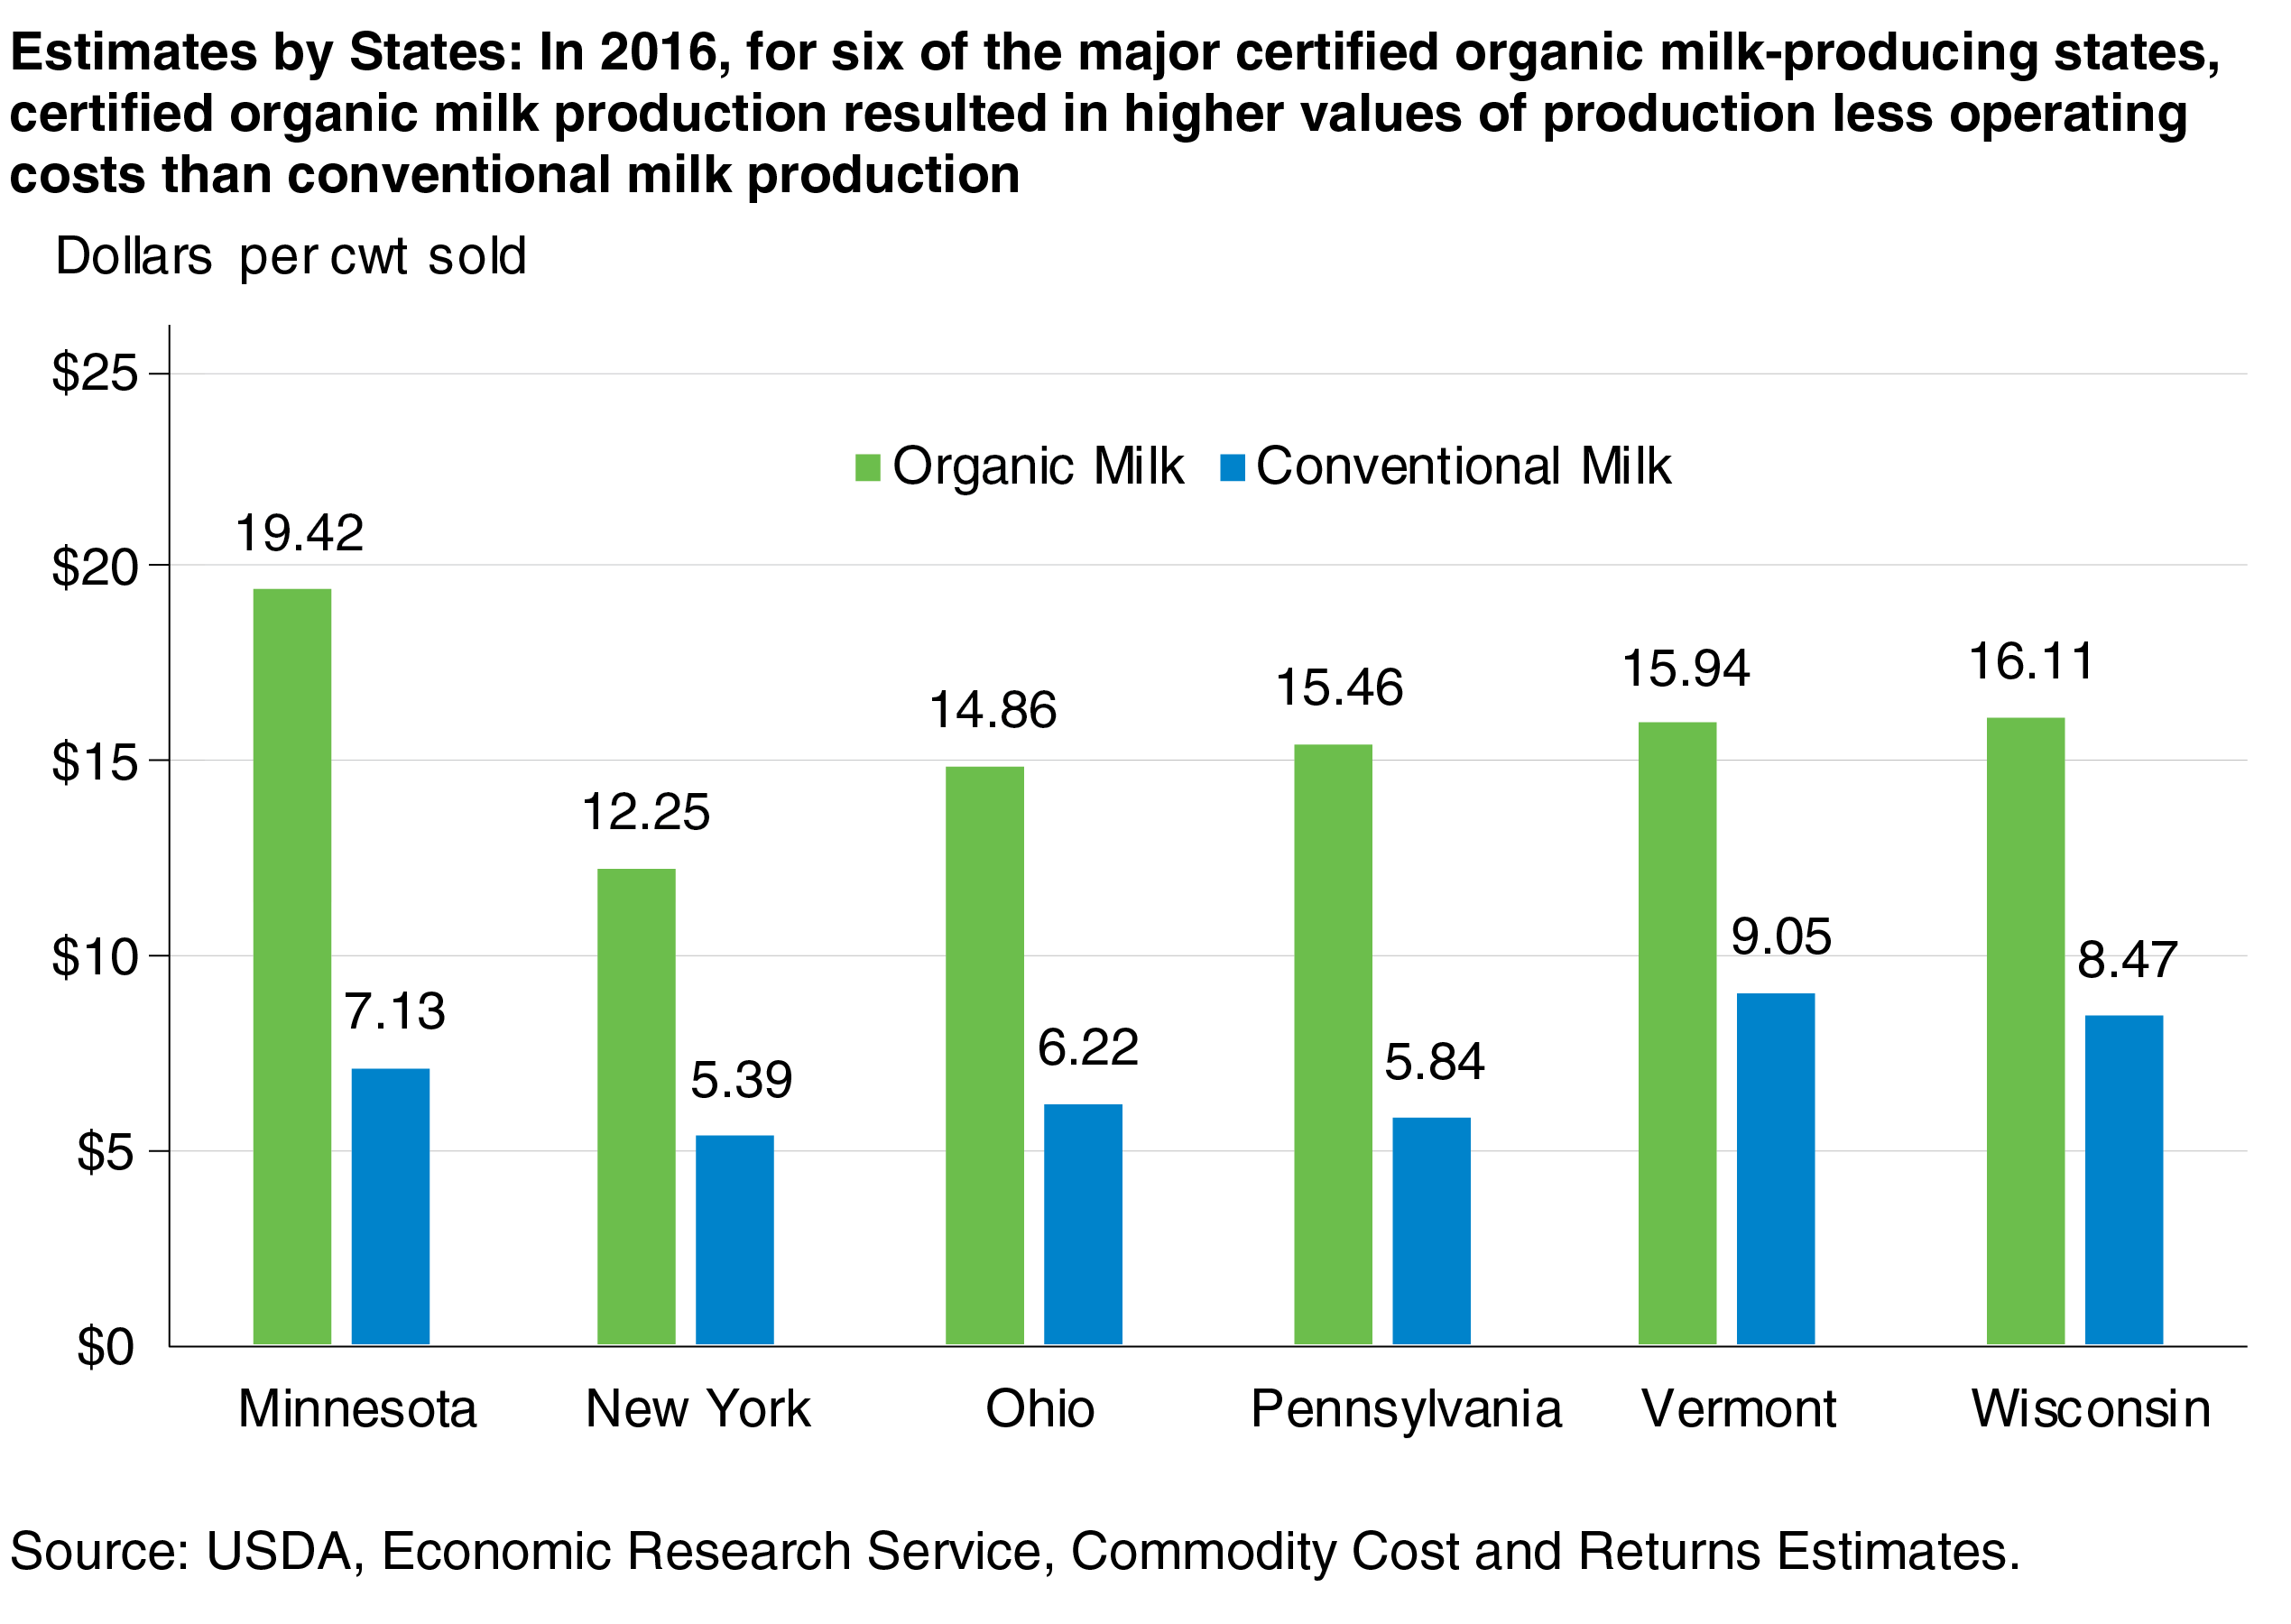
State-level Commodity Costs and Returns estimates are available for milk, both conventional and organic. Estimates from the 2016 data demonstrate that certified organic milk production resulted in higher value of milk production less operating costs compared with conventional dairy operations. While production costs are higher for organic milk than for conventional milk, organic milk commands a higher price. These higher values persisted across six major dairy-producing States. Minnesota and Wisconsin had the highest net values of production for organic milk.
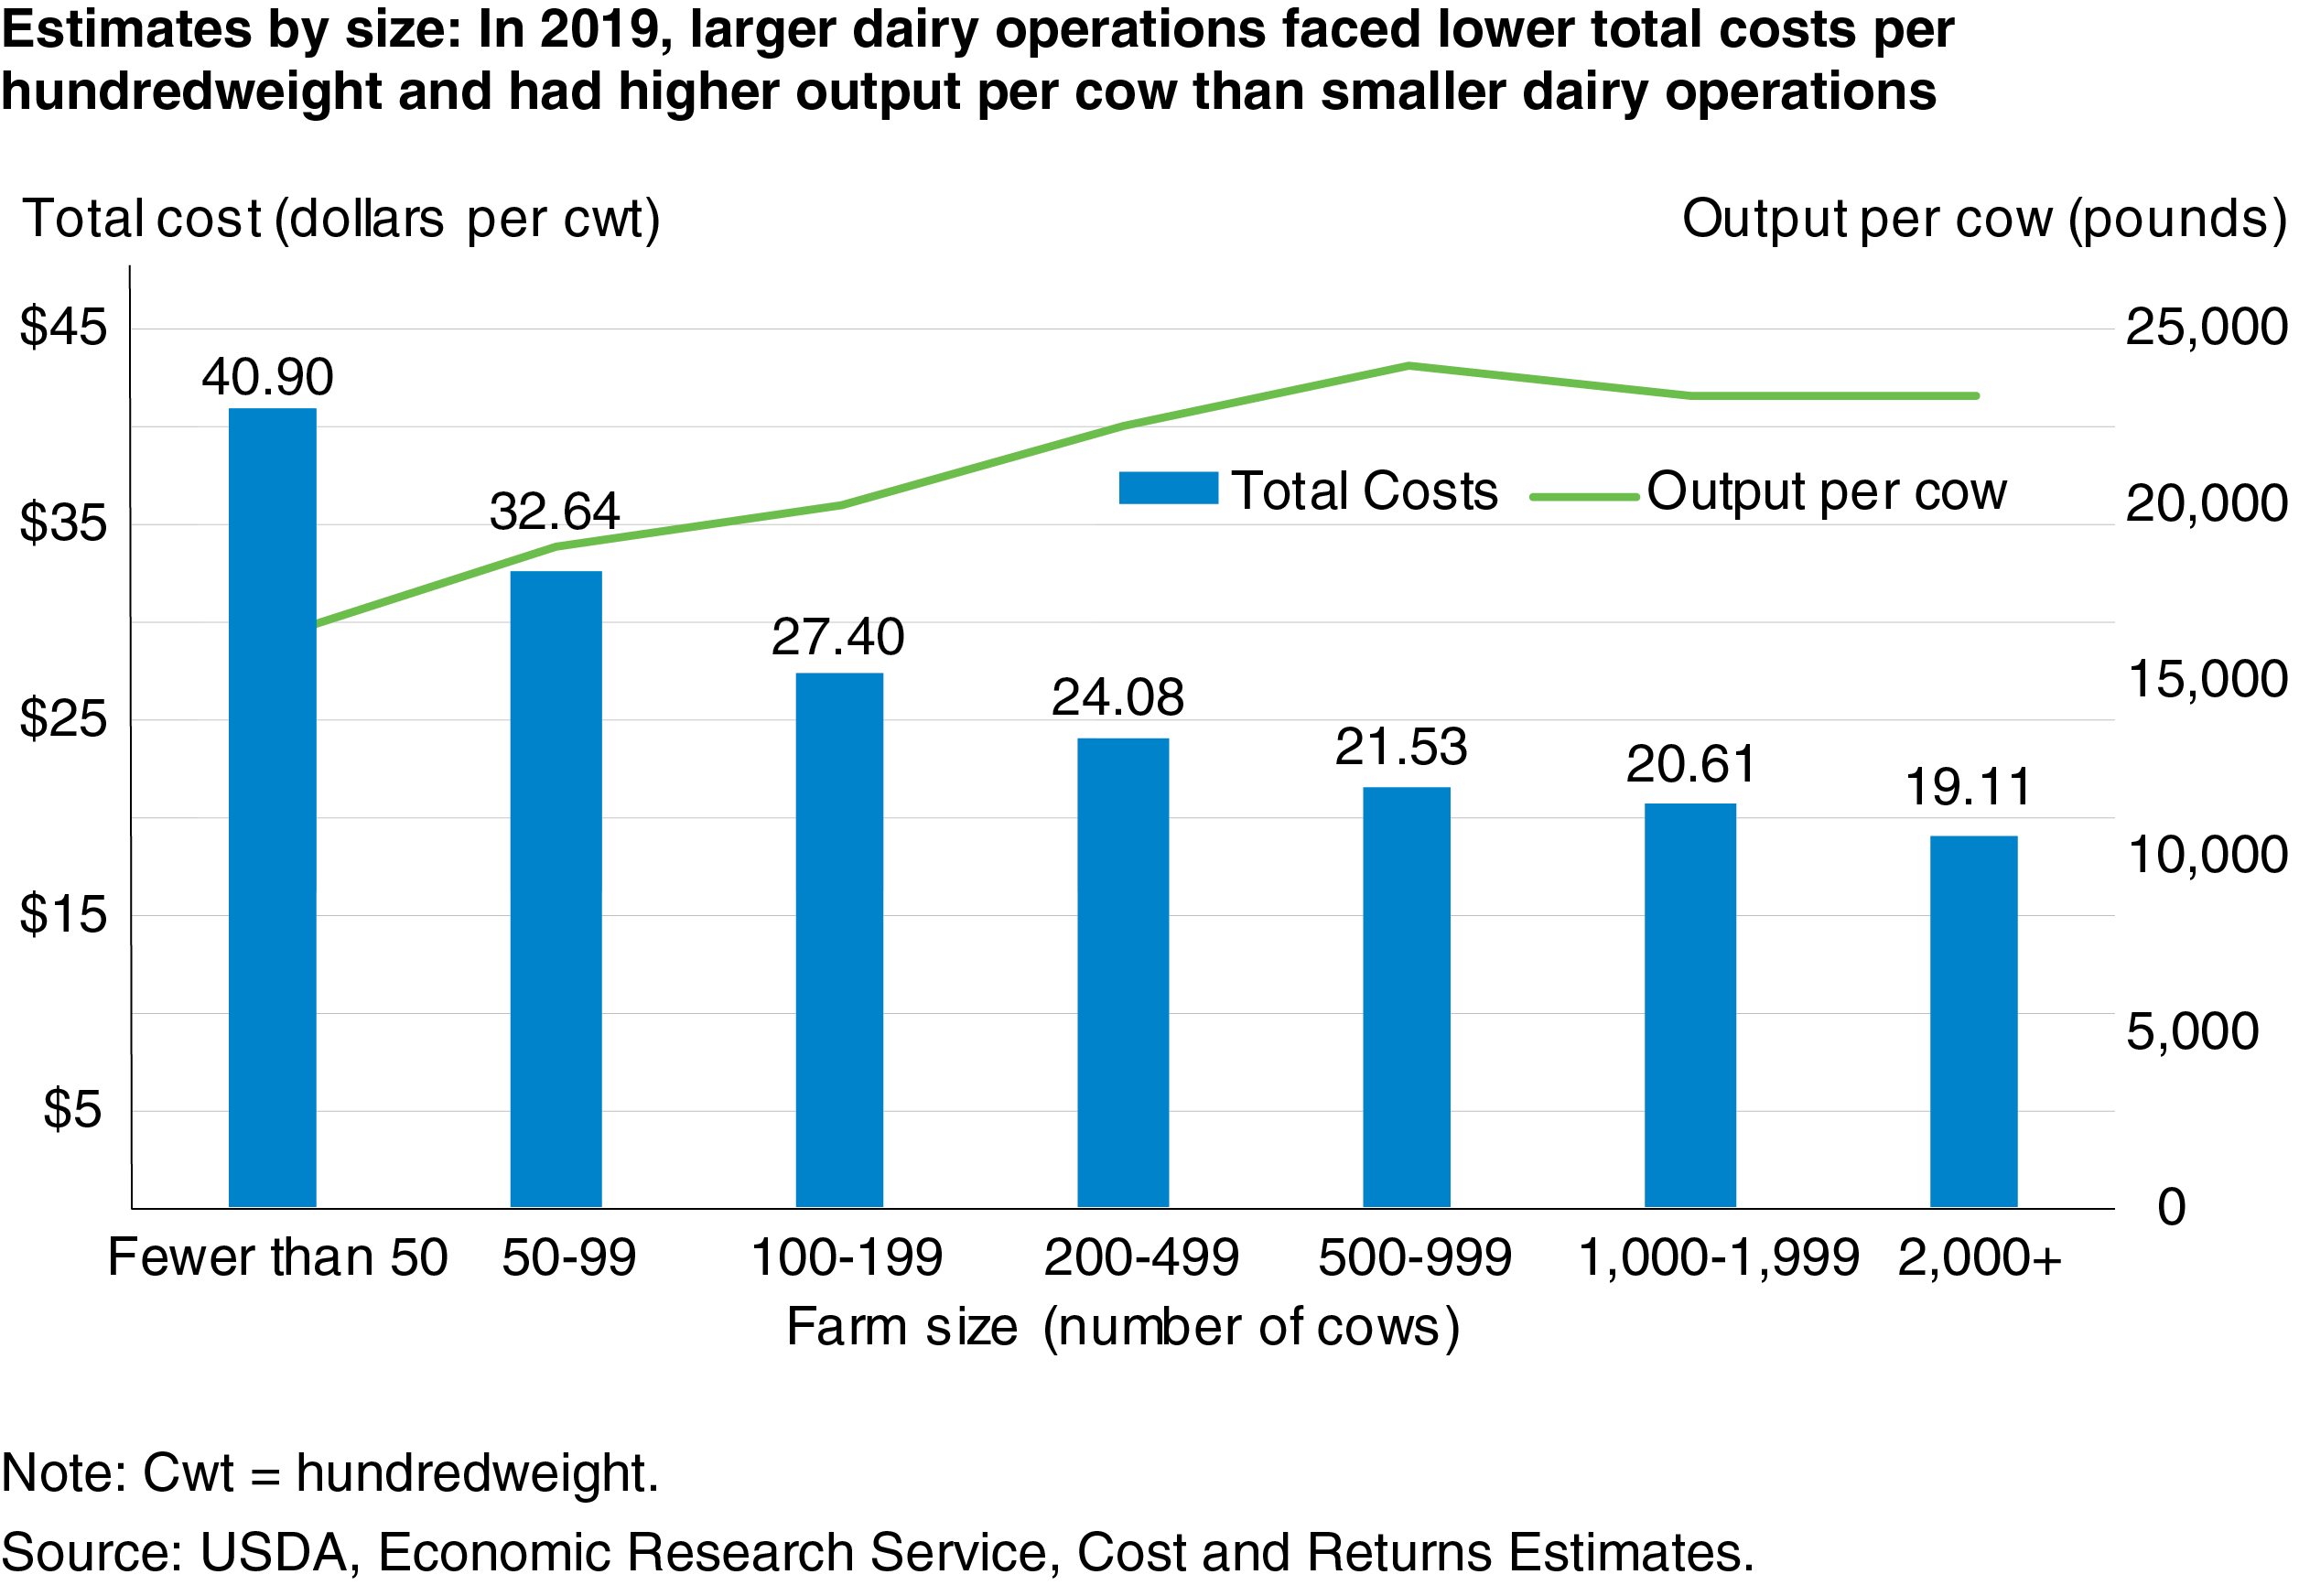
The Commodity Costs and Returns data also allow for examination of costs and returns by operation size. The figure above suggests the existence of scale economies within the U.S. dairy sector, which indicates that as farms increase in size, total cost per unit of milk as measured in dollars per hundredweight (cwt) decreases. Smaller dairy operations face significant financial challenges compared with larger dairy farms. In 2019, an operation with 2,000 or more cows, on average, had total costs per unit of milk produced ($19.11 per cwt) that were half of those for an operation with fewer than 50 cows ($40.90 per cwt). In addition, larger operations had higher output per cow. This demonstrates how difficult it can be for smaller operations to be profitable in the dairy sector.
The ERS Commodity Costs and Returns data product provides a database that can be used by stakeholders including policymakers, producer groups, agribusiness, academics, and others. It is unique in that it provides U.S., regional, and in some cases, State and size estimates that are representative of the commodity costs and returns associated with U.S. agriculture.
This article is drawn from:
- Commodity Costs and Returns - Interactive Visualization: U.S. Commodity Costs and Returns by Region and by Commodity. (n.d.). U.S. Department of Agriculture, Economic Research Service.
- Commodity Costs and Returns. (n.d.). U.S. Department of Agriculture, Economic Research Service.
You may also like:
- Heimlich, R. (2000). Farm Resource Regions. U.S. Department of Agriculture, Economic Research Service. AIB-760.
- Foreman, L. (2014). Characteristics and Production Costs of U.S. Corn Farms, Including Organic, 2010. U.S. Department of Agriculture, Economic Research Service. EIB-128.
- MacDonald, J.M., Law, J. & Mosheim, R. (2020). Consolidation in U.S. Dairy Farming. U.S. Department of Agriculture, Economic Research Service. ERR-274.
- McBride, W.D., Raszap Skorbiansky, S. & Childs, N. (2018). U.S. Rice Production in the New Millennium: Changes in Structure, Practices, and Costs. U.S. Department of Agriculture, Economic Research Service. EIB-202.
- Vocke, G. & Ali, M. (2013). U.S. Wheat Production Practices, Costs, and Yields: Variations Across Regions. U.S. Department of Agriculture, Economic Research Service. EIB-116.


