Number of Food-Insecure People in Selected Low- and Middle-Income Countries Projected To Fall 45 percent Over Next Decade
- by Birgit Meade
- 11/4/2019
Every summer, ERS publishes its annual International Food Security Assessment (IFSA). The report presents current-year estimates and 10-year projections of 3 major food security indicators for 76 low-and middle- income countries around the world that traditionally have been recipients of international food aid. The three major food security indicators are: (1) the number of food-insecure people, (2) the food-insecure population share in each of those countries, and (3) the food gap, which describes the amount of food each food-insecure person would need to reach the nutritional target of 2,100 calories per capita per day—the lower bound of average calorie requirements across all regions, assuming a healthy and active lifestyle.
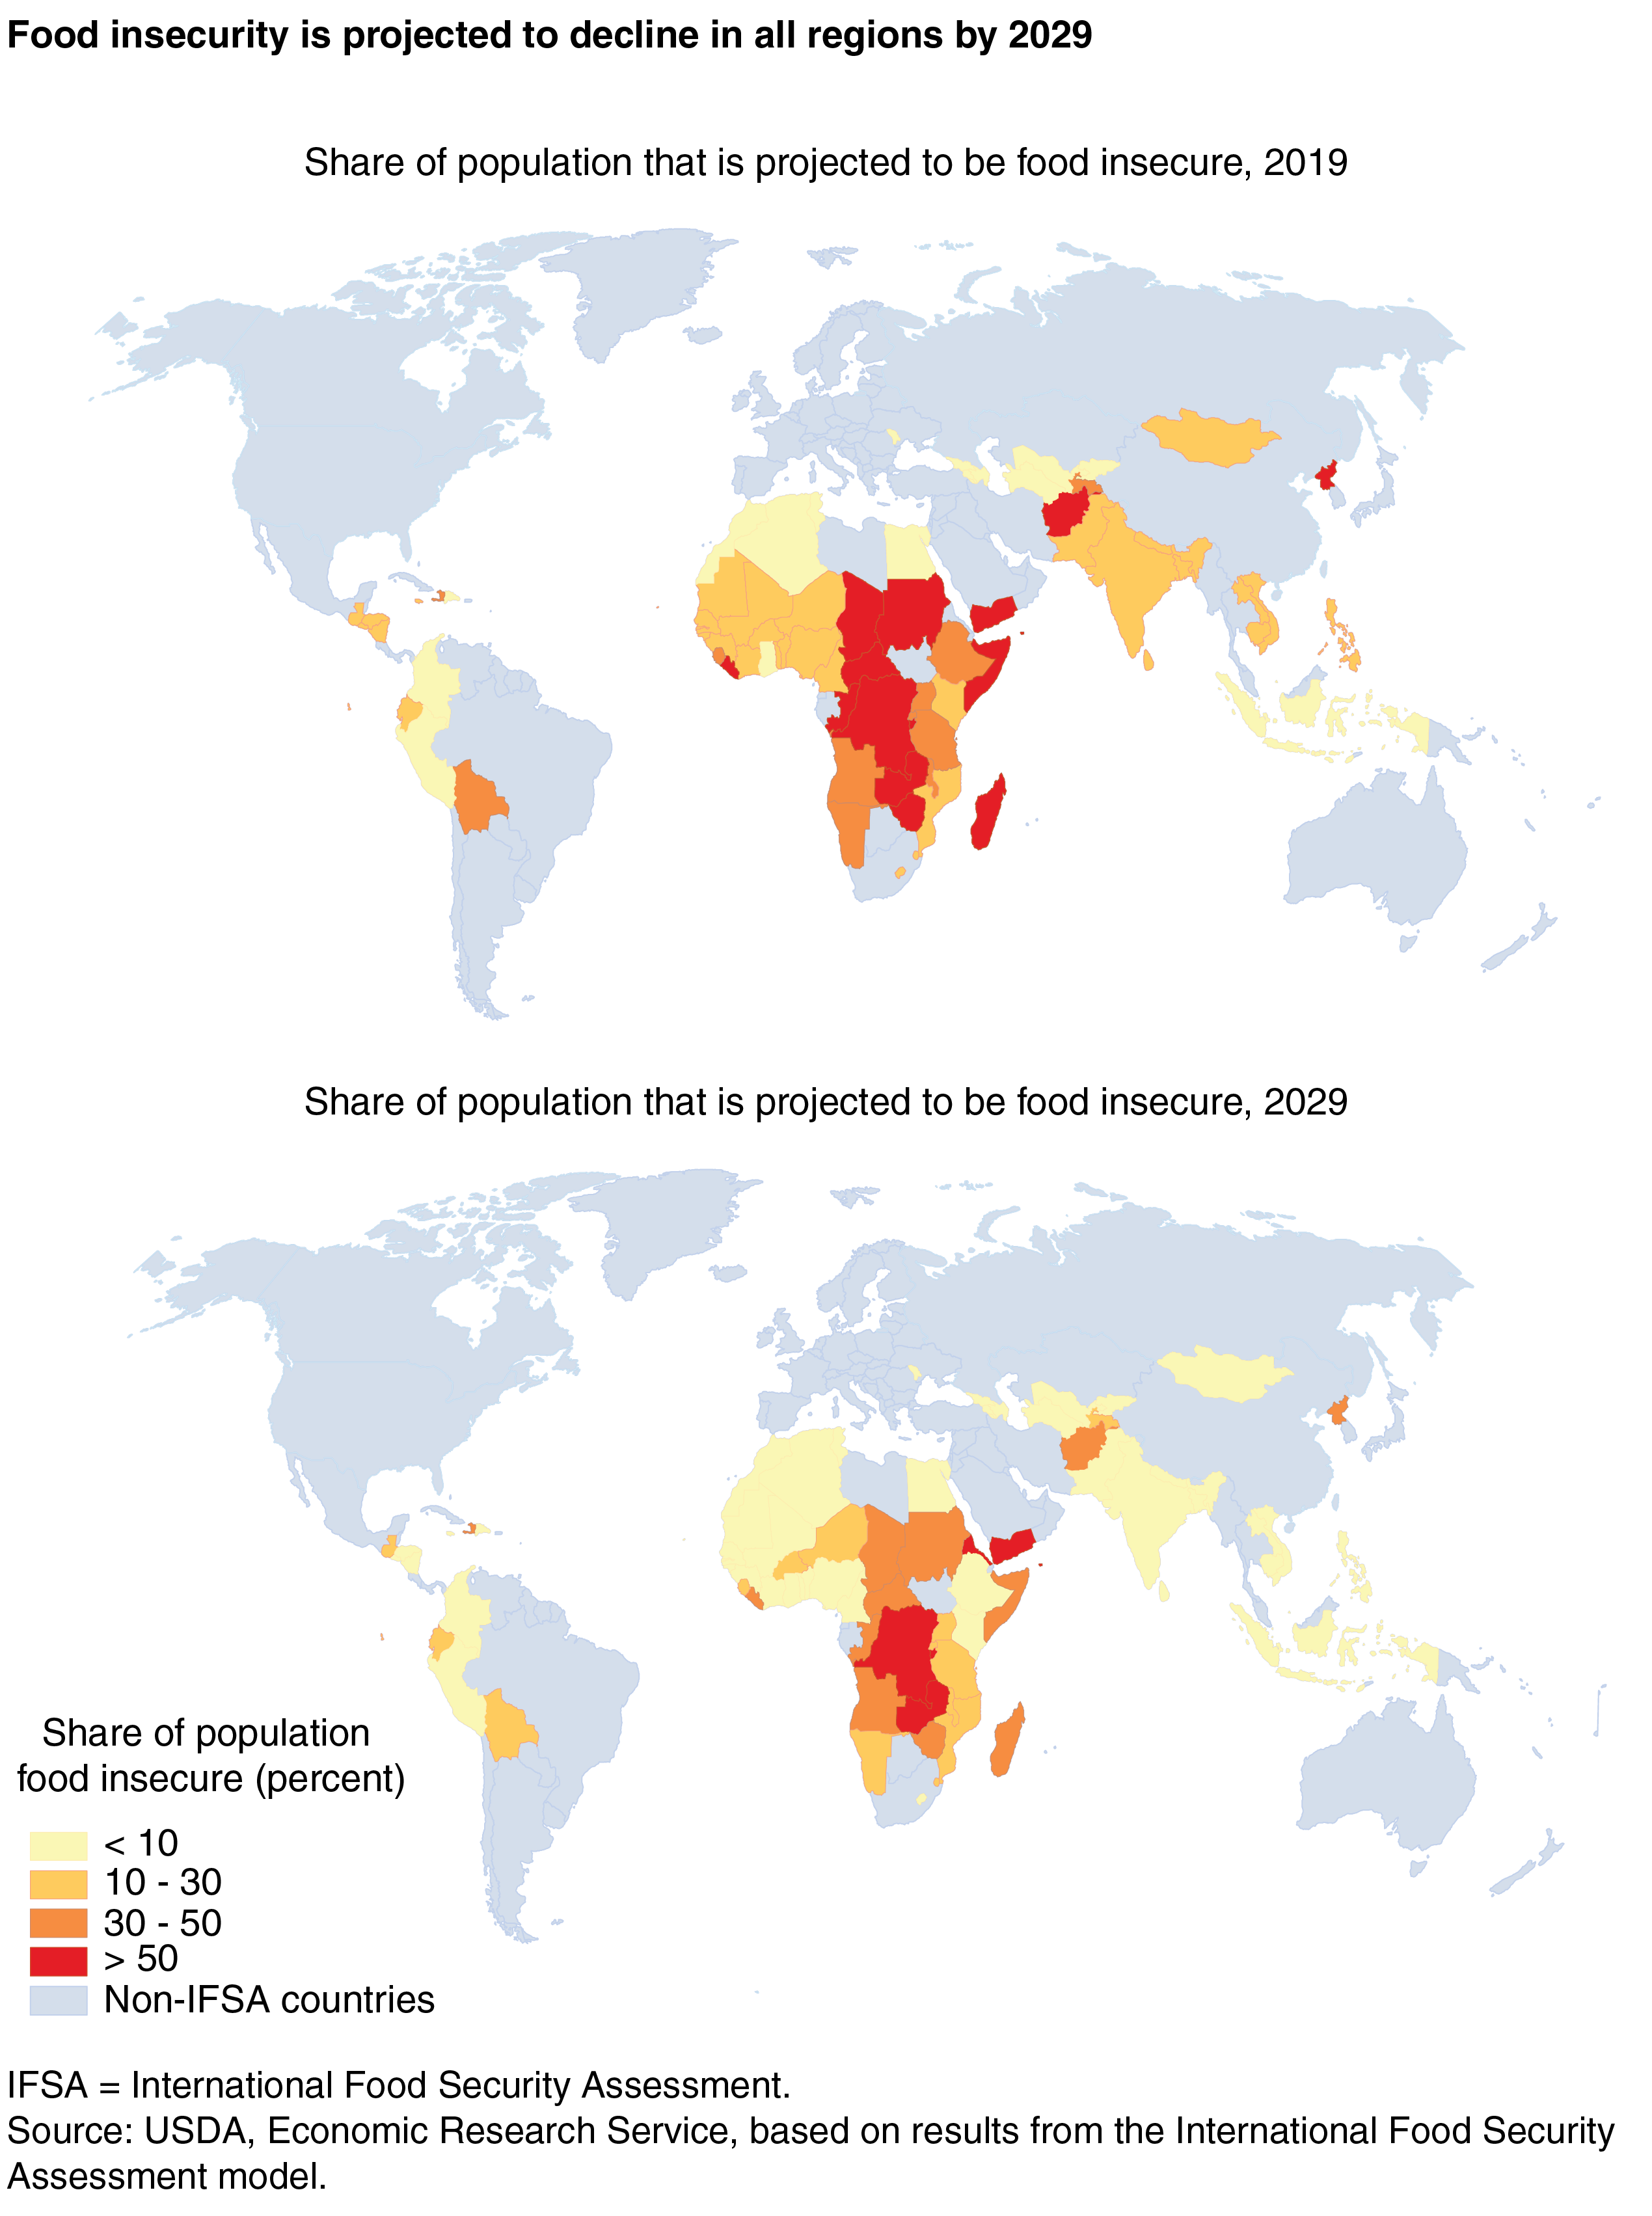
Given projections for increasing per capita incomes and lower food prices, food security is expected to improve in all regions studied over the next 10 years, with the share of people unable to reach the nutritional target projected to decline from 19 to 9 percent of the regional populations. This represents a decline from 728 million people currently estimated to be food insecure to fewer than 400 million food-insecure people in 2029, despite growing populations in the regions studied.
These estimates and projections are derived from ERS’ International Food Security Assessment model, a demand-driven framework that translates available household income into food demand. The model assumes that this food demand, based on basic nutrition requirements, incomes, and food prices, will be met either by domestic food production or by importing food. The ERS assessment uses available data on per capita incomes, income distribution, and food prices to arrive at estimates for what share of the population in each of the countries studied is unable to secure sufficient food to reach the nutritional target of 2,100 calories per capita per day. Macroeconomic income projections, population projections, as well as USDA agricultural price projections are used to guide the projections through 2029.
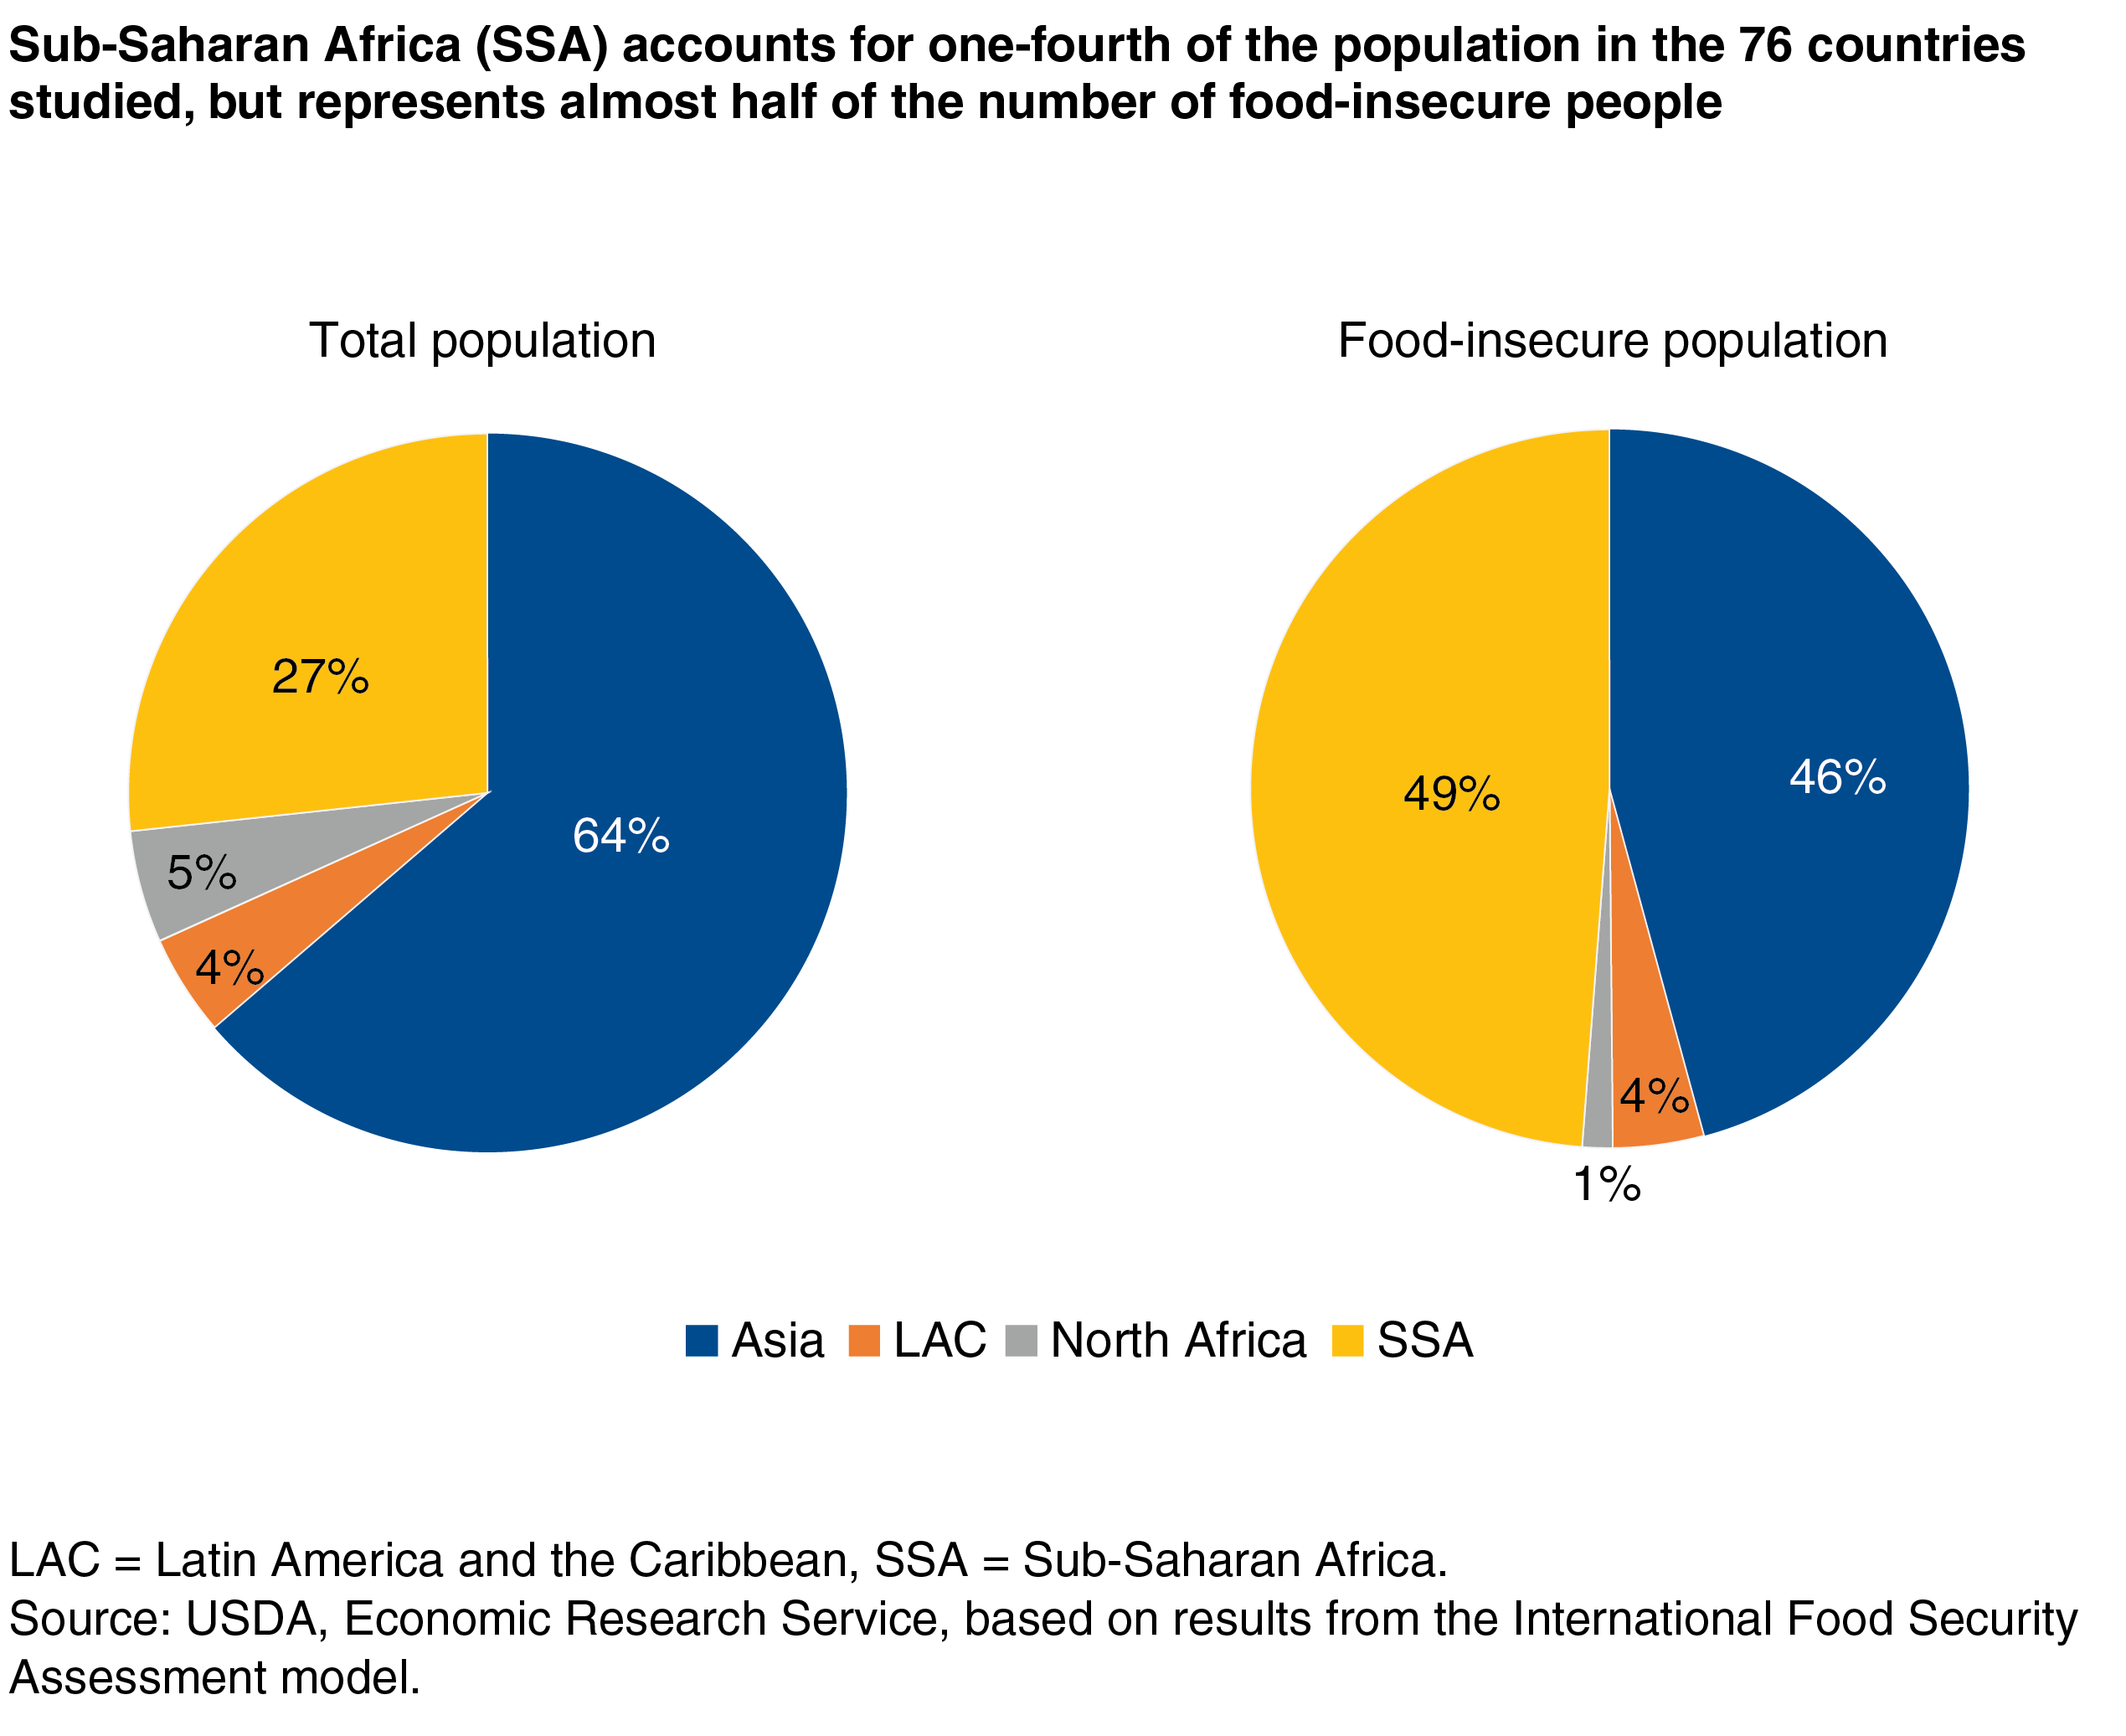
The 76 countries examined in the IFSA are divided into four major regions: Sub-Saharan Africa (SSA), Asia, Latin American and the Caribbean (LAC), and North Africa. As of 2019, Sub-Saharan Africa represents 27 percent of the population of these regions, but accounts for 49 percent of the number of food-insecure people. Conversely, the Asian countries studied represent 64 percent of the total population, but represent 46 percent of the number of food-insecure people.
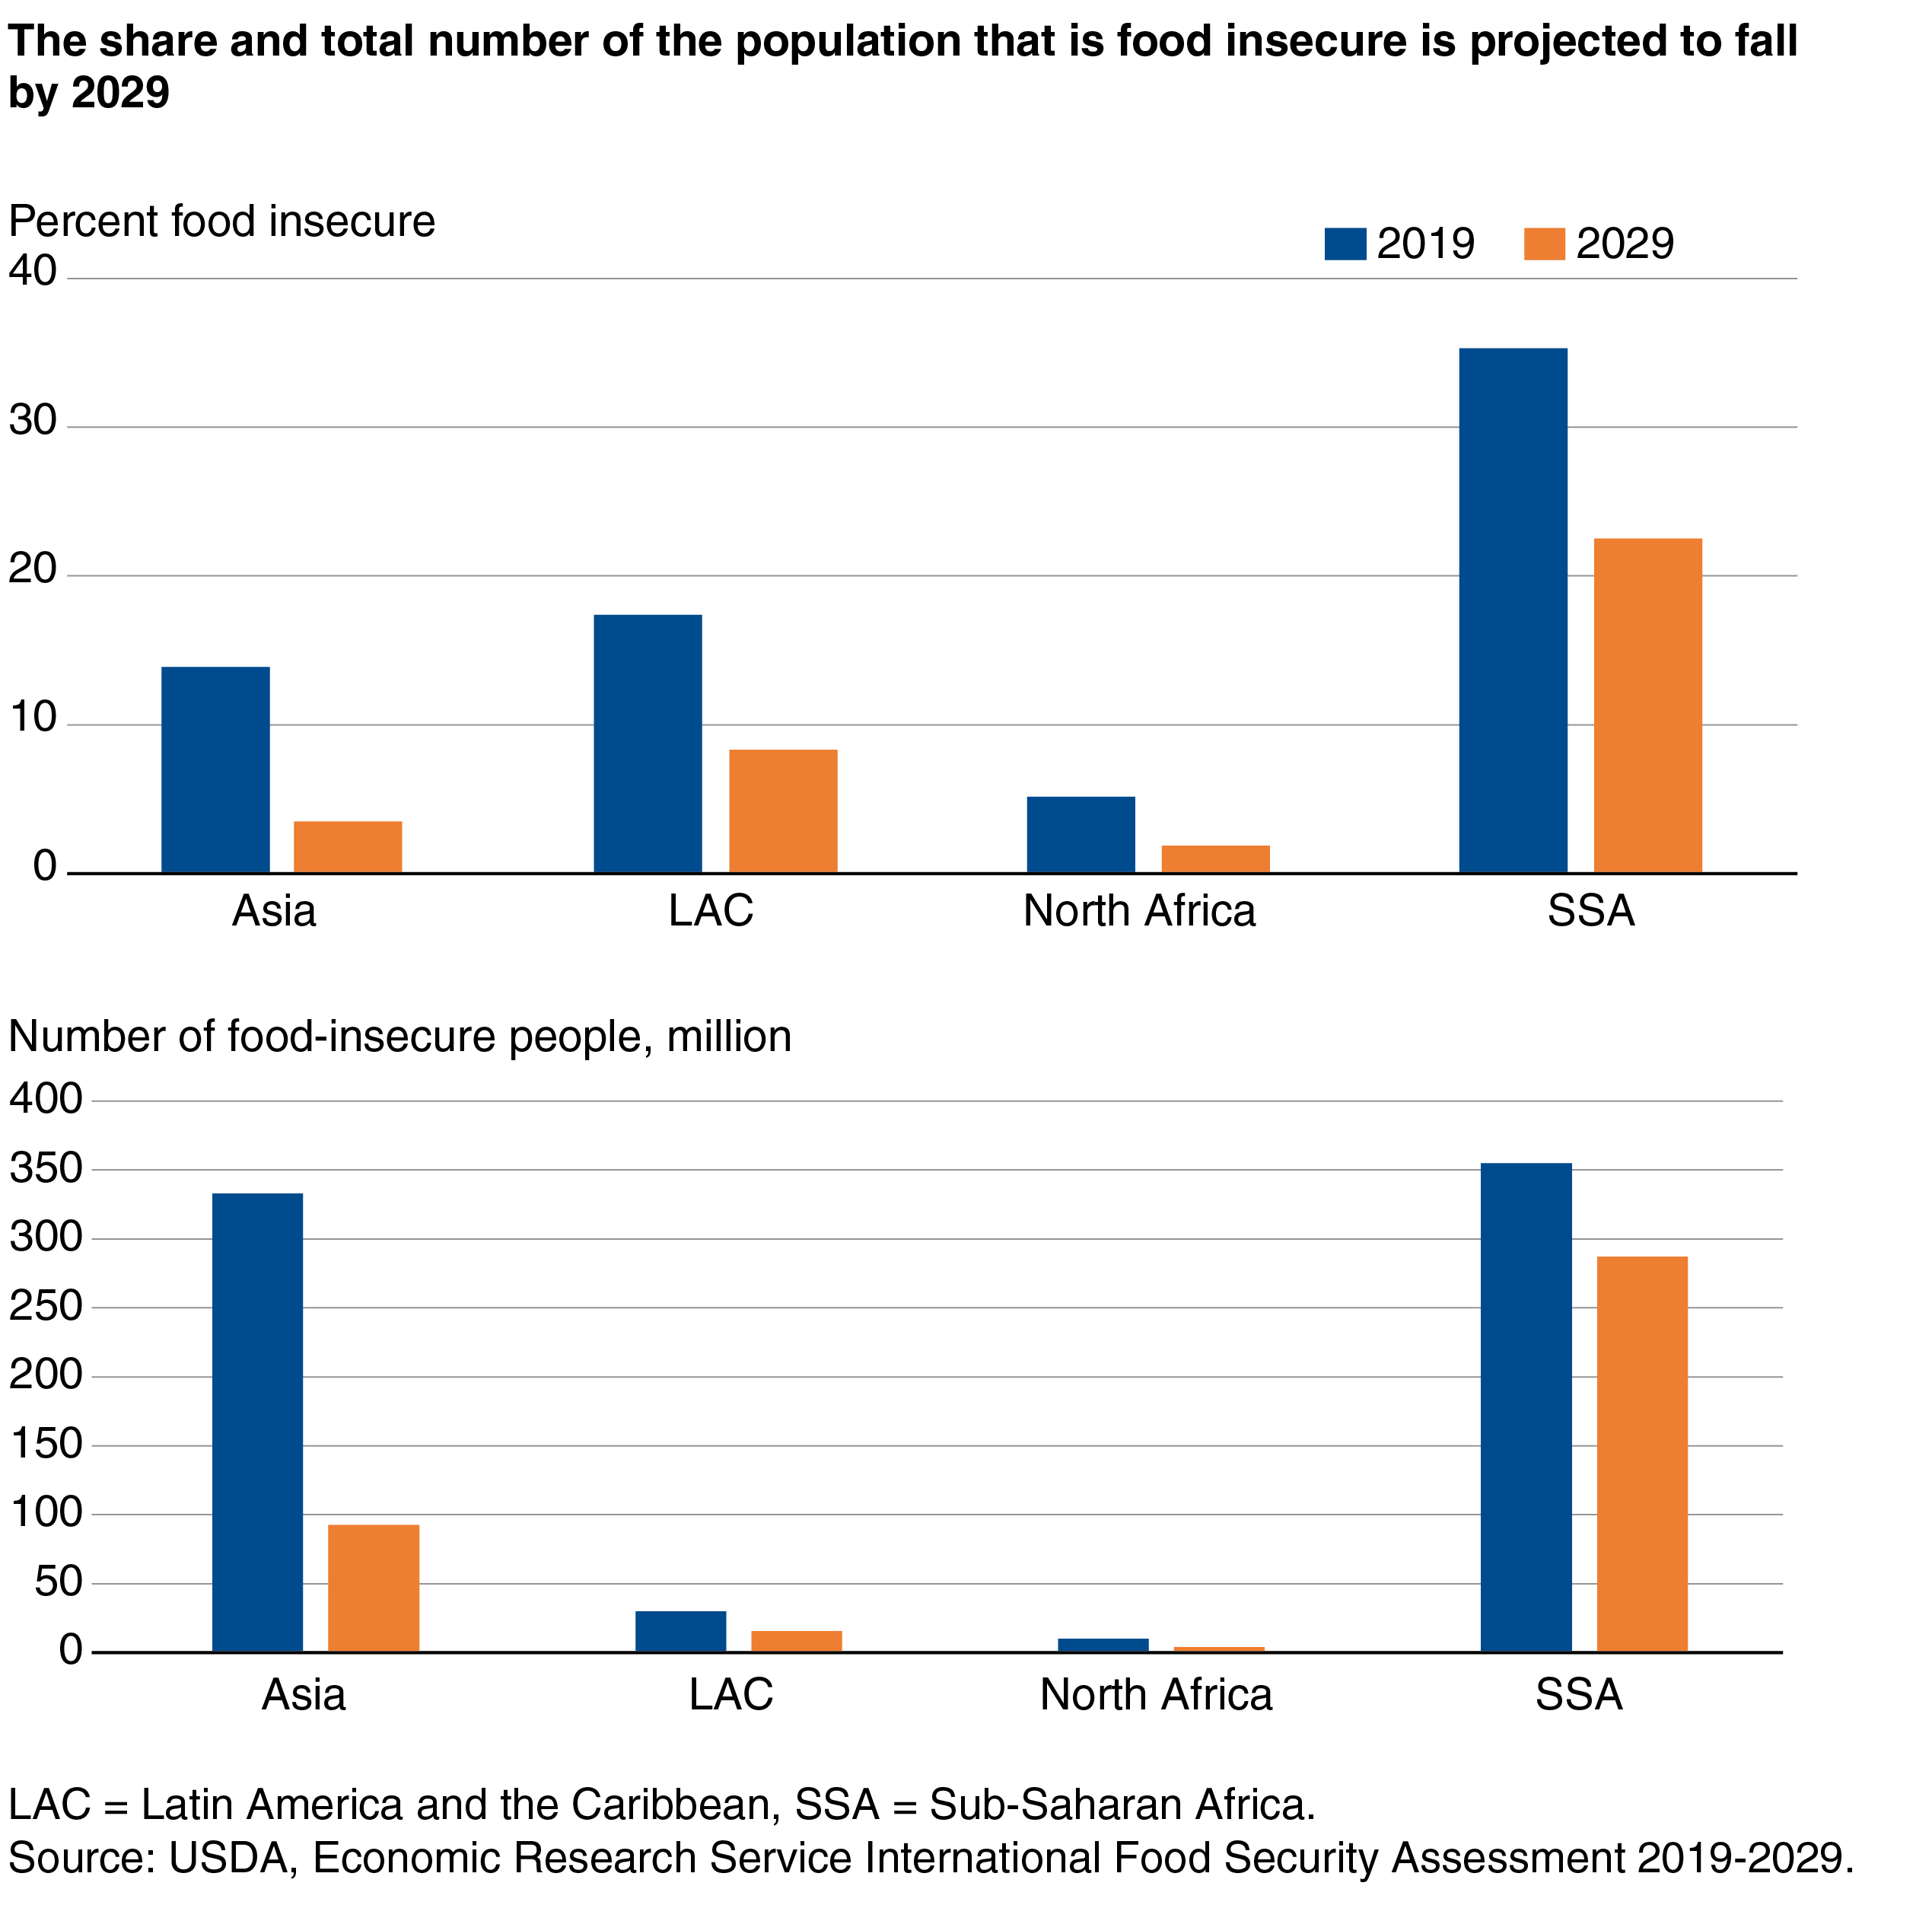
Current levels of food insecurity (based on estimates for 2019) vary greatly across these regions. SSA (39 countries) has the highest share and largest number of food-insecure people: 35.3 percent of the population, or 355 million food-insecure people. Asia (22 countries), despite being the most populous region, has an estimated 333 million food-insecure people, or a share of 13.9 percent in 2019. China, now an upper-middle income country with a population of 1.386 billion in 2017 is not included in this assessment. In Latin America and the Caribbean (11 countries), 17.4 percent of the population is estimated to be food insecure, while North Africa (4 countries) has the lowest share of food-insecure people, at 5.2 percent.
Food security is projected to improve by 2029 in all four regions of the 76 countries covered. The biggest improvements are projected for the Asian region, where food insecurity is projected to decline by 68 percent, from just under 14 percent to 3.5 percent. This significant improvement is driven by strong income growth projections particularly for India, the most populous country included in this study. In North Africa, the number of food-insecure people is projected to decrease by more than half, with less than 2 percent of the population projected as food insecure in 2029. In LAC, the share of the population that is food insecure is projected to decrease by more than half, falling to 8.3 percent by 2029. SSA is projected to see the slowest improvement in food security, with the share of food-insecure people falling 36 percent to 22.5 percent of the population.
Over the next 10 years, the total share of the population that is food insecure in the 76 countries studied is projected to fall to 9.2 percent (399 million people) by 2029, a 45-percent drop from 2019.
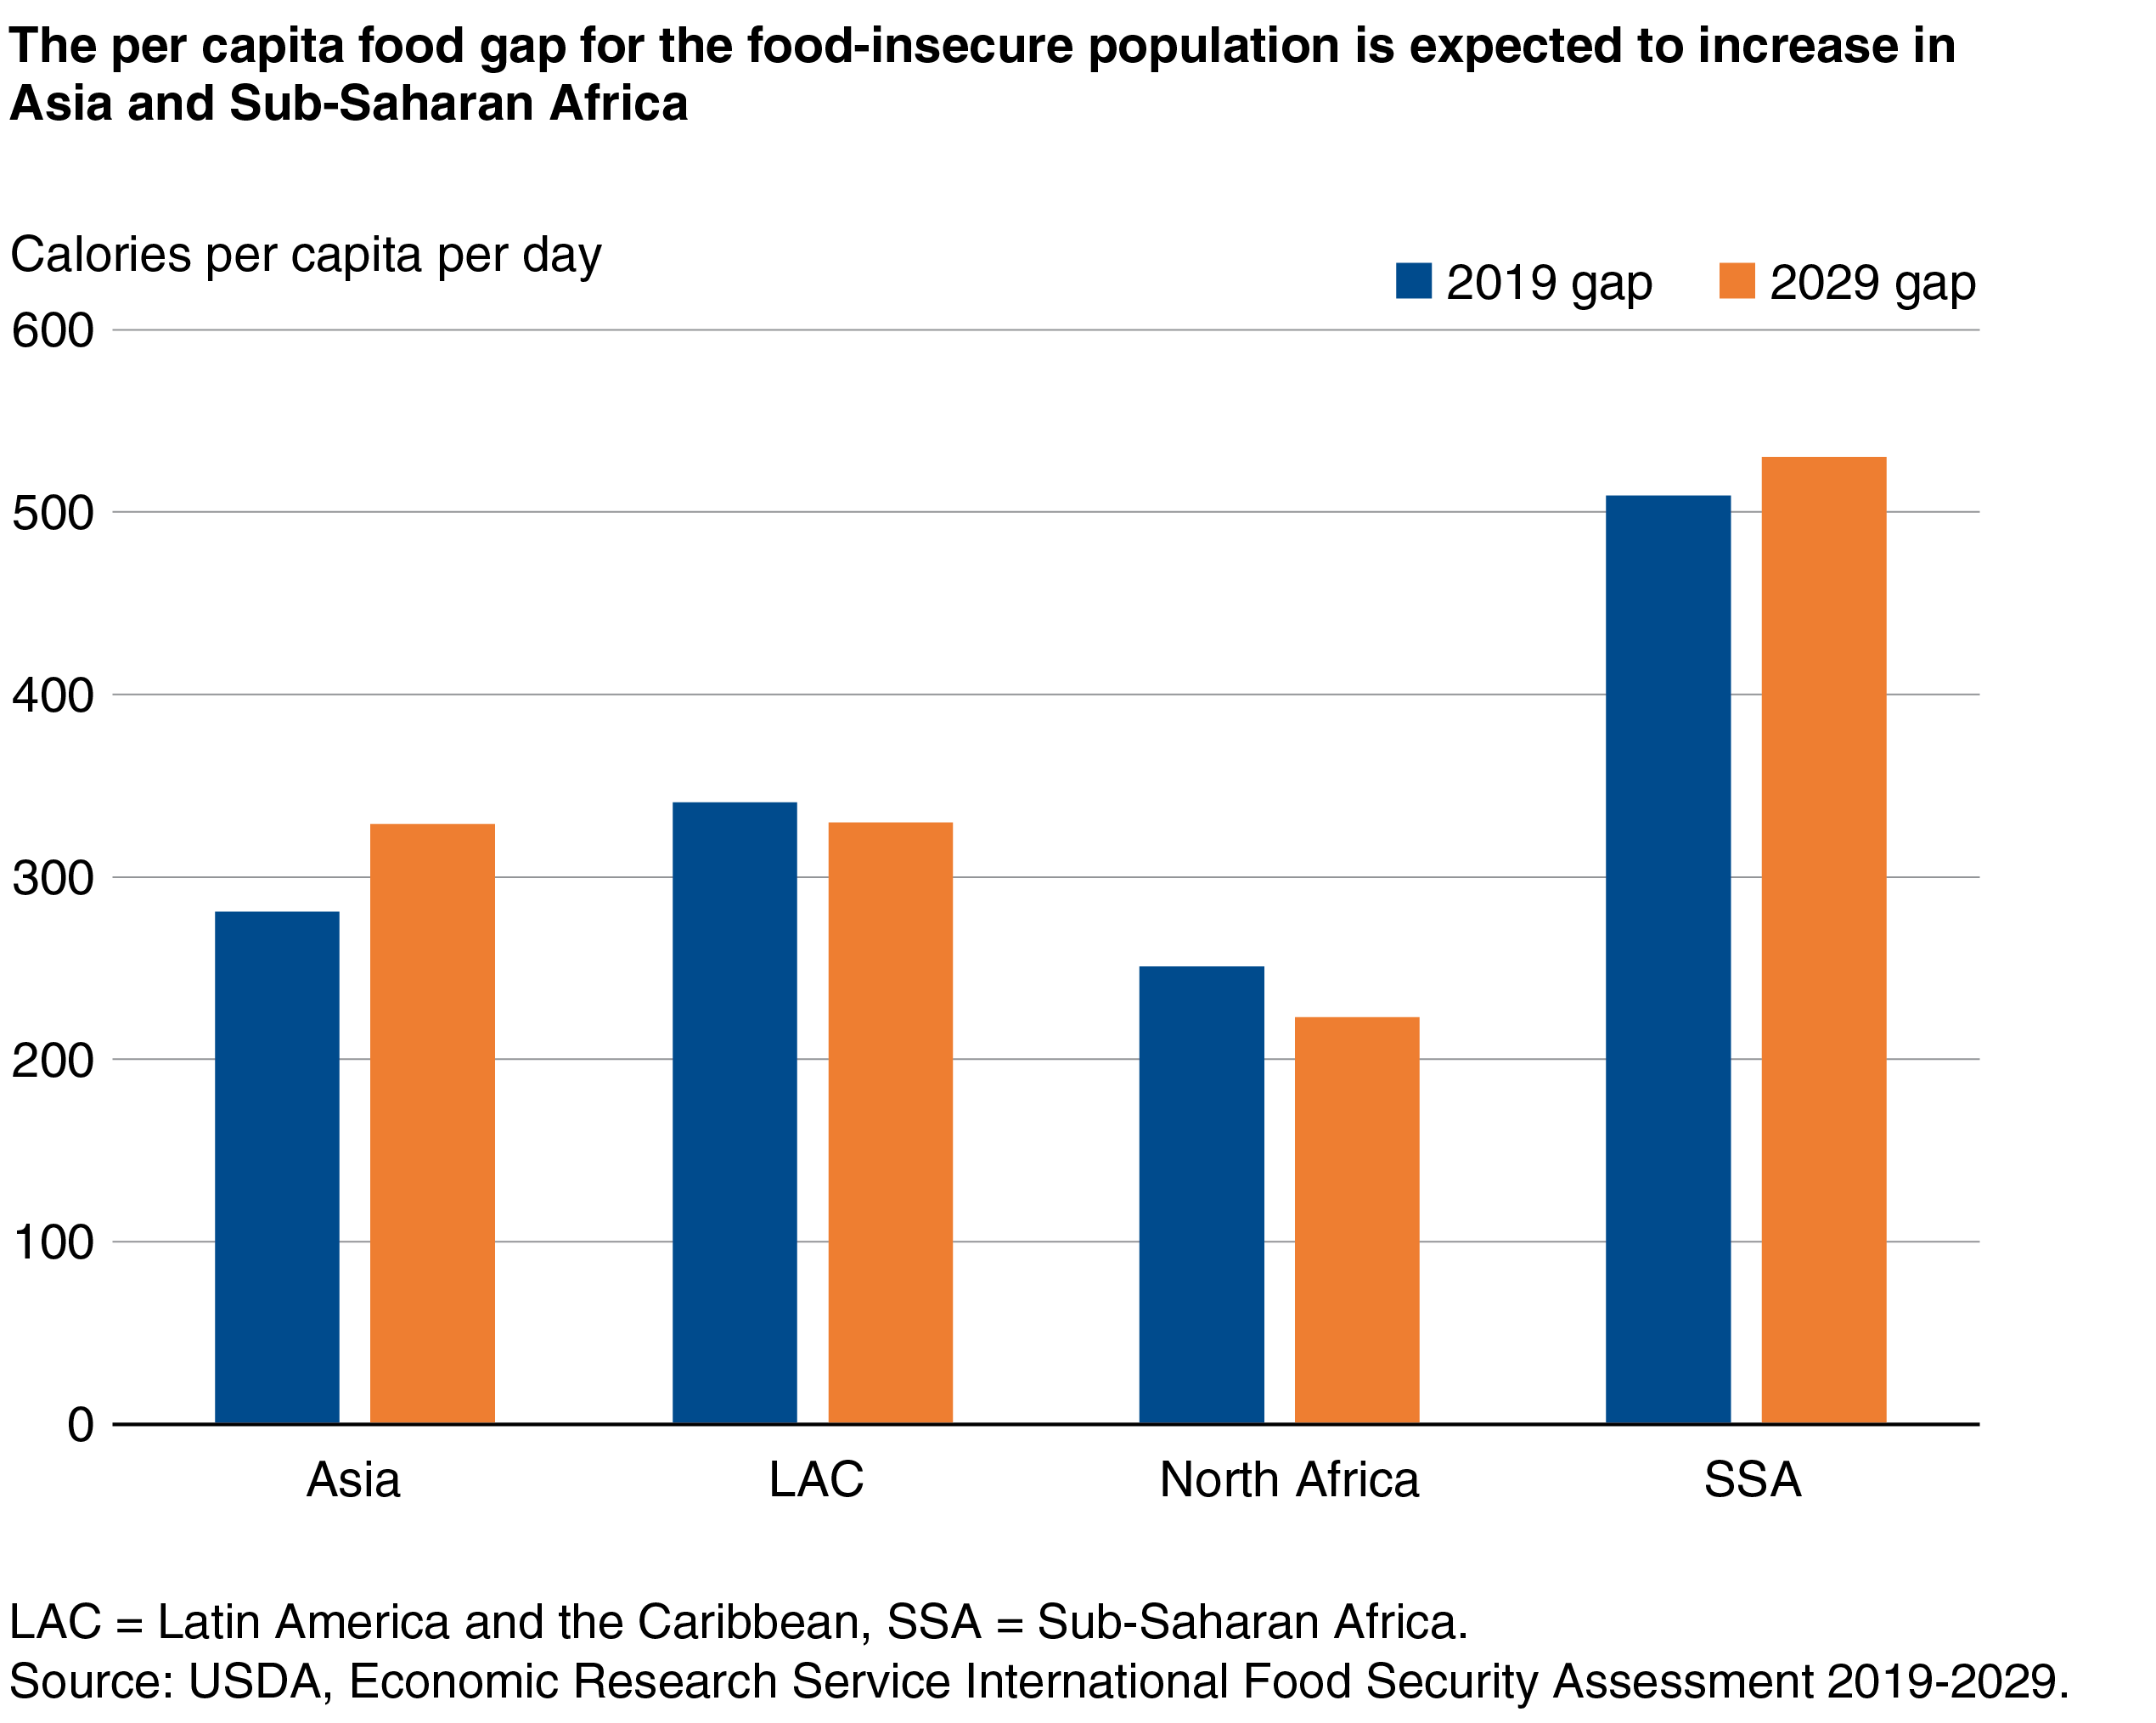
The food gap, defined as the amount of food needed for all food-insecure people to reach the caloric target, is an indicator of the intensity of food insecurity. It can be expressed in grain-equivalent quantities to measure the annual national food shortfall or in calories per capita per day or. For the 76 countries examined, despite growing populations, the total food gap is projected to decline in all regions of the world, from a total of 33.5 million tons in 2019 to 21.9 million tons in 2029. On a per capita basis (of the food-insecure population), the food gap is expected to increase in Asia and Sub-Saharan Africa and decrease in Latin America and the Caribbean and North Africa. The increase is driven by the fact that in these regions some countries with relatively small per capita food gaps will reach the nutritional target over the projection period, leaving just the countries with more severe shortfalls, and thus contributing to a higher average per capita food gap.
This article is drawn from:
- Thome, K., Smith, M.D., Daugherty, K., Rada, N., Christensen, C. & Meade, B. (2019). International Food Security Assessment, 2019-29. U.S. Department of Agriculture, Economic Research Service. GFA-30.


