Disabilities in the U.S. Farm Population
- by Cristina Miller
- 4/1/2019
Recent ERS research estimated that an average of about 19 percent of U.S. farmers (395,000 people) and 9 percent of U.S. farmworkers (134,000 people) had a disability at some point between 2008 and 2016. The U.S. Census Bureau’s American Community Survey included six questions related to health difficulty: vision (blindness or serious difficulty seeing), hearing (deafness or serious difficulty hearing), physical (serious difficulty walking or climbing stairs), cognitive (serious difficulty concentrating, remembering, or making decisions), self-care (difficulty dressing or bathing), and independent living (difficulty performing errands, such as visits to the doctor’s office or shopping). An individual was classified as disabled if he or she answered yes to at least one of the six health difficulty questions.
The research estimated the effects of demographic factors—such as age, education, gender, and marital status—on the likelihood that farmers and farmworkers might experience a disability. The probability of disability among both farmers and farmworkers increased with age. The probability of disability was lower for farmers and farmworkers who had higher education levels, were female (compared to male), or were married (compared to unmarried).
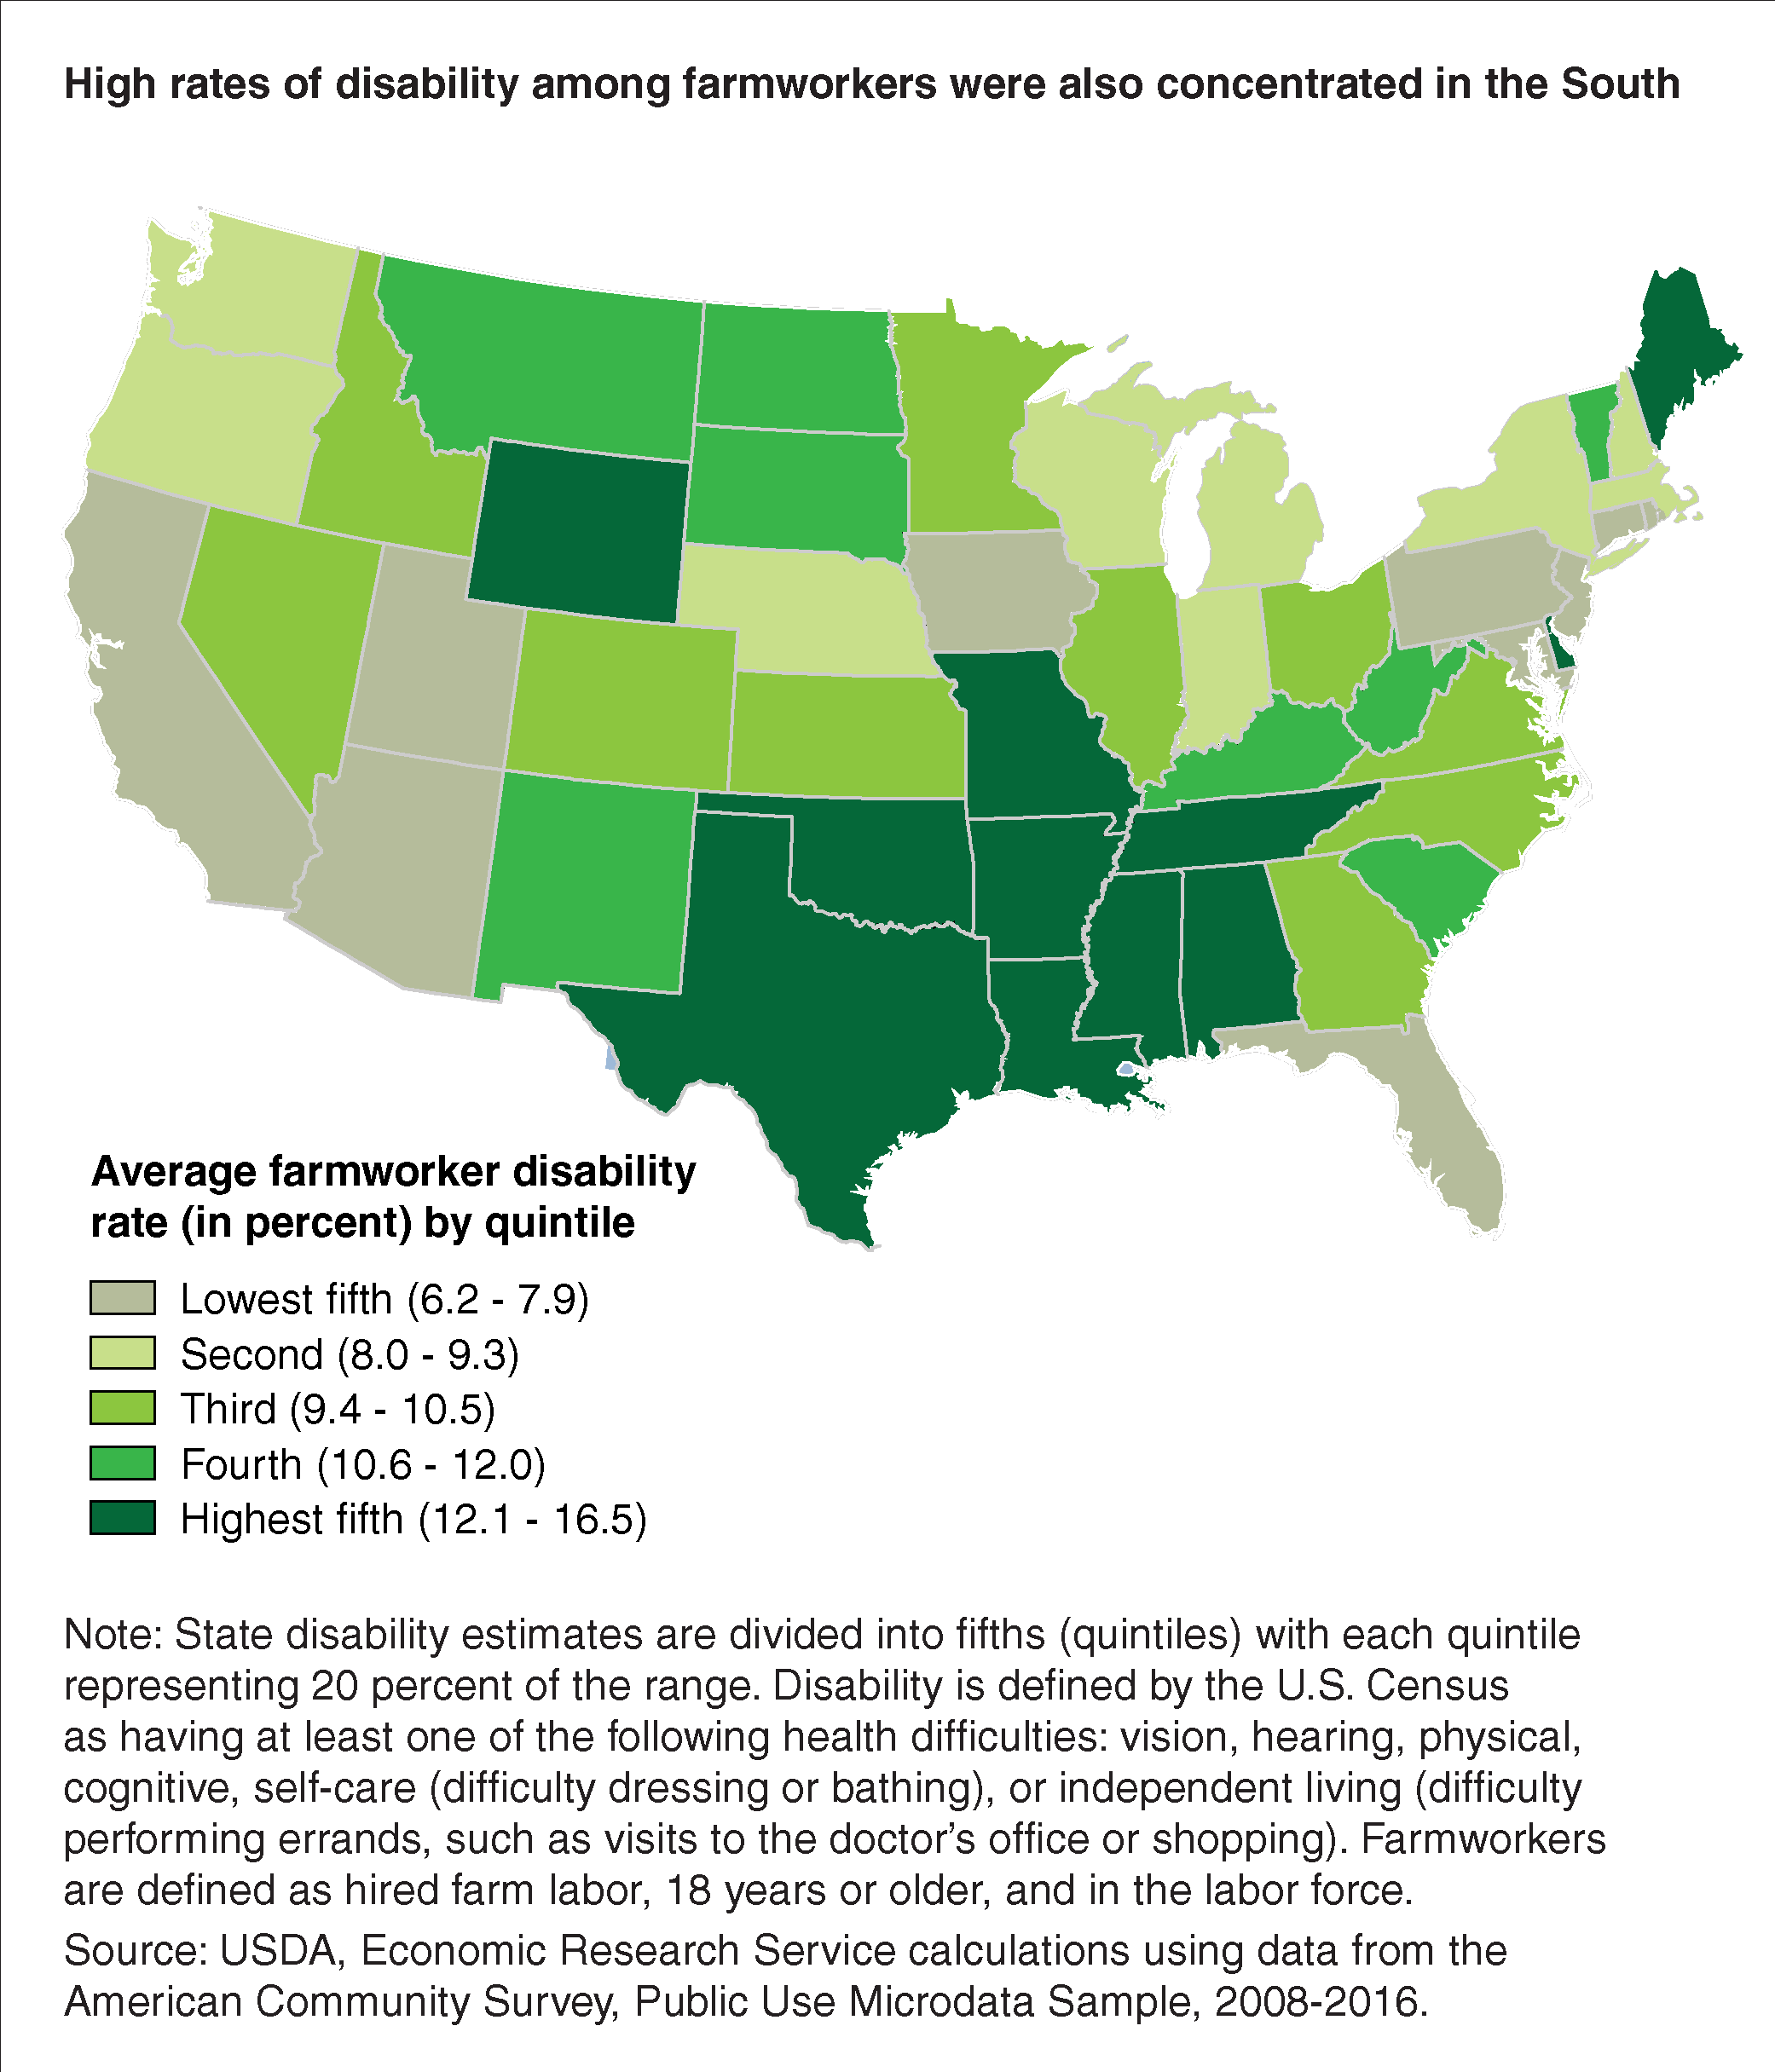
The most common health difficulties were physical (about 10 percent of farmers and 4 percent of farmworkers) and hearing (8 percent of farmers and 3 percent of farmworkers). Since farming varies by State or region in terms of crops planted, livestock raised, topography, and climate, ERS researchers looked at the average disability rates by State. Among both farmers and farmworkers, Appalachia and parts of the lower Mississippi River region had some of the highest disability rates.
Among farmers only, Wisconsin, Pennsylvania, and Iowa had the lowest disability rates on average (12 to 16 percent). On the other hand, Louisiana, Alabama, and Tennessee had the highest disability rates (23 to 27 percent).
Among farmworkers only, Pennsylvania and Iowa had the lowest rates of disability (6 to 8 percent). Louisiana, Alabama, and Tennessee had the highest rates of disability (12 to 17 percent).
In the context of this study, disability does not imply that someone is or would be declared disabled for any official purposes, such as for disability benefits. Furthermore, the definitions of “farmer” and “farmworker” are not necessarily reflective of official USDA definitions. Farmers were identified as individuals who reported working as a farm or ranch owner/operator or manager, had positive agricultural sales, and were age 18 years or older. Farmers included individuals in the labor force, looking for work, and not in the labor force. Farmworkers were individuals who reported working as hired farm labor, age 18 years or older, and in the labor force.
This article is drawn from:
- Miller, C. & Aherin, R. (2018). The Prevalence of Disabilities in the U.S. Farm Population. Journal of Agricultural Safety and Health. 24(4). https://doi.org/10.13031/jash.12934.


