Impacts of the Value-Added Producer Grant Program on Business Outcomes
- by Anil Rupasingha and John Pender
- 5/7/2018
Highlights
- Between 2001 and 2015, USDA provided 2,345 Value-Added Producer Grants (VAPGs), with a total value of $318 million, to farmers and ranchers to help them add greater value for agricultural commodities, such as through additional processing or marketing of new products.
- Businesses that received a VAPG between 2001 and 2013 were less likely to fail than similar nonrecipient businesses, and the effect persisted even 6 years after receiving grants.
- Between 2001 and 2013, businesses that received a VAPG and similar nonrecipient businesses had 14 employees on average at the time of grant award; the grants enabled VAPG recipients to employ 5 to 6 more workers than the nonrecipient businesses in the 5 years after grant receipt.
Access to readily available financial capital is a key to success for small businesses. USDA’s Rural Business-Cooperative Service (RBS) administers several grant and loan programs to support businesses in rural areas. The Value-Added Producer Grant (VAPG) program provides grants to help farmers and ranchers add greater value for agricultural commodities, such as through additional processing or marketing of new products. Some examples of adding greater value may include processing berries into jam, meat into sausage, wheat into flour, and corn into ethanol, as well as organic production. With these grants, the VAPG program aims to generate new products, initiate and expand marketing opportunities, increase producer earnings, create new jobs, and contribute to community economic development.
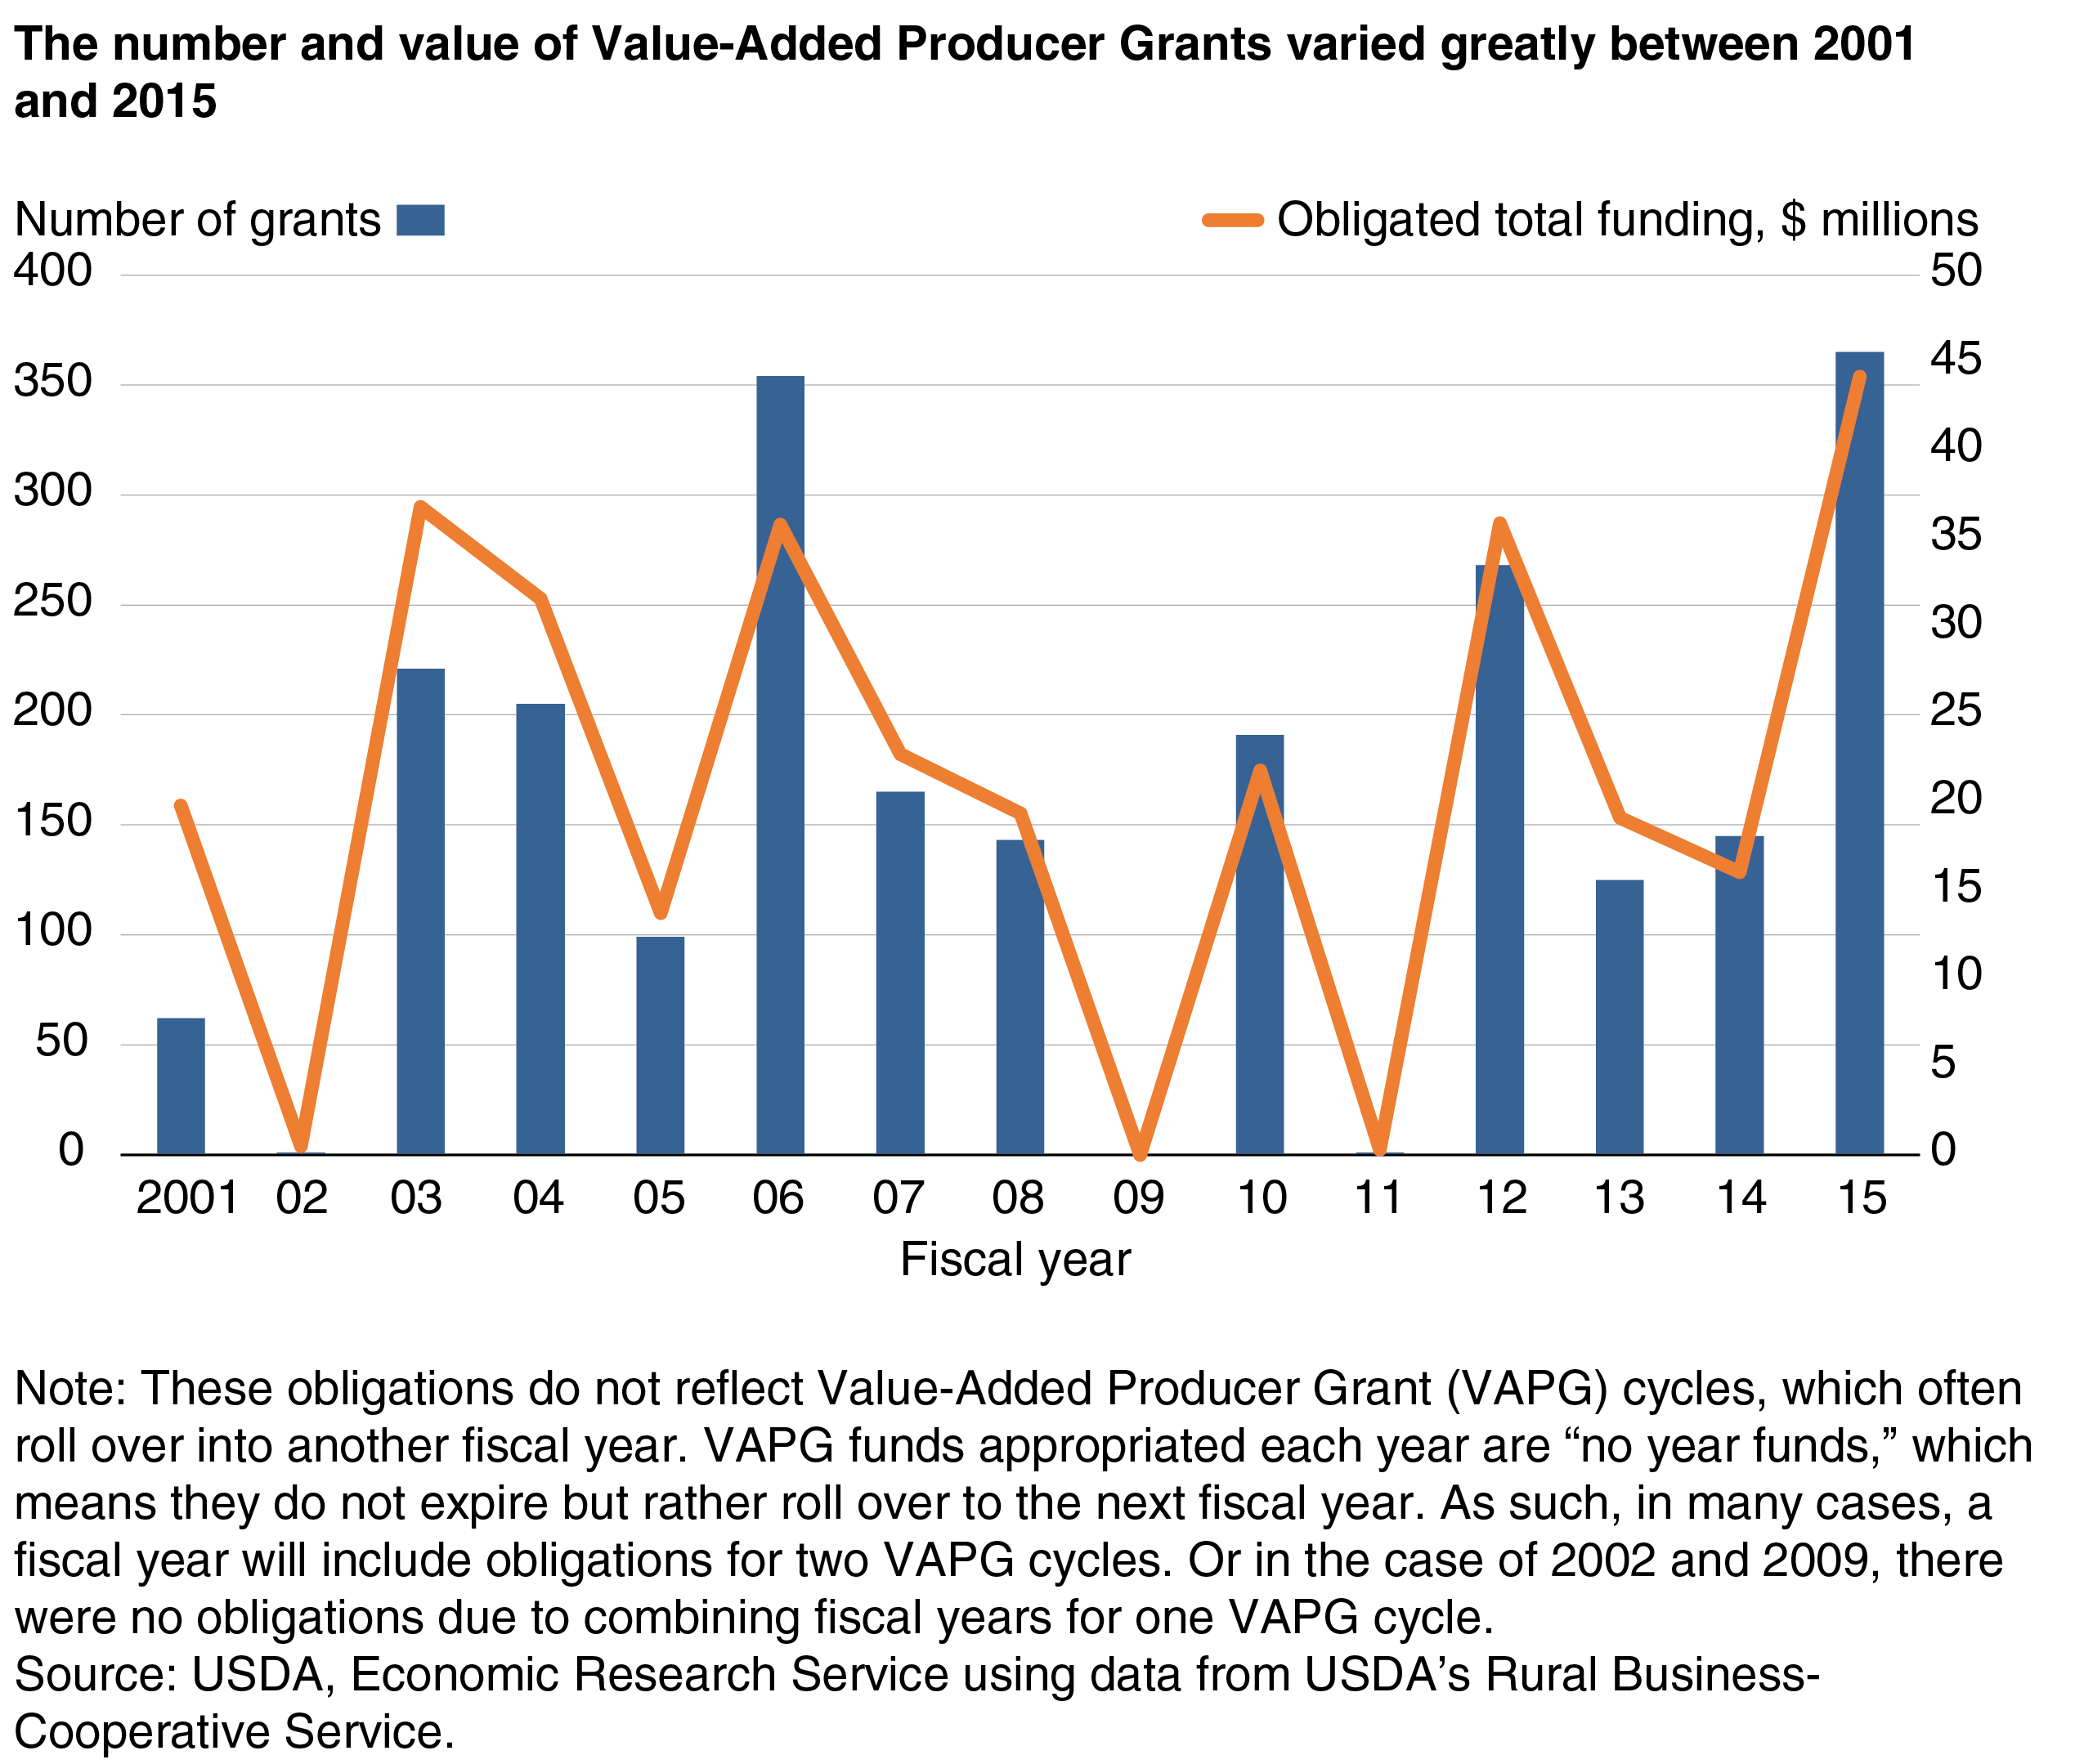
The number of grants and the amount of grant money obligated under the VAPG program have fluctuated substantially since the program began in 2001. Between 2001 and 2015, the program provided a total of 2,345 grants to farmers and ranchers—a total value of $318 million, or about $136,000 per grant on average.
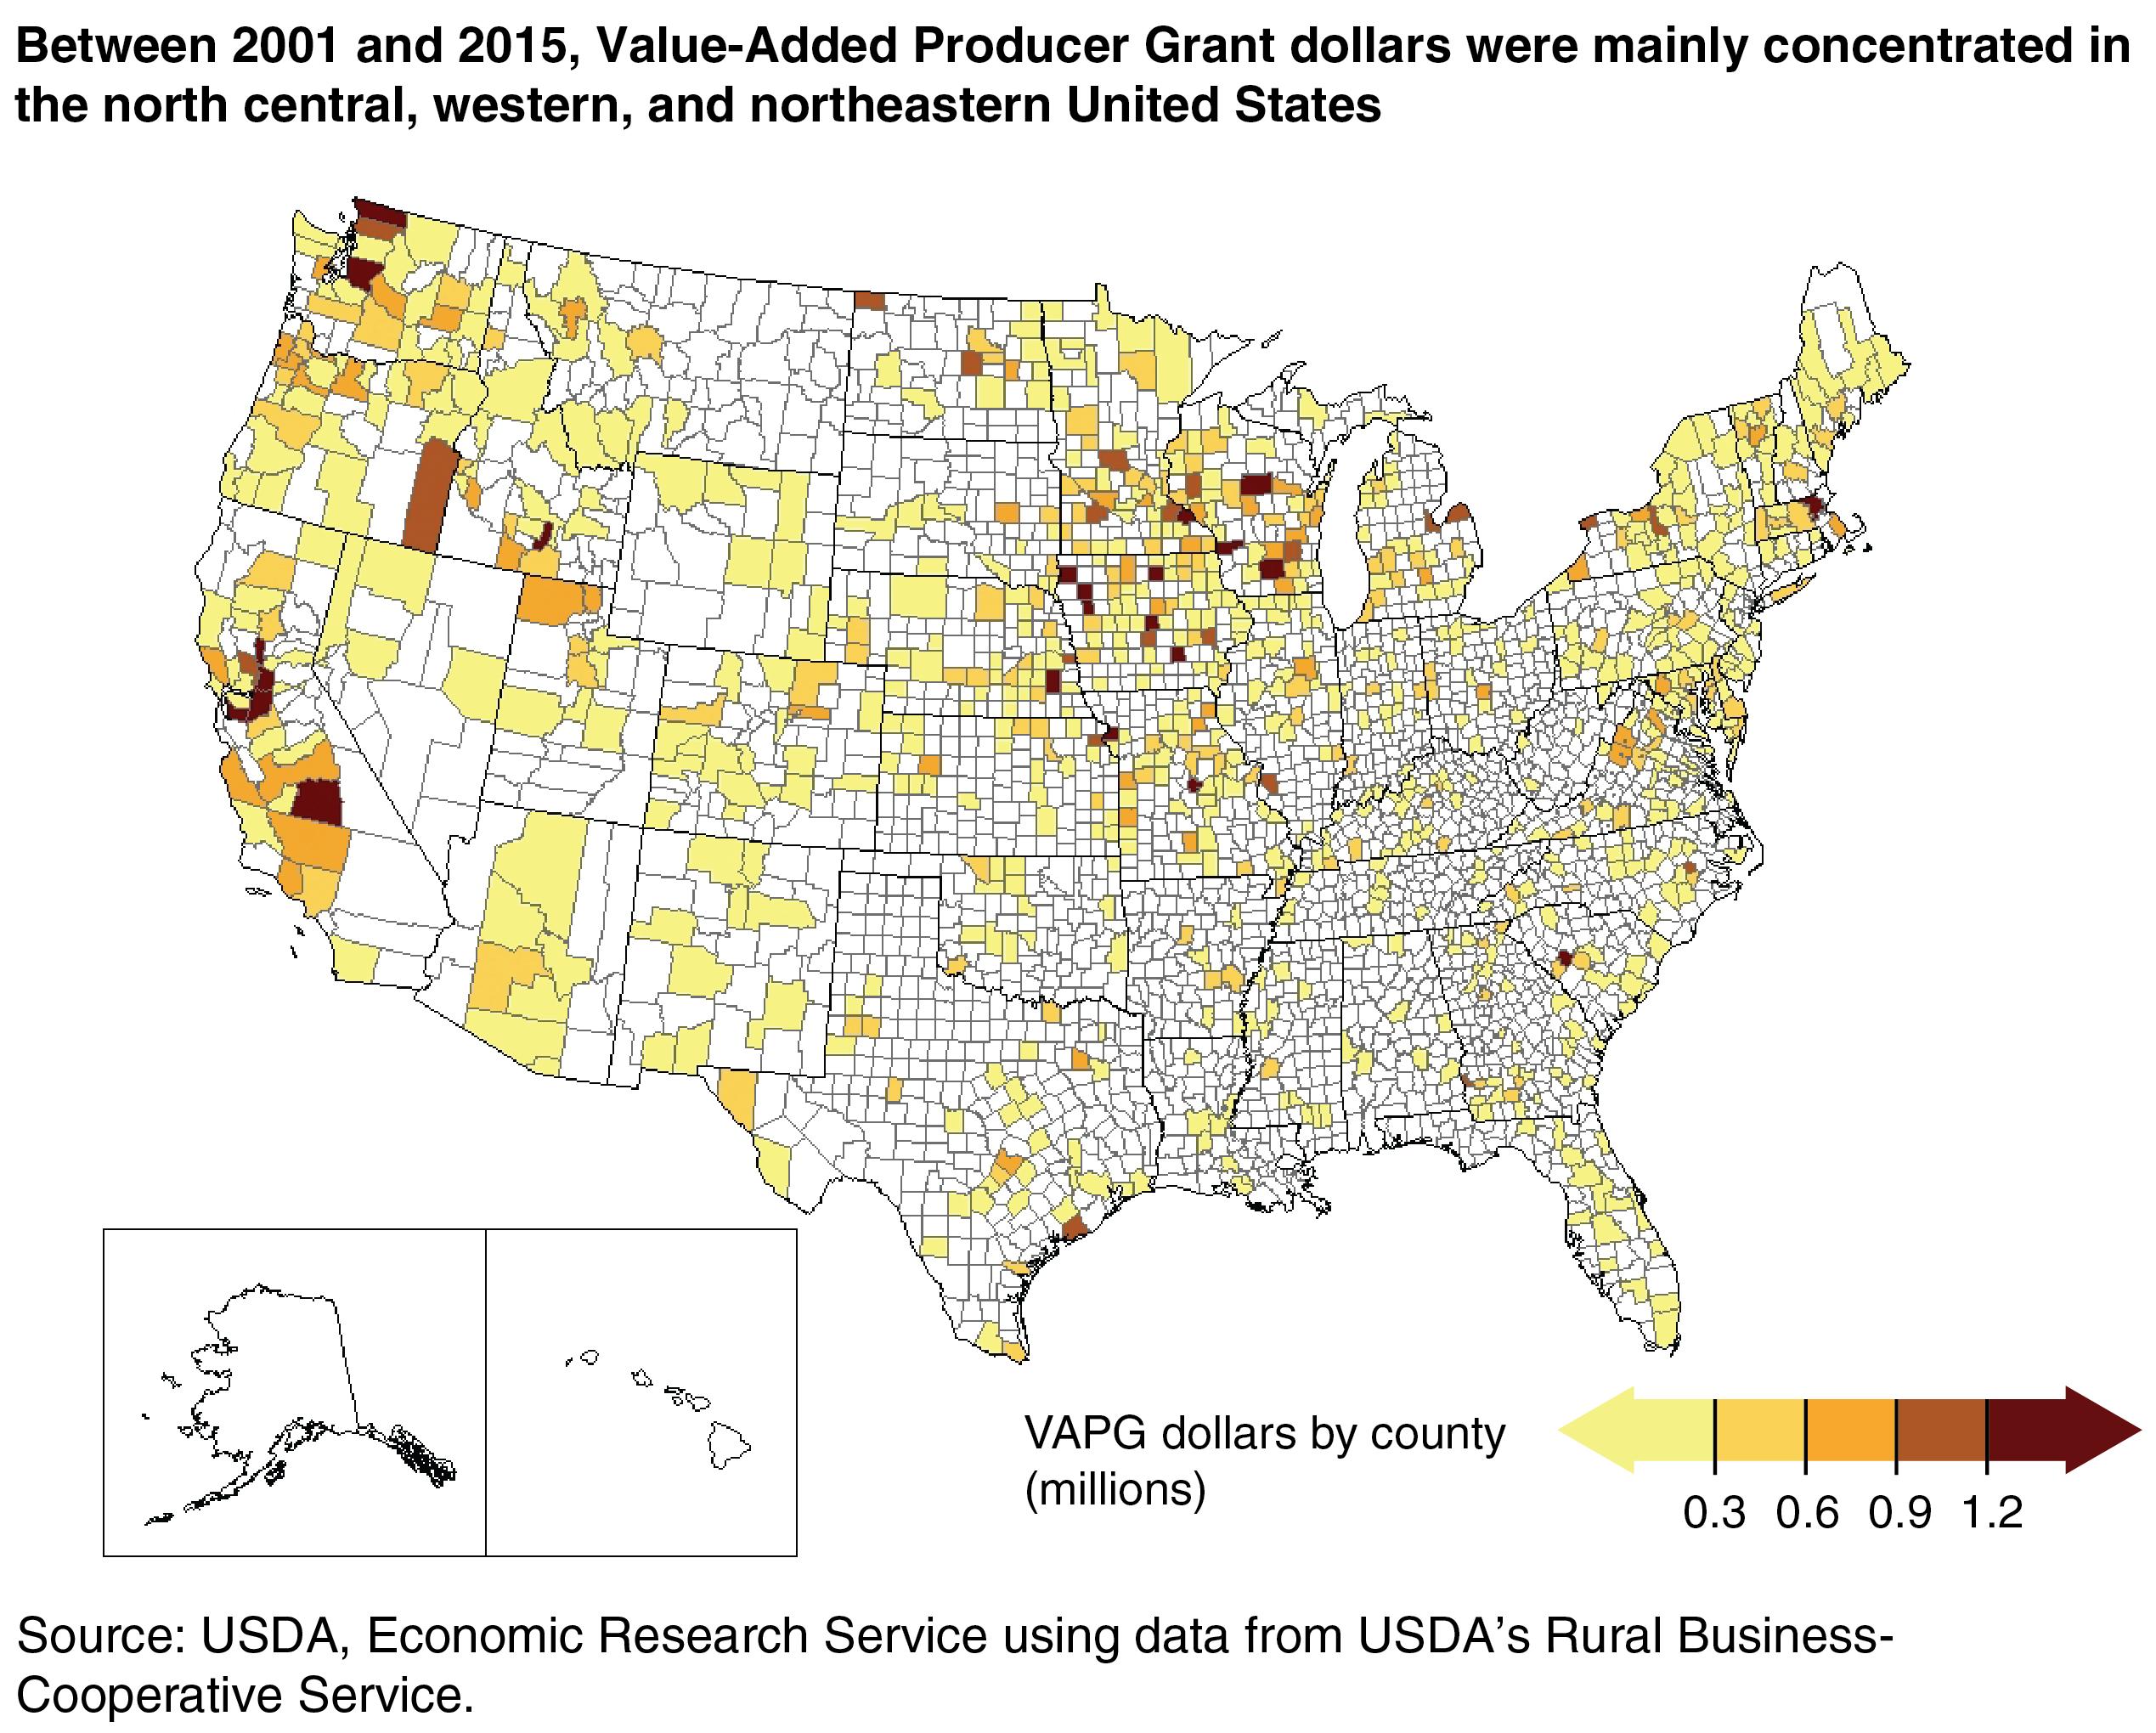
The map below displays county-level variation in the dollar amount distribution of VAPGs during 2001-15. These grants are concentrated mainly in the north central, western, and northeastern regions of the United States. The north-central States of Iowa, Wisconsin, Missouri, Nebraska, and Minnesota received a combined 28 percent of all grants from 2001 to 2015.
To understand the effects of the VAPG program on recipient businesses, ERS researchers conducted a study comparing the survival and employment growth of businesses that received VAPGs with the survival and growth of similar businesses that never received VAPGs (a comparison group). The study controlled for factors including location, industry, business age, and employment size—and considered the period from 2001 (beginning of the program) to 2013 (the latest establishment data available). Because business size in terms of the number of employees was needed to identify the comparison groups, the analysis excluded businesses with no employment history (i.e., startups). On average, VAPG recipient and nonrecipient businesses had about 14 employees and were about 7 years old at the time of receiving a VAPG.
Businesses That Received VAPGs Were Less Likely To Fail
ERS researchers estimated the effect of receiving a VAPG on the survival of businesses at different periods of time after receipt of the grant: 2 years, 4 years, and 6 years. VAPG recipients were 89 percent less likely to fail 2 years after receiving the grant than the group of similar nonrecipients. That is, the predicted likelihood of failure for VAPG recipient businesses 2 years after receiving a grant was about 0.23 businesses out of 1,000 VAPG recipient businesses, compared to a likelihood of failure of about 2.04 per 1,000 nonrecipients of the same age and other characteristics.
The effect of VAPG on survival rates dropped with time, suggesting that the grants are particularly beneficial while the recipients are getting the value-added activities off the ground. Over time, the influence of the VAPG may dissipate as other factors affecting business survival become more salient. Nevertheless, VAPG recipients were still 71 percent less likely to fail than similar nonrecipients 4 years after receiving a VAPG and 57 percent less likely to fail than nonrecipients after 6 years. For the 6-year period, this implies that 18.5 businesses out of 1,000 VAPG recipient businesses are likely to fail, compared with a likelihood of failure of about 42.3 per 1,000 nonrecipient businesses. These results show that the VAPG program had a positive impact on the survival of recipient businesses, even 6 years later.
VAPG Recipient Businesses Provided More Jobs
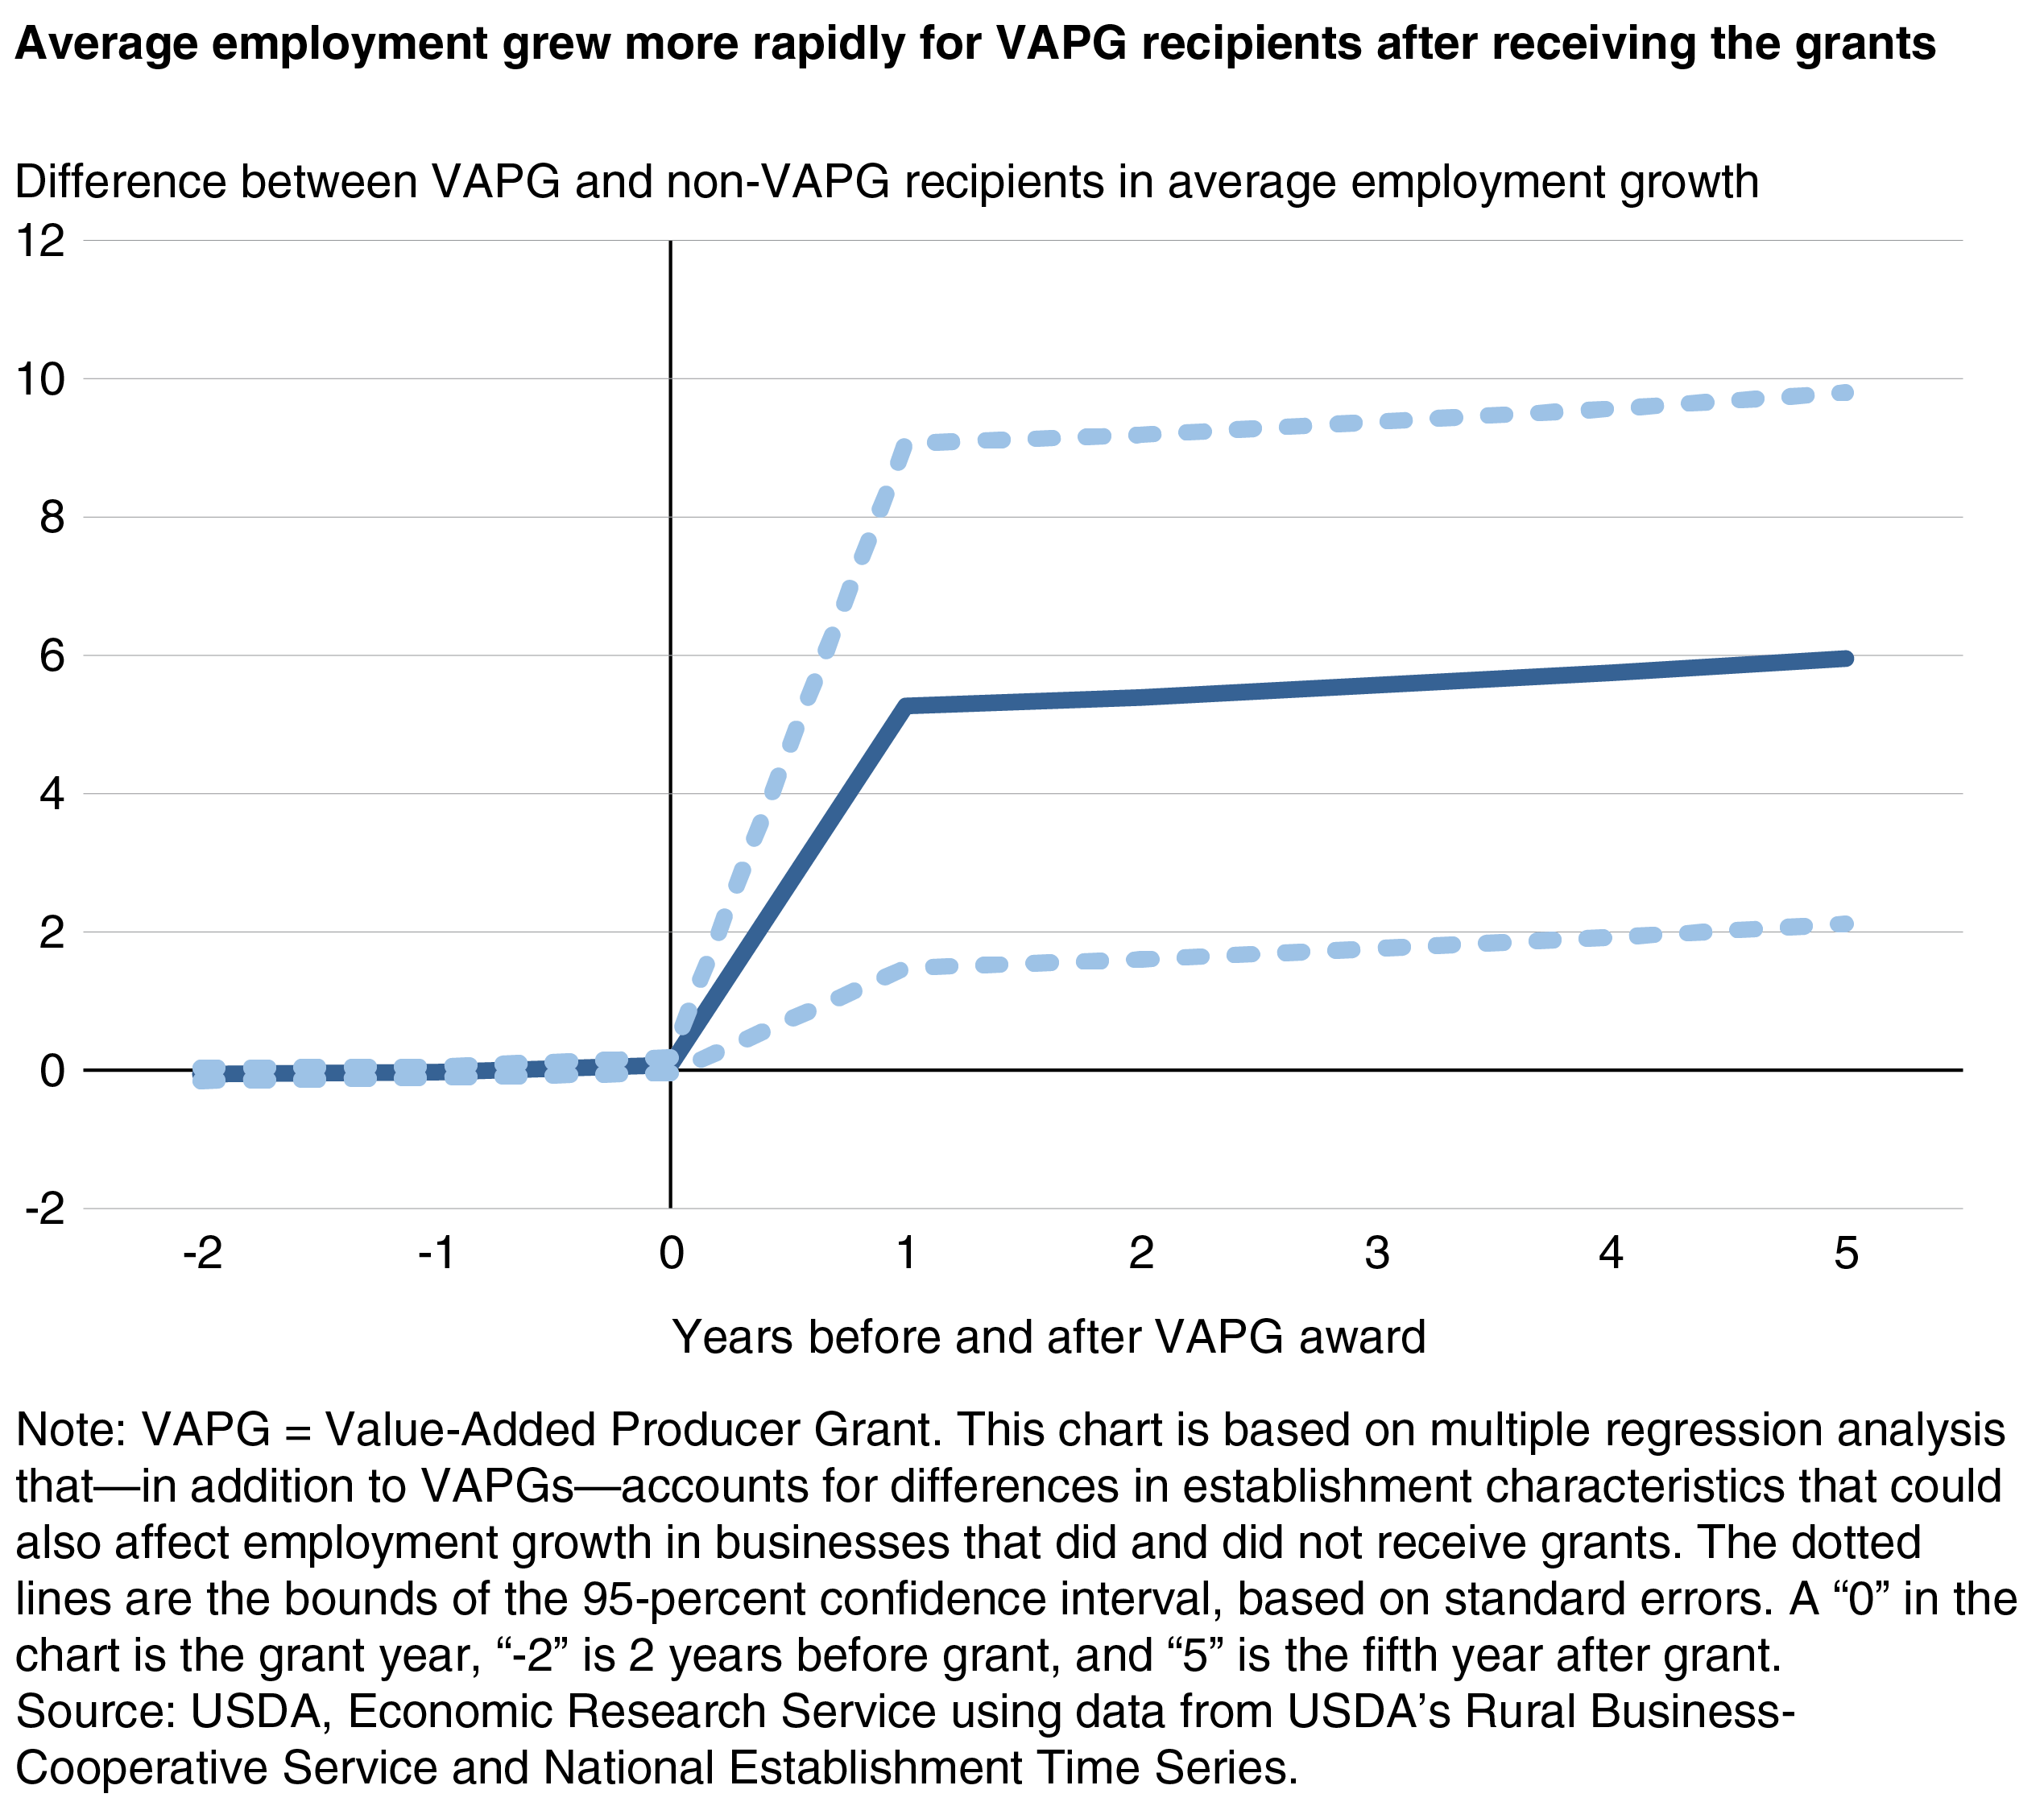
ERS researchers also investigated the effect of the VAPG program on job creation by comparing employment trends pre- and post-grant for VAPG recipients and similar nonrecipients. As the chart below shows, there is no significant difference in average employment levels between grant recipients and nonrecipients before the grants were received, as evidenced by the line being essentially flat at 0 until the grant. However, average employment grew more rapidly for VAPG recipients than nonrecipients after receipt of the VAPGs. The researchers found that grant recipients employed five to six more workers on average than nonrecipients 1 to 5 years after the grant was received. This job increase represents an increase of about 40 percent in average employment for recipient businesses.
Larger VAPGs Had Larger Impacts
In a separate analysis, ERS researchers examined the implications of the size of a grant, rather than simply whether an establishment received a grant or not. They found that the risk of failing decreased significantly with increasing grant size. For example, increasing the average size of a grant from the current amount of $136,000 to $236,000 (a $100,000 increase) for a business is associated with a 47-percent decrease in the likelihood of failure for a recipient business 2 years after the grant. The results also showed that larger grants had greater employment impacts: an increase of the average size of a grant by $100,000 increases employment on average by about four jobs for recipients over the 2- to 4-year periods considered after the grants.
Conclusion
Given that a $100,000 increase in VAPG funding increases employment by about four jobs and assuming that the cost of the program includes only VAPG grants, the cost of the VAPG program to the taxpayer is around $25,000 per job created. Although not grant programs, the cost of Federal guaranteed loan programs per job may provide some interesting comparisons. Based on a recent study of the impact of Small Business Administration (SBA) loans on employment growth, rough calculations of the cost to taxpayers per created job for SBA loans ranged from $21,580 to $25,450, similar to that estimated as cost per job for VAPG grants.
This article is drawn from:
- Rupasingha, A., Pender, J. & Wiggins, S. (2018). USDA’s Value-Added Producer Grant Program and Its Effect on Business Survival and Growth. U.S. Department of Agriculture, Economic Research Service. ERR-248.
You may also like:
- Low, S.A. (2017). Rural Manufacturing Resilience: Factors Associated With Plant Survival, 1996-2011. U.S. Department of Agriculture, Economic Research Service. ERR-230.
- “Access to Capital and Small Business Growth: Evidence From CRA Loans Data,” by Anil Rupasingha and Kyungsoon Wang. (2017). The Annals of Regional Science 59(1): 15-41.
- “Value‐Added Agricultural Enterprises and Local Economic Performance,” by Anil Rupasingha. (2009). Review of Agricultural Economics 31 (3): 511-34.


