Households Purchase More Produce and Low-Fat Dairy at Supermarkets, Supercenters, and Warehouse Club Stores
- by Annemarie Kuhns
- 5/1/2017
Over the past 20 years, some store formats—including supercenters, dollar stores, and warehouse club stores—have increased their share of Americans’ spending on “at-home food”—food and beverages purchased from retail stores, as opposed to away-from-home eateries. In 1994, conventional supermarkets accounted for 75.9 percent of at-home food sales, whereas supercenters and warehouse club stores, which both include a wide assortment of foods, accounted for 3 percent. By 2014, supermarkets’ share of at-home food sales had fallen to 64.9 percent, while supercenters’ and warehouse club stores’ share had risen to 16.5 percent.
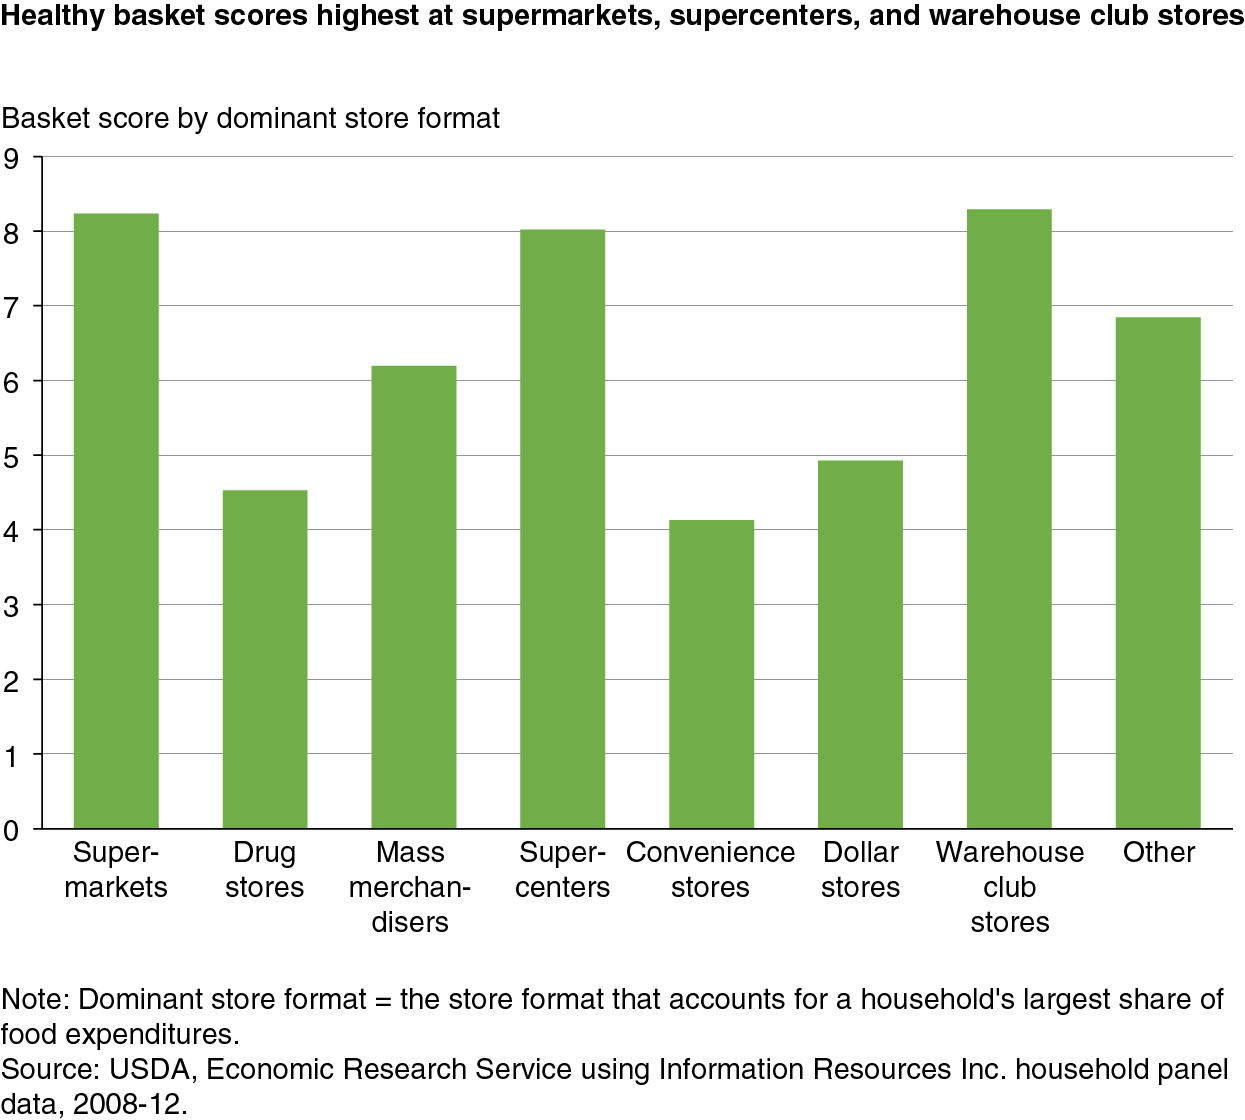
A recent ERS study used household purchase data to compute “healthy basket” scores for the foods and beverages purchased each month by a household. Scores were highest for warehouse club stores (8.3), supermarkets (8.2), and supercenters (8.0). Healthful foods recommended for increased consumption, such as dark green vegetables, whole fruits, and low-fat dairy products, were a larger share of total food purchases from these store formats than from other formats. Mass merchandisers—which sell primarily general merchandise and nonperishables but also carry a limited assortment of foods—followed, with a score of 6.2.
The higher the score, the closer the household’s purchases aligned with healthy-diet expenditure shares informed by the food categories and recommendations outlined in USDA’s Low-Cost, Moderate-Cost, and Liberal Food Plans, which represent a nutritious diet at three different cost levels. Monthly food shopping baskets were categorized by the dominant store format—the format accounting for the household’s largest share of food expenditures. Household food baskets dominated by purchases from drug stores, convenience stores, and dollar stores had the least healthful purchases. Drug stores, convenience stores, and dollar stores accounted for the largest shares of the least healthful foods, such as soft drinks and sugar, sweets, and candies, purchased by consumers. The average score for convenience store baskets was half that for warehouse club store baskets.
Over 2008-12, an average of 67 percent of households in the data predominantly shopped at supermarkets, 17 percent at supercenters, 6 percent at warehouse club stores, and 2 percent at mass merchandisers. The other 8 percent shopped predominately at smaller formats—drug, dollar, convenience, and other store formats. Households that regularly shop at multiple formats within a given month may skew overall scores for certain format types because all of their food purchases are assigned to the dominant store format. However, these households account for fewer than 25 percent of the households analyzed in the ERS study.
This article is drawn from:
- Clauson, A. & Elitzak, H. (2016, April 4). After a Sharp Rise Between 1990 and 2005, Supercenters’ Share of At-Home-Food Spending Has Leveled Off. Amber Waves, U.S. Department of Agriculture, Economic Research Service.
- Volpe, R. (2017). Store Formats and Patterns in Household Grocery Purchases. U.S. Department of Agriculture, Economic Research Service. EIB-167.


