U.S. Agricultural Productivity Growth: The Past, Challenges, and the Future
- by Sun Ling Wang, Paul Heisey, David Schimmelpfennig and Eldon Ball
- 9/8/2015
Highlights
- Since 1948, U.S. agricultural productivity has more than doubled, enabling farmers to feed more people with less land and labor.
- Agricultural output growth is attributed to the growth in total inputs used and in technology advancement, or total factor productivity (TFP). Between 1980 and 2011, total input use declined 15 percent. Agricultural output growth today is more dependent on TFP growth than in the past.
- We find no evidence of a long-run productivity slowdown in the U.S. farm sector. Scenario analysis shows that declines in public research and development (R&D) have a small, short-term effect on future agricultural productivity growth but a more pronounced longer term effect. Even if public R&D investment recovers, future TFP growth would take some time to resume due to the lag between research investment and application.
The U.S. population has more than doubled in the last six decades, as has agricultural output. U.S. agriculture now uses about 25 percent less farmland and 78 percent less labor than in 1948, so agricultural productivity is largely responsible for the increased production.
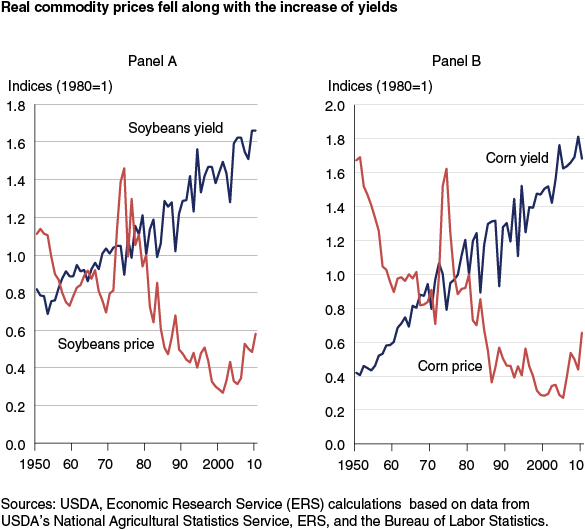
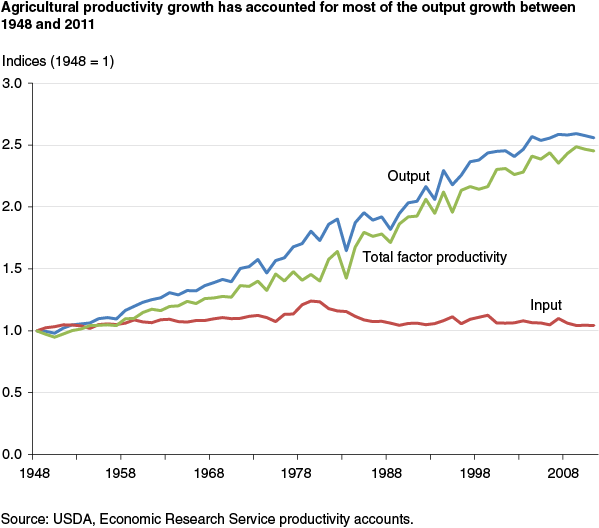
Agricultural productivity can be defined in terms of total output per unit of a single input—partial factor productivity (PFP) measures such as land productivity (yield) and labor productivity. It can also be defined as total output per unit of aggregate input—total factor productivity (TFP). No matter the measure, agricultural productivity growth has been strong over the last six decades. Between 1948 and 2011, soybean yields per acre doubled, corn yields grew more than fourfold, and labor productivity increased by nearly 16 times. TFP in 2011 was about 2.5 times as large as it was in 1948. With increased productivity, real (inflation-adjusted) prices of agricultural commodities have fallen over time. Lower prices benefit consumers, especially low-income households, who spend a greater portion of their income on food. Higher productivity also enables resources, such as land and labor, to be redeployed from the farm sector to other industries.
Partial factor productivity measures are useful in that the calculations are simple, the concept straightforward, and the findings meaningful to specific stakeholders. For example, yield is often used to analyze and communicate the impacts of drought or climate change, and labor productivity is usually used to address the overall economic performance of farm labor or potential living standard of farm workers.
While yield and labor productivity are useful measures, they are not appropriate measures of technical change. Increases in yield or labor productivity may reflect increases in other inputs, such as agricultural chemicals or capital, rather than technical improvement. Total factor productivity (TFP) is a better measure of overall long-term technical change for the entire farm sector, both crops and livestock, as it takes into account the contributions of all inputs.
Agricultural output growth derives from growth in agricultural inputs and in technology advancement (where the latter is measured as TFP growth) that enables farmers to produce more output with a certain amount of input use. Between 1948 and 2011, agricultural output growth averaged 1.49 percent per year. In contrast, aggregate agricultural input use grew just 0.07 percent per year. U.S. agricultural output growth, then, was due almost entirely to changes in TFP, which grew at 1.42 percent per year.
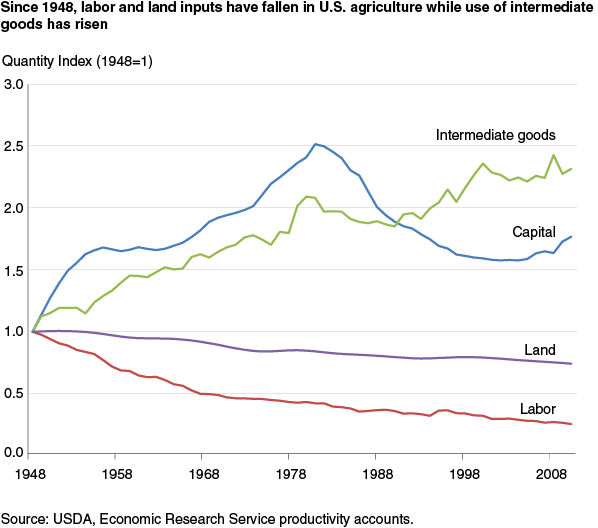
Although agricultural input use did not increase much over the last six decades, input composition has shifted significantly. Among the four major input categories—labor, capital, intermediate goods, and land—only capital and intermediate goods showed overall long-term growth, with average annual growth rates of 0.80 percent and 1.27 percent, respectively. During the same period, land input decreased at an average rate of 0.50 percent per year while labor use declined 2.41 percent per year. As a result, between 1948 and 2011, the cost of land as a share of the total cost of agricultural output dropped from 33 percent to 24 percent, while the total cost share of labor dropped from 24 percent to 13 percent. Over the same period, the cost share of capital increased from 4 percent to 8 percent and the cost share of intermediate goods increased from 40 percent to 56 percent. Farmers now use machinery and agricultural chemicals more intensively than in the past, largely in response to rising costs for labor and land. Increases in these other inputs are also part of the reason that land productivity and labor productivity have grown dramatically over the last six decades.
The role of productivity growth in agricultural output growth has become more important since 1981
Although the use of labor and land in agriculture declined between 1948 and 1980, aggregate input use increased at an average rate of 0.7 percent per year due to dramatic increases in intermediate goods and capital use. However, since 1981, intermediate input use has grown little and the use of capital input declined through the mid-2000s. Altogether, aggregate input in agriculture declined 0.5 percent per year between 1980 and 2011.
Farmers invested less in machinery and farm buildings in the 1980s and 1990s due to changes in the economic environment. Capital input in agriculture increased 2 percent per year between 1973 and 1979, partly to capitalize on rapid growth in export demand resulting from increased global liquidity, rising incomes, and production shortfalls in some countries. In addition, declining interest rates and rising inflation contributed to a lower opportunity cost of invested capital.
However, in the early 1980s, restrictive monetary policy by the Federal Reserve pushed up interest rates and the dollar appreciated on foreign exchange markets. The average real interest rate rose to nearly 16 percent in 1981-83 and remained high until the 2000s. This mix of fiscal stimulus and monetary restraint slowed the growth in U.S. agricultural exports and discouraged capital investment during this period. These developments on the input side made the role of TFP growth more critical to agricultural output growth in the last several decades.
Long-term drivers of TFP growth and challenges
Long-term TFP growth relies on innovation through research funded by both public and private sectors (public R&D and private R&D). Extension activities and some public infrastructure—such as roads—also contribute to longrun productivity by enhancing the dissemination of new technologies to farmers and reducing marketing costs. Public R&D investment in agriculture grew rapidly in real terms from 1948 until the early 1980s but has slowed since. Public R&D began to decline in 2009, and by 2012, real public research investment was nearly 6 percent lower than in 1982. On the other hand, private R&D investment has grown over the same period: from 1982 to 2010, private research on agricultural inputs grew by over one-third in real terms. While extension services can further productivity growth by disseminating new technology, full-time-equivalent staff (FTEs) of Cooperative Extension Service (funded by USDA, State, and local government) declined by more than 20 percent between 1980 and 2010.
Is U.S. agricultural productivity slowing?
Growth in crop yields slowed in the 1990s and, along with slowing growth in U.S. public agricultural research funding, raised concerns about the growth potential of U.S. agricultural productivity. While major crop yields rebounded in the 2000s, concerns over a productivity slowdown lingered, especially with real crop prices increasing after a long decline. The United States is one of the world’s biggest producers and consumers of agricultural commodities; a protracted slowdown in productivity growth would affect not only U.S. food markets but also global food security.
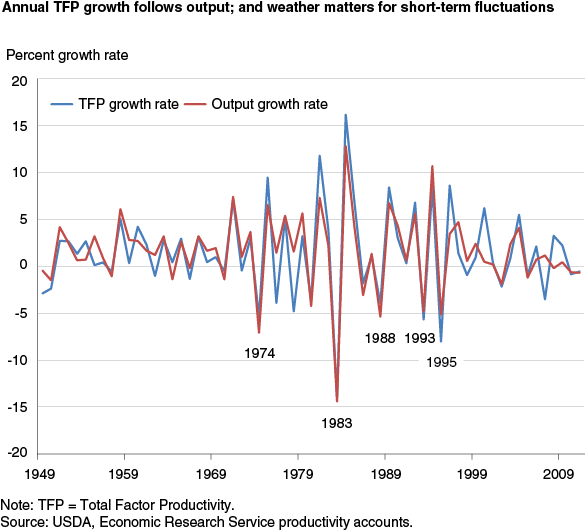
To evaluate the overall productivity slowdown for the entire U.S. farm sector, TFP seems a better indicator than crop yields since it takes all inputs into account. Since TFP is a residual that captures unexplained factors affecting output growth that are not accounted for by observed input growth, TFP moves concurrently with output growth in the short run as input growth is relatively stable. Therefore, TFP growth rates, like output, can fluctuate considerably from year to year, largely in response to weather and other transitory factors.
For example, in 1983, severe weather events and the Federal Payment-In-Kind (PIK) program (farmers were encouraged to reduce crop production in order to lower government-held commodity surpluses) caused output to drop by 14.4 percent. With only a minor reduction in input growth, TFP fell by 13.6 percent. When high temperatures affected much of the Nation in 1988, 1993 (also flooding in the Midwest), and 1995, agricultural output dropped 4.9 to 5.1 percent in those years and caused TFP to decrease by 4 to 8 percent.
Most of these transitory events cannot be predicted at planting, so TFP declines can indicate “wasted” inputs that do not produce an expected level of output. Thus, while some studies suggest that U.S. agricultural productivity has slowed by comparing average productivity growth rates between decades, this can be misleading because decades differ in the frequency and magnitude of extreme weather events and policy shocks.
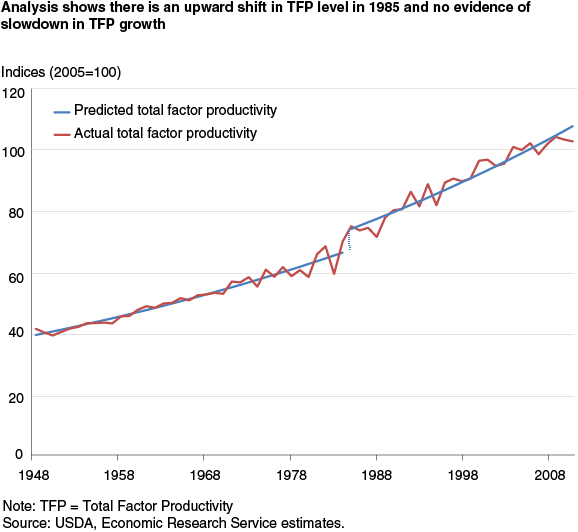
For this reason, ERS has examined the productivity slowdown using a statistical method that allows for identifying unknown structural breaks in either TFP level or TFP trend growth, based on historical TFP time series data. The econometric techniques allow for multiple structural breaks at unknown points in time and in various forms. Therefore, structural breaks are identified statistically rather than by decade or another arbitrary period. These tests indicate a significant upward shift in agricultural TFP in 1985 but find no statistical evidence of slowdown in trend growth during 1948-2011.
The upward shift in productivity in 1985 could be the result of several factors. U.S. economic activity recovered that year as energy prices retreated from record levels. Agricultural production also rebounded as the Food Security Act of 1985 ushered in a more market-oriented farm policy wherein commodity prices are now largely based on market supply and demand.
The future of TFP growth: public R&D scenarios and TFP projections
The major driver of longrun TFP growth is R&D. If public R&D has slowed, then why has there been no slowdown in U.S. agricultural productivity?
One possible explanation is that there is often a long lag between when a research investment is made and when the product of that research is applied to farm production and starts to boost productivity. Many studies show that it is the accumulation of past research investment (R&D stock), and not changes in contemporary research investment, that affects productivity growth. While U.S. agricultural productivity has seemingly not slowed to date, if real public R&D continues to stagnate and private R&D fails to compensate for the shortfall, then growth in U.S. TFP is likely to slow eventually.
Second, although there is a strong long-term link between public R&D and productivity growth, spillovers from basic biological science and the rapid growth in private sector R&D over this period may have compensated for stagnant public R&D spending. Encouraging private sector investment in productivity-related science may help foster continued advances in agricultural productivity. Still, public R&D has an irreplaceable role in developing fundamental science that does not have short-term reward and hence receives less attention from the private sector, but provides much of the foundation for longrun progress.
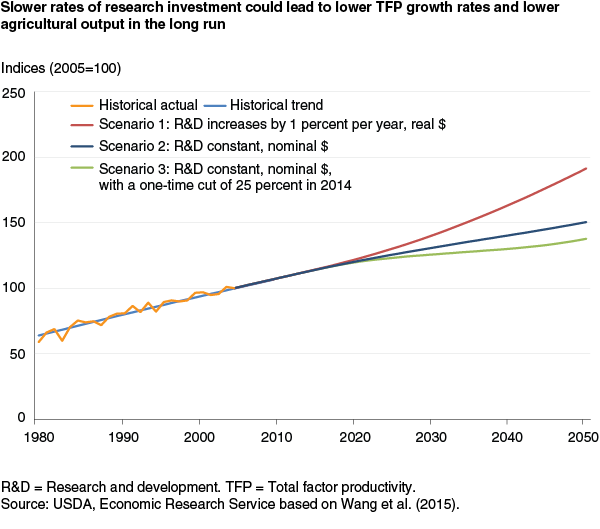
To show the likely impacts of public R&D funding choices on TFP growth, ERS projected future productivity growth with alternative public R&D investment scenarios, including a 1-percent increase in annual real (inflation-adjusted) public research funding (Scenario 1), constant annual public research funding in nominal dollars (Scenario 2), and a one-time 25-percent drop in public research funding followed by constant nominal funding at the lower level (Scenario 3). Because the costs of doing research increase over time, research budgets that remain the same in nominal terms produce less research. Thus, in Scenarios 2 and 3, real research investment declines over time. In light of potential across-the-board reductions in the Federal budget, Scenario 3 further posits a sharp drop in research spending in 2014, to test whether this would have a significant long-term impact on productivity growth, or whether the effect would dissipate over the next 40 years.
Although the estimates of average annual productivity growth between 2010 and 2050 differ considerably under these three scenarios, the impacts of scenario differences during the earlier years are small since it takes time for research investment to affect TFP growth. Thus, projected TFP increases by 13 percent, 12 percent, and 12 percent, respectively, under these three scenarios by 2020. However, between 2010 and 2050, TFP trends are very different, with longrun growth of about 80 percent, 40 percent, and 30 percent under scenarios 1, 2, and 3, respectively.
In general, ERS estimates that if R&D spending is raised by 1 percent each year in real terms, the annual rate of agricultural TFP growth will increase to 1.46 percent during 2010-50, compared with 1.42 percent during 1948-2011. This would enable the U.S. farm sector to keep pace with increasing domestic and global food demand with its current level of resource use. On the other hand, if public research funding is constant in nominal terms for the next few decades, TFP growth will slow.
This article is drawn from:
- Wang, S.L., Heisey, P., Schimmelpfennig, D. & Ball, E. (2015). Agricultural Productivity Growth in the United States: Measurement, Trends, and Drivers. U.S. Department of Agriculture, Economic Research Service. ERR-189.
You may also like:
- Agricultural Productivity in the United States. (n.d.). U.S. Department of Agriculture, Economic Research Service.


