U.S. Agricultural Trading Relationship With China Grows
- by Fred Gale
- 5/4/2015
Highlights
- China is now the top export market for U.S. agricultural products and is expected to continue growing.
- China has entered a period of transition that has slowed imports of some commodities and increased imports of others.
- Future U.S. agricultural exports to China will be influenced by changes in consumption patterns, farm policies, and enforcement of import standards and regulations.
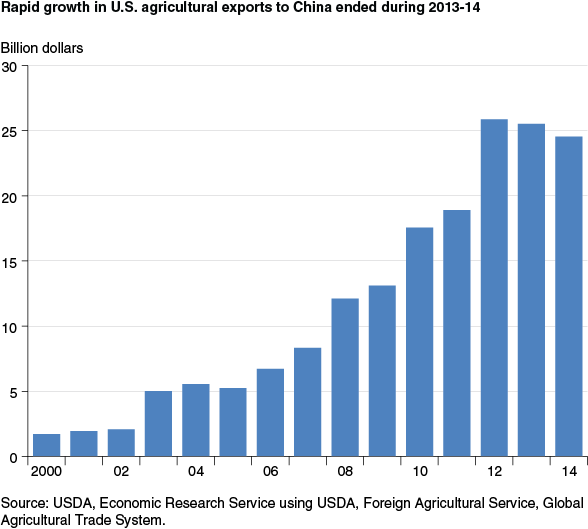
U.S. agricultural exports to China doubled from 2008 to 2012, growing to more than $25 billion in annual sales. China surpassed Japan, Mexico, and Canada to become the top export market for U.S. farm products. The share of U.S. agricultural exports destined for China rose from about 2-3 percent in the 1990s to 16-18 percent during 2012-14.
As a land-abundant country with highly productive farms, the United States is a natural trading partner for China, a country with limited per-capita supplies of cropland and water resources. A number of land-abundant countries export agricultural products to China, but the United States is the top supplier of China’s growing menu of agricultural imports, with a 24-percent share during 2012-13. The United States is China’s top supplier of imported soybeans, cotton, meat, cereal grains, cattle hides, distillers dried grains, and hay.
| Agricultural imports | Average Chinese import value ($ billion) |
U.S. share of China’s imports (percent) |
U.S. rank |
|---|---|---|---|
| All agricultural products | 109.0 | 24 | 1 |
| Soybeans and other oilseeds | 40.6 | 36 | 1 |
| Fats and oils | 11.9 | 2 | 11 |
| Cotton | 10.1 | 30 | 1 |
| Meat | 5.0 | 25 | 1 |
| Cereal grains | 4.9 | 42 | 1 |
| Dairy | 4.2 | 10 | 2 |
| Fruit and nuts | 3.9 | 13 | 4 |
| Wine and beverages | 3.1 | 3 | 7 |
| Cattle hides | 2.6 | 53 | 1 |
| Wool | 2.7 | <1 | 13 |
| Baking products | 2.3 | 4 | 13 |
| Vegetables | 2.5 | 2 | 5 |
| Sugar | 2.5 | 5 | 5 |
| Fish meal | 1.7 | 15 | 2 |
| Distillers’ dried grains | 1.1 | 99 | 1 |
| Tobacco | 1.4 | 11 | 3 |
| Live animals | .5 | 15 | 3 |
| Hay and forage products | .2 | 95 | 1 |
| Source: USDA, Economic Research Service analysis of China’s customs statistics. | |||
Soybeans, Grains, and Cotton Dominate China’s Agricultural Imports
Two decades ago, China was a net exporter of soybeans, but it now accounts for over 60 percent of global soybean imports. The United States supplies more than 40 percent of those soybeans in most years. The surge in Chinese soybean imports began after China cut tariffs and eliminated import quotas on soybeans.
After China joined the World Trade Organization (WTO) in 2001, it set tariff rate quotas on imports of cereal grains and focused domestic farm-support policies on production of wheat, rice, and corn. China increased grain output each year during 2004-14, an unprecedented string of increases that China’s Minister of Agriculture attributed to strong policy support. Nevertheless, China emerged as an importer of grains.
Other major exports to China—cotton and animal hides—supply raw materials for the manufacture of garments, shoes, handbags, and other industries that grew rapidly after China’s WTO accession. Growth in factory jobs helped absorb under-employed rural labor. Since then, China’s industrial base has expanded and the outflow of workers from rural areas has accelerated. Concerns about rural labor shortages have now supplanted concerns about rural underemployment.
In recent years, China’s menu of agricultural imports has broadened to include meat and dairy products. Its complementary consumer preferences have created a U.S. export market for byproducts like chicken feet and pork kidneys that have low value in the U.S. market. China now imports cheese and wine, products that were virtually unknown in the country during the 1990s.
China’s rapidly growing livestock sector has stimulated a growing demand for feed and forage. The country has emerged as the largest overseas buyer for distillers dried grains—the byproduct of corn ethanol production; it is also a major buyer of sorghum and alfalfa. Imported breeding animals and poultry are the foundation of a livestock sector that converts feed to meat more efficiently than in the past.
Agricultural trade with China is expected to grow further, but export growth stalled during 2013-14. China has entered a key period of transition in which economic growth is slowing at the same time Chinese leaders are pursuing numerous economic reforms, a period they describe as the “new normal.” During this period, consumption patterns and China’s approaches to policy and regulatory enforcement are undergoing changes that could influence the further development of the U.S.-China agricultural trading relationship.
Crackdown on Corruption Dampens Import Demand for Wine and Other Luxury Goods
Some patterns of demand in China are changing. One of the Chinese leadership’s most visible reform efforts is a crackdown on corruption and waste that began with a decree issued in December 2012 ordering government officials to reduce travel, banquets, and other expenditures viewed as excessive. The decree slowed business for restaurants and hotels and crimped demand for many food and beverage items. The effects of the decree combined with slower economic growth to reduce demand for many commodities.
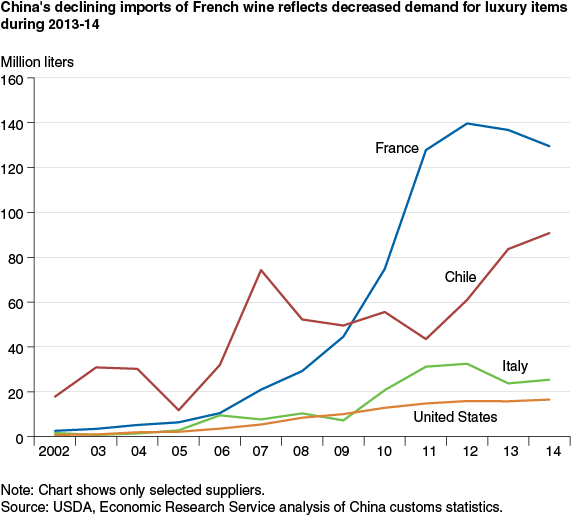
A recent structural shift in China’s wine imports illustrates these changes. During China’s years of rapid growth, demand for luxury items like liquor and wine was linked to banquets held by government officials and business leaders for potential customers and business associates. An ERS study found that China’s imports of French wine grew especially fast and gained a dominant share of the country’s wine imports during 2002-11, even though wines from France had relatively high prices. The authors interpreted this finding as a reflection of the reputation of French wine and a strong preference for European wines.
This pattern of imports reversed during 2013-14, as slower economic growth and the anticorruption campaign combined to stall growth in demand for premium wines and other luxury items. China’s wine imports fell 4 percent during 2013 after having doubled during 2009-12. Imports of French and Italian wine declined during 2013, while less expensive wine from Chile regained market share and imports of U.S. wine remained stable.
The slowdown in China’s wine imports is indicative of slower growth in demand for many commodities during 2013-14 due to the combined effects of slower economic growth and government crackdowns on luxury spending by officials. In his remarks at a meeting on priorities for economic policy in 2015, China’s President Xi Jinping emphasized that the anti-corruption campaign would continue. The apparent shift in composition of wine imports suggests that more price-conscious consumers are gaining importance as drivers of import demand, but it is unclear whether this will be a temporary or permanent change.
Price Support Policies Boost Imports Despite Slower Demand Growth
During 2013-14, even as overall demand growth slowed, China’s imports of some agricultural commodities accelerated. This paradox resulted from China’s large stockholding of commodities and the resolve of Chinese authorities to prevent domestic prices from falling as global prices declined.
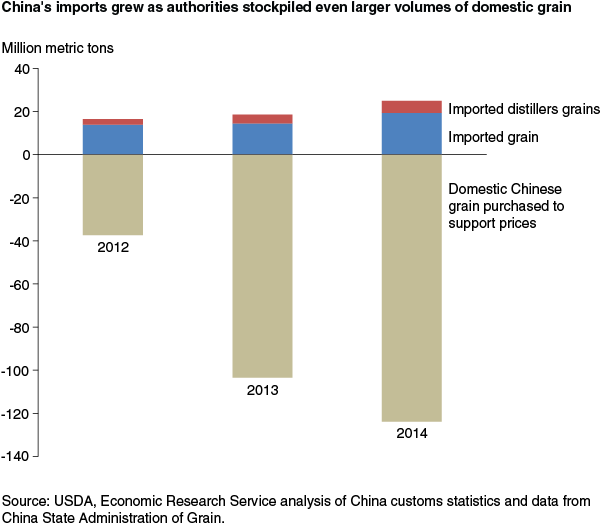
During 2014, China imported 19 million metric tons (mmt) of grain and 5.6 mmt of distillers dried grains. The imports suggested a grain deficit, but the country actually had a surplus. Chinese authorities reported purchasing 125 mmt of domestic grain—about 20 percent of that year’s harvest—to prevent prices from falling. In early 2015, Chinese officials said that reserves of corn, wheat, and rice exceeded 50 percent of annual consumption—a volume that far exceeded storage capacity—due to the large purchases to support prices.
The increase in imports of grain coincided with a sudden slowdown in China’s overall demand. Most of the grains imported during 2013 and 2014 were used for animal feed, but the output of China’s feed manufacturing industry actually fell during those years. The 2 years of decline were the first decrease in output since the industry was launched during the 1980s, and it followed a doubling of feed output during 2004-12.
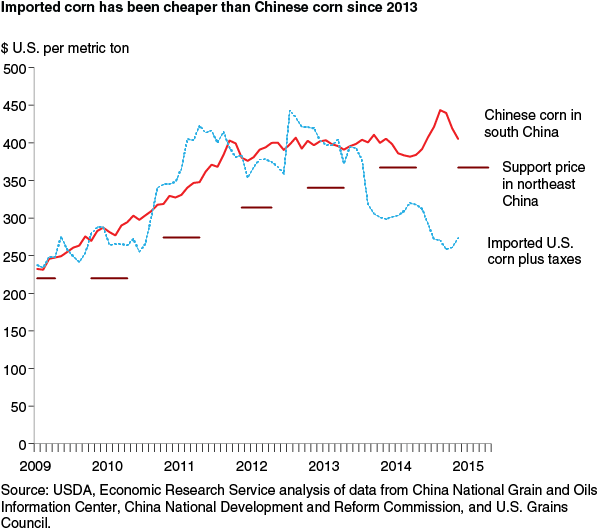
The distortion of market prices resulted from domestic support policies adopted during the decade after China joined the World Trade Organization. In 2004, Chinese leaders began to increase support for farmers by cutting taxes and giving direct subsidies to grain producers. Several years later, officials began to rely on price supports as a means of supporting farmers when subsidies did not offset the impact of rising production costs. From 2009 to 2013, officials raised support prices each year to protect farmers against losses in the event that crop prices dropped. There was little impact on foreign trade since U.S. grain prices were also high following a drought in major U.S. grain-producing regions during 2012.
U.S. grain and oilseed prices fell sharply in 2013 as both the United States and China had record corn harvests. Chinese officials, however, increased their support prices as usual that year. This action created a large gap between the prices of Chinese corn and imported corn. Feed mills had strong impetus to import cheaper corn from the global market, but imports were limited by a quota. Authorities further limited imports by rejecting most U.S. corn shipments in which they detected any trace of an unapproved genetically modified variety. With imported corn largely inaccessible, imports of sorghum and barley—also cheaper than domestic corn—soared to a combined 11 mmt during 2014.
Chinese and international prices diverged for many other commodities. During 2011-13, China accumulated a stockpile of cotton that exceeded annual consumption by 80 percent. Some commentators in China described the country’s soybean price support as a “subsidy for foreign soybean farmers” because it encouraged processors to import cheaper soybeans from the global market. China became the world’s leading rice importer while also stockpiling domestic rice.
Chinese authorities acknowledge that the price support programs distort markets, and they have pledged to replace them with more market-oriented support measures. During 2014, price-support programs for soybeans and cotton were abandoned, and a pilot “target price” deficiency payment program was launched in key production regions for those crops.
China’s effort to shrink its stockpiles is bringing increased uncertainty in world markets. For example, the cotton policy temporarily elevated global cotton demand and prices while China was stockpiling cotton during 2011-13. But demand and prices began falling during 2014 as China cut imports and began to reduce its stockpile. Officials in China hope to make a similar transition in support for corn, sugar, and rapeseed, which could reverse strong import demand for those commodities. However, officials say they will evaluate the results of the pilots for cotton and soybeans before making changes.
Meat and Dairy Exporters Face Stricter Requirements
Meat and dairy products are a growing segment of U.S.-China agricultural trade, but exporters are facing more stringent requirements. The uncertainty of Chinese demand may discourage many U.S. producers from making investments to access that market.
Chinese officials are overhauling food safety regulations and strengthening oversight for both domestic and imported products. Many exporters to China are now required to register with various government agencies, and China is starting to require U.S. regulatory agencies to certify that exporters meet Chinese laws and standards. China is also introducing demands for traceability, and it bans some feed additives that are permitted in the United States.
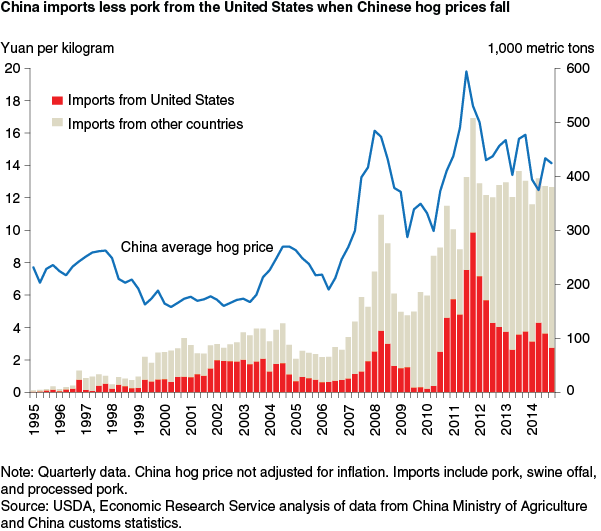
The United States is China’s leading supplier of imported pork. The Chinese pork market has long followed a cyclical pattern of rising and falling prices. Increases in pork prices tend to stimulate expansions of hog supplies that lead to declining prices. As prices decline, producers cut back on hog supplies, leading to another round of price increases.
Quarterly U.S. pork sales to China tend to fluctuate with the Chinese market cycle. China’s imports from the United States surged during periods of high prices in China, when China had tight supplies. Imports tend to fall when Chinese prices go down. The U.S. share of China’s pork imports was over 50 percent during periods of peak purchases and as low as 20-30 percent during 2014. This variation in part reflects market conditions, but restrictions on imports seem to increase during low points in the cycle; U.S. sales were banned during 2009-10 over purported disease concerns that coincided with a period of depressed prices in China.
U.S. pork sales to China plunged during 2014. That year, a disease epidemic limited U.S. supplies and boosted U.S. prices, but China’s pork market was also depressed. Like other industries, China’s pork industry was affected by slower demand growth during 2013-14, and high corn prices kept feed costs elevated. Chinese pork producers incurred losses throughout 2014 and cut production capacity.
One of the obstacles to another rebound in U.S. pork exports is China’s ban on ractopamine, a feed additive approved for use in the United States. Since 2007, Chinese inspection and quarantine authorities have rejected hundreds of U.S. pork shipments in which they detected ractopamine. The rejections were intermittent and did not correspond to the volume of trade, suggesting that inspections and testing varied in stringency.
China now requires that all U.S. pork imports be accompanied by a certificate stating that the product is free of ractopamine residues. In 2014, China began requiring that all pork exports be certified by USDA, either through a USDA ractopamine-free certification program or a screening program that includes mandatory residue tests. That year, Chinese inspectors once again reported finding traces of ractopamine in U.S. pork and de-listed a number of U.S. facilities that produced the rejected products. This appears to be a move toward stricter, more standardized screening for ractopamine in imported pork.
The volatility of Chinese demand may discourage many U.S. producers from making investments or altering production systems in order to sell to China. Raising hogs specifically for the Chinese market is not economical for most U.S. producers. U.S. pork exports to China consist mainly of low-value parts of hogs like internal organs and feet, while higher value cuts are sold primarily in the U.S. market.
China’s stricter enforcement of its ractopamine ban could constrain growth in U.S. pork exports to China. Since 2012, European competitors who do not use ractopamine have gained a larger share of China’s pork imports despite higher feed costs than U.S. producers and strict environmental and animal welfare regulations. Other competitors—Canada, Brazil, and Mexico—allow use of ractopamine. Producers may face a strategic choice of either dedicating facilities to ractopamine-free production in order to access markets in China and other countries that ban the additive or focusing on markets in North America, Japan, and other countries where ractopamine is permitted.
Future Trade Growth Subject to Uncertainty
The agricultural trading partnership between the United States and China is expected to grow further but predicting the future course is difficult. China is engaged in important economic reforms that could affect both demand and supply for agricultural commodities. Chinese leaders say the reforms are designed to strengthen the role of consumers as drivers of demand for commodities, reduce price distortions, and ensure that rules and regulations are applied uniformly. If the reforms lead to a more market-oriented Chinese economy, they could lay a foundation for a more stable U.S.-China trading relationship.
Uncertainty for exporters could be reduced if Chinese authorities standardize rules and sanitary standards and consistently apply inspection and testing protocols. Chinese officials have increased transparency by publishing draft laws and rules for comment, but many decision making and approval processes remain lengthy and opaque. Exporters to China face uncertainties like antidumping and countervailing duty actions and unclear practices for distributing import quotas to potential Chinese customers.
China’s future food security depends on developing a strong trading relationship with the United States. Sustained, reliable demand from China will encourage U.S. producers to make investments to supply that market, while unpredictable demand and murky trade rules will likely contribute to greater market volatility as China becomes a larger agricultural importer.
This article is drawn from:
- Gale, F., Hansen, J. & Jewison, M. (2015). China's Growing Demand for Agricultural Imports. U.S. Department of Agriculture, Economic Research Service. EIB-136.
- Gale, F. (2013). Growth and Evolution in China's Agricultural Support Policies. U.S. Department of Agriculture, Economic Research Service. ERR-153.
- Gale, F., Marti, D. & Hu, D. (2012). China's Volatile Pork Industry. U.S. Department of Agriculture, Economic Research Service. LDPM-21101.
- The Evolution of Foreign Wine Demand in China, by Andrew Muhammad, Amanda M. Leister, Lihong L. McPhail, and Wei Chen. (2013). Australian Journal of Agricultural and Resource Economics.


