Restricting Sugar-Sweetened Beverages From SNAP Purchases Not Likely To Lower Consumption
- by Jessica E. Todd and Michele Ver Ploeg
- 3/2/2015
Highlights
- To reduce consumption of sugar-sweetened beverages, some policymakers and nutrition advocates have argued that USDA's Supplemental Nutrition Assistance Program (SNAP) benefits should not be allowed to be used for sugar-sweetened beverage purchases.
- Between 73 and 83 percent of low-income adults consume sugar-sweetened beverages on any given day, according to national dietary intake data.
- SNAP participants are no more likely to consume sugar-sweetened beverages than otherwise similar low-income nonparticipants.
Americans now get an average of nearly 21 percent of their daily calories from beverages, up from 12 percent in 1965. Since calories from beverages may be less satiating than calories from food, consumers may not recognize how many calories they are consuming from beverages, potentially leading to higher total caloric intake. While some beverages—such as milk and 100-percent fruit and vegetable juices—provide important nutrients such as calcium and vitamin C, sugar-sweetened beverages (SSBs) provide few (if any) essential nutrients. As a result, some argue that SSBs have had a super-sized role in contributing to obesity in the United States.
To reduce obesity and improve health outcomes, many States and localities have attempted to limit SSB intake through taxes and other policies. For example, some States levy sales taxes on SSBs or taxes on SSB producers and distributors. Voters in Berkeley, CA, recently approved a 1-cent-per-ounce tax on sugar-sweetened sodas and energy drinks, and restrictions on the container size in which food service establishments can sell SSBs have been proposed in New York City.
Benefits for USDA’s Supplemental Nutrition Assistance Program (SNAP) are delivered to recipients through Electronic Benefit Transfer cards that can be used to purchase foods intended for home preparation and consumption at authorized retailers. (SNAP benefits cannot be used to purchase beer, wine, vitamins, and hot foods, or food that will be eaten in the stores.) Some policymakers and nutrition advocates have suggested that changes to SNAP, such as excluding SSBs from the set of allowable items that can be purchased using benefits, could directly address overconsumption of SSBs among low-income populations who receive program benefits.
Others have argued that such restrictions would have little impact on consumption patterns because SNAP benefits only cover a portion of the household’s total food spending for most SNAP participants. SNAP households could purchase SSBs using the remainder of their food budget. In addition, not all SSBs consumed by SNAP participants are obtained from grocery and other food stores. SNAP participants also use their own money to purchase food and beverages from restaurants, vending machines, or obtain food from family, friends, or community events.
At First Glance, SNAP Participants Appear To Consume More Sugar-Sweetened Beverages…
Underlying the argument to limit SNAP participants’ SSB purchases is the idea that SNAP participants consume more SSBs than nonparticipants, and that the SNAP benefit covers all of a household’s food spending so that any restrictions on purchases will have a direct effect on consumption in SNAP households. To investigate these assumptions, ERS researchers analyzed dietary intake data from the 2005-08 National Health and Nutrition Examination Survey (NHANES). Respondents were asked to report their food and beverage consumption on the day prior to the interview (the intake day). Focusing on adults age 20 and older in households with income at or below 250 percent of the Federal poverty line, researchers examined consumption of three categories of beverages: SSBs, alcoholic beverages, and other caloric beverages not sweetened with added sugars or corn syrups (nonflavored milk and 100-percent fruit and vegetable juices). SSBs included caloric beverages such as flavored milk, sweetened coffee drinks, sports drinks, and carbonated nondiet beverages. Water and diet (noncaloric) beverages were not included in this analysis.
The Dietary Guidelines for Americans recommend that alcoholic beverages and SSBs both be consumed in moderation by adults who choose to consume them. While alcohol and SSBs are different in terms of tax rates, controls on who can purchase them and where they can be sold, and health impacts, the differences in alcohol consumption between SNAP participants and nonparticipants may provide insight into how forbidding purchases of SSBs with SNAP benefits could affect consumption among SNAP participants.
Because SNAP benefits cannot be used to purchase alcohol, one might expect SNAP participants to have lower intake than otherwise similar nonparticipants. However, if SNAP participants consume the same amount of alcohol, it would suggest that restrictions on alcohol purchases with SNAP are not the limiting factor affecting consumption. If SSBs joined beer and wine in the list of grocery store items that cannot be purchased with SNAP benefits, SNAP participants could use their non-SNAP resources to purchase SSBs, just like they do for alcoholic beverages.
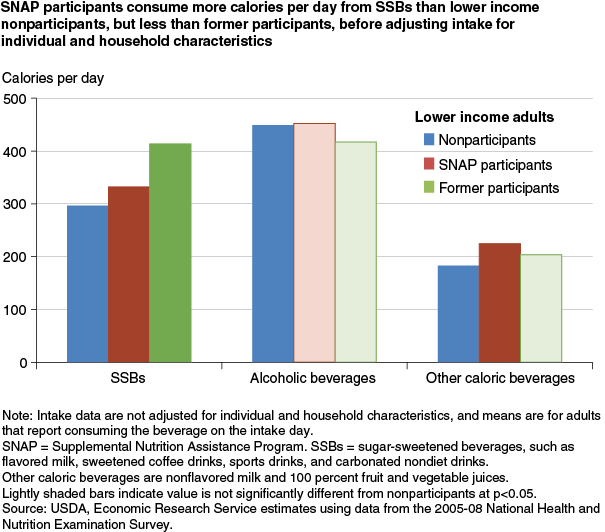
Lower income NHANES respondents were divided into three groups based on their participation in SNAP. Individuals in households that had received SNAP benefits within the past 30 days were classified as SNAP participants. Those in households that received SNAP benefits within the past 12 months, but not within the past 30 days, were classified as former participants, while all other lower income adults were classified as nonparticipants. Before accounting for differences in individual and household characteristics, researchers found that current SNAP participants were more likely to consume SSBs on the intake day, with 83 percent of SNAP participants and only 73 percent of nonparticipants reporting consuming SSBs. Among these SSB consumers, SNAP participants also consumed more calories from SSBs (332) than did nonparticipants (296). However, former participants consumed the most calories from SSBs per day when consuming SSBs—414 calories per day.
In terms of the other beverages, the share of SNAP participants that consumed alcoholic beverages was similar to the share of nonparticipants that consumed alcoholic beverages. In addition, the average number of calories from alcoholic beverages on the intake day among alcohol consumers was not different across the three groups. Researchers also observed that SNAP participants were less likely than nonparticipants to consume milk and 100-percent fruit and vegetable juices, but among milk and juice consumers, SNAP participants consumed slightly more calories from these beverages than did nonparticipants.
| Participant type | SSBs | Alcoholic beverages | Other caloric beverages |
|---|---|---|---|
| Percent of lower income adults consuming beverage type on intake day | |||
| SNAP participants | 83 | 18 | 55 |
| Former SNAP participants | 80 | 24 | 57 |
| Nonparticipants | 73 | 20 | 66 |
| SNAP = Supplemental Nutrition Assistance Program. SSBs = sugar-sweetened beverages, such as flavored milk, sweetened coffee drinks, sports drinks, and carbonated nondiet drinks. Other caloric beverages are nonflavored milk and 100 percent fruit and vegetable juices. Bold indicates a significant difference from nonparticipants at p<0.05. Source: USDA, Economic Research Service estimates using data from the 2005-08 National Health and Nutrition Examination Survey. |
|||
… But Not After Accounting for Differences in Individual and Household Characteristics
Simply comparing average beverage intake across different SNAP participant and nonparticipant groups does not address the question of whether SNAP influences purchases and if restrictions on SNAP purchases will have any impact on individual intakes. Differences in the characteristics among the three lower income groups may explain differences in SSB and other beverage consumption.
Among these three groups of lower income adults, the nonparticipant group was older and more likely to be male, non-Hispanic White, married, and to have at least some college education than current SNAP participants. Nonparticipant adults had a higher average body mass index (BMI) and were more likely than SNAP participants to be overweight (BMI between 25 and 29.9) but less likely to be obese (BMI of 30 or higher). Nonparticipant adults lived in smaller households with higher incomes and were less likely to have children under age 18 in the household. Many of these demographic characteristics influence food and beverage consumption.
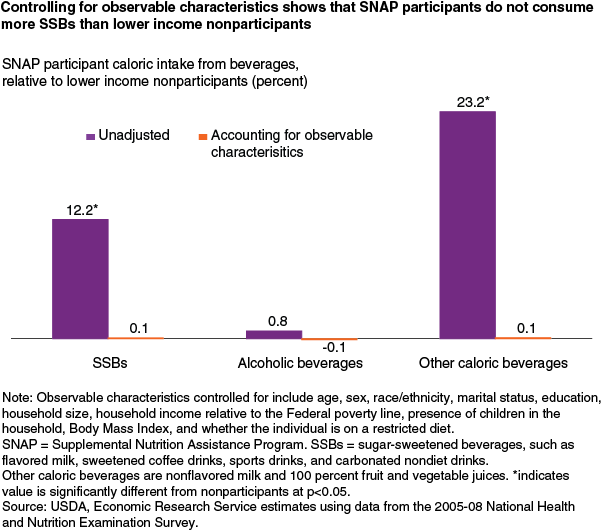
Economic modeling was used to estimate the differences in beverage consumption while adjusting for these observable demographic differences. Estimates show that many individual and household characteristics influence beverage consumption. Specifically, men consumed more calories from SSBs and from alcohol than women, while college graduates consumed fewer calories from SSBs and from alcohol than those without a college degree. Those who identified themselves as Hispanic or as a race other than non-Hispanic Black or non-Hispanic White consumed fewer calories from SSBs and alcohol than did non-Hispanic Whites. Older individuals consumed fewer calories of each beverage.
After accounting for these observable characteristics, SNAP participants are no more likely to consume SSBs than lower income nonparticipants. These findings are consistent with other ERS research on overall diet quality, which also found that SNAP participants’ diets do not differ greatly relative to otherwise similar nonparticipants. Along these lines, researchers in this analysis found no differences in alcohol consumption between SNAP and nonparticipating adults, even though alcoholic beverages cannot be purchased with SNAP benefits.
SNAP Benefits Do Not Cover All Household Food Needs
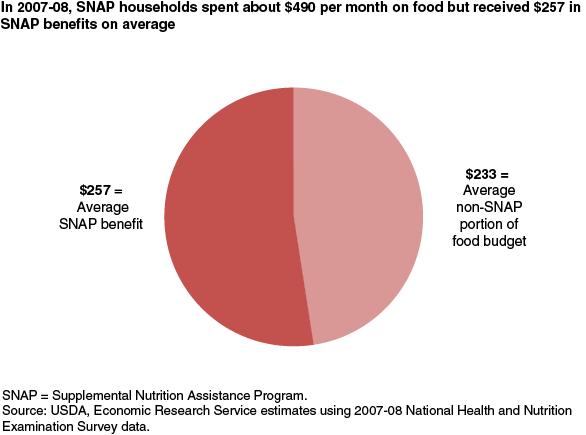
For most SNAP participant households, SNAP benefits do not cover all of their food needs. ERS researchers also examined information collected in the 2007-08 NHANES about household food spending and SNAP benefits received (this information was not collected in 2005-06) to measure the gap between benefits and food spending. On average, SNAP households received $257 from SNAP yet spent $490 on food each month. Over 85 percent of SNAP participants spent more than their monthly SNAP benefit level on food, purchasing an average of an additional $301 worth of groceries with their own money.
While SNAP participants could use their own resources to purchase SSBs, a restriction on SNAP purchases of SSBs would mean a slightly higher price of such beverages for participants in States that tax grocery store food purchases, since SNAP participants do not pay sales tax on SNAP purchases. Excluding SSBs from the allowable foods and beverages may mean SNAP participants who purchase them would have to pay the tax (State policies on how to tax mixed purchases—e.g., purchases using both SNAP and cash income—vary), effectively increasing the price of SSBs for SNAP participants and potentially lowering the quantity purchased. A previous ERS study estimated that a 20-percent tax-induced price increase on sweetened beverages would decrease total daily beverage intake a small amount—37 calories—for the average adult because SSBs make up a very small portion of household food budgets and consumers can substitute to nontaxed food or beverages that may contain added sugars and calories.
Encouraging Healthier Choices Is Another Approach
Previous research on the effect of taxing specific food items on purchases and intake has generally found mixed or small impacts on purchases and food intake because consumers substitute away from the taxed food to a nontaxed food with similar nutritional qualities. This behavior limits the impact of these types of taxes on diet quality.
As opposed to raising price through taxes, lowering the price of specific food items is another approach to encouraging healthy food choices. The SNAP Healthy Incentives Pilot (HIP), conducted in Hampden County, MA, between November 2011 and December 2012, sought to improve diet quality among SNAP participants by effectively lowering the price of fruits and vegetables through targeted incentives at the point of sale.
HIP gave a randomly selected group of SNAP participants an additional 30 cents in benefits for each dollar of SNAP benefits spent on targeted fruits and vegetables. These included fresh, canned, frozen, and dried fruits and vegetables that do not contain added sugars, fats, oils, or salt but did not include white potatoes or 100-percent fruit juice. The additional benefits, which were received on the participants' Electronic Benefit Cards similar to the rest of their SNAP benefits, could be spent on any SNAP-eligible foods or beverages. On average, HIP participants consumed 26 percent more of the targeted fruits and vegetables and had a Healthy Eating Index score that was 5 points (9 percent) higher than SNAP participants who did not receive the HIP benefits.
A similar program is the Wholesome Wave Double Value Coupon Program, which lowers the price of fruits and vegetables for SNAP recipients who spend their benefits at farmers’ markets. The program matches the amount of benefits spent at participating farmers’ markets, given available funds, with coupons that can be used to purchase additional fresh produce at the markets.
The Agricultural Act of 2014 gave USDA $100 million over 5 years to fund and evaluate projects designed to increase purchases of fruits and vegetables by SNAP participants through the Food Insecurity Nutrition Incentive grant program. USDA’s National Institute of Food and Agriculture is managing the grant program, and USDA’s Food and Nutrition Service is managing the independent evaluations.
Incentive programs must be funded at the start, whereas tax-based policies collect revenue. Further work is needed to assess whether the net benefits of an incentive-based policy outweigh the net benefits of a tax-based policy.
This article is drawn from:
- Smith, T.A., Lin, B. & Lee, J. (2010). Taxing Caloric Sweetened Beverages: Potential Effects on Beverage Consumption, Calorie Intake, and Obesity. U.S. Department of Agriculture, Economic Research Service. ERR-100.
- Gregory, C.A., Ver Ploeg, M., Andrews, M. & Coleman-Jensen, A. (2013). Supplemental Nutrition Assistance Program (SNAP) Participation Leads to Modest Changes in Diet Quality. U.S. Department of Agriculture, Economic Research Service. ERR-147.
- Jessica E. Todd and Michele Ver Ploeg. “Caloric Beverage Intake Among Adult Supplemental Nutrition Assistance Program Participants” . (2014). American Journal of Public Health: Vol. 104, No. 9: e80–e85..
- Bartlett, Susan, Jacob Klerman, Lauren Olsho, et al. Evaluation of the Healthy Incentives Pilot (HIP): Final Report. (2014). Prepared by Abt Associates for the U.S. Department of Agriculture, Food and Nutrition Service.
You may also like:
- Mancino, L. & Guthrie, J. (2014, November 3). SNAP Households Must Balance Multiple Priorities To Achieve a Healthful Diet. Amber Waves, U.S. Department of Agriculture, Economic Research Service.
- Kuchler, F., Tegene, A., Harris, M., Leibtag, E., Binkley, J., Canning, P., Dooley, R., Eales, J., Martinez, S., Tsigas, M., Lee, C., O'Roark, B., Aldrich, L., Blisard, N., Allen, E. & Schluter, G. (2004). Current Issues in Economics of Food Markets. U.S. Department of Agriculture, Economic Research Service. AIB-747.


