National Surveys Reveal Modest Improvement in the Types of Foods Available in Americans’ Homes
- by Tobenna D. Anekwe
- 4/6/2015
Since 2007, ERS has partnered with the Centers for Disease Control and Prevention’s National Center for Health Statistics (CDC/NCHS) to field the Flexible Consumer Behavior Survey (FCBS). The FCBS is designed to collect data on Americans’ dietary habits, behaviors, and knowledge and is part of the larger National Health and Nutrition Examination Survey (NHANES), which NCHS has conducted annually since 1999. NHANES data are released in 2-year cycles, with data currently available from 1999-2010 and FCBS data from 2007-2010.
Both NHANES and its subcomponent FCBS use a nationally representative sample of respondents, so that estimates describe the Nation as a whole. A number of FCBS questions remain the same over time, which allows researchers to track trends over several years. Although the FCBS officially started in 2007, the 2005-06 NHANES contained some questions that later became part of the FCBS in 2007, meaning that some FCBS questions can be analyzed beginning in 2005.
The FCBS asks respondents a series of questions about their diets, including, “In general, how healthy is your overall diet?” This question measures self-rated diet quality and can be linked to other information in NHANES, such as respondents’ dietary intake and other health and behavioral indicators. In a 2011 study, ERS researchers found that people who rate their diets as excellent have more home-prepared dinners per week than people who rate their diets as poor.
Responses to the question, “In general, how healthy is your overall diet?” from 2005 to 2010 indicate that Americans are reporting somewhat healthier diets. The share of people responding with “good” grew from 40 to 43 percent, and the share responding with “poor” decreased from 6.2 to 4.3 percent.
Americans Making Small, But Positive Changes
The FCBS asks respondents how often they have different kinds of foods available at home in their refrigerators, freezers, or pantry shelves. The foods in question include fruit, vegetables, and low-fat milk, and less healthful foods such as chips and soft drinks. Respondents are asked to reply with one of the following: always, most of the time, sometimes, rarely, or never. These answers describe the food environment at home, which is important because healthful choices are easier in environments where healthful foods are available. (By definition, the data do not describe the food choices people made when eating out.)
Responses to these questions can also be linked with other behavioral information in NHANES. For example, a 2014 ERS study found that people who often had dark green vegetables available at home were more likely to use nutrition information when eating out than those who less often had such vegetables available at home.
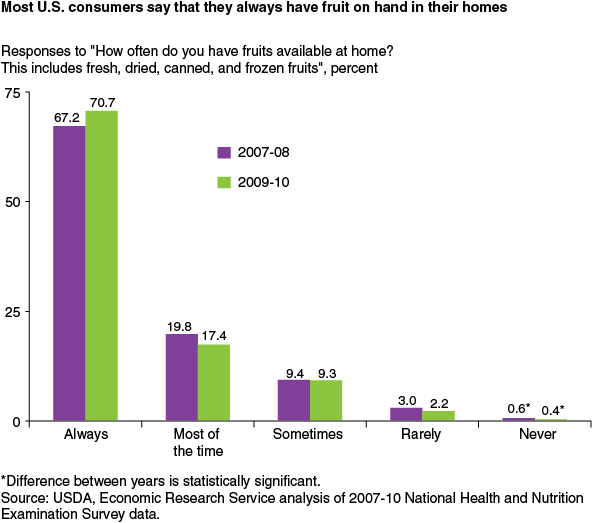
FCBS results indicate that Americans made small but nutritionally positive changes when it came to keeping fruit, low-fat milk, and sugar-sweetened beverages at home; that is, people were less often “never” keeping fruit at home, more often “always” keeping low-fat milk at home, and keeping sugar-sweetened beverages at home less frequently. Although the changes are relatively small, they occurred within a short time period. The share of people saying that they “never” had fruit available in their homes decreased from 0.6 percent to 0.4 percent from 2007-08 to 2009-10, while a large number of people (an average of 69.0 percent) said that they “always” had fruit available at home.
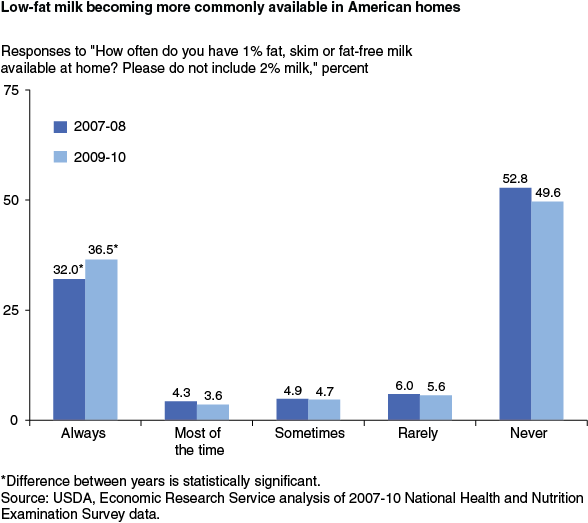
The share of respondents who said that they “always” kept low-fat milk at home increased from 32 percent in 2007-08 to 36.5 percent in 2009-10, suggesting that some Americans may have received and acted on nutritional advice to seek out lower fat versions of foods. The most frequent answers were the extremes—“never” (51.2 percent of respondents on average) followed by “always.”
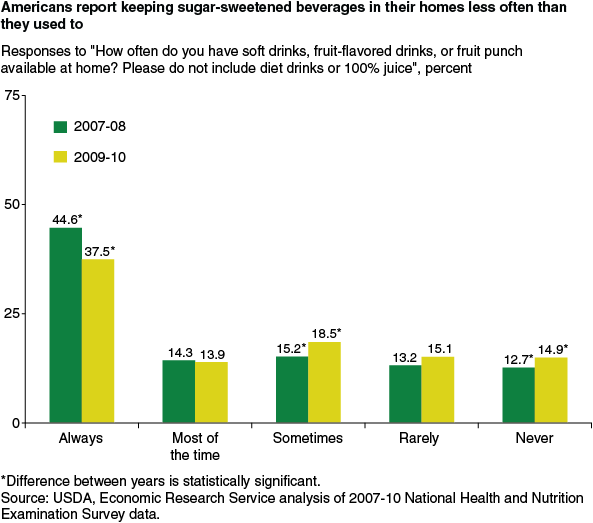
Another positive nutritional change in foods available at home occurred with sugar-sweetened beverages. Between 2007-08 and 2009-10, the share of people saying that they “always” kept sugar-sweetened beverages at home fell by 7.1 percentage points and the share of “never” rose by 2.2 percentage points—positive trends for Americans, who typically over-consume added sugars in foods and beverages. During 2007-10, the most common response was “always” (41.1 percent of respondents on average) while the remaining responses were evenly split among the remaining categories.
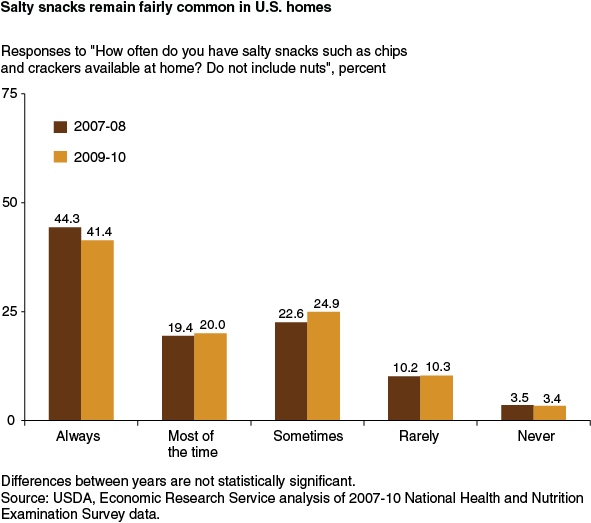
On a less positive nutrition note, Americans have not abandoned salty snacks. There were no statistically significant changes in people’s answers regarding salty snacks such as potato chips and crackers during 2007-10. “Always” was the most frequent response throughout the period, while “never” was the least frequent.
Taken together, answers to the FCBS questions show that Americans are making small but nutritionally positive changes in the types of foods they have available at home—an important step towards healthier diets.
You may also like:
- Gregory, C.A., Rahkovsky, I. & Anekwe, T.D. (2014). Consumers' Use of Nutrition Information When Eating Out. U.S. Department of Agriculture, Economic Research Service. EIB-127.
- Gregory, C.A., Smith, T.A. & Wendt , M. (2011). How Americans Rate Their Diet Quality: An Increasingly Realistic Perspective. U.S. Department of Agriculture, Economic Research Service. EIB-83.


