Milk Production Continues Shifting to Large-Scale Farms
- by James M. MacDonald and Doris Newton
- 12/1/2014
Production has shifted to larger farms in most agricultural commodity sectors over the last two decades. This consolidation has contributed to productivity growth in agriculture, leading to lower commodity and food prices and reducing total resource use in food and fiber production. As consolidation reduces the farm population, it also makes starting small and mid-sized farming operations more difficult. This is especially true for dairy farms, where a major transformation of the sector has reduced the number of dairy farms by nearly 60 percent over the past 20 years, even as total milk production increased by one-third. Recent results from the Census of Agriculture and the Agricultural Resource Management Survey (ARMS) detail how and why the structure of dairy production has changed.
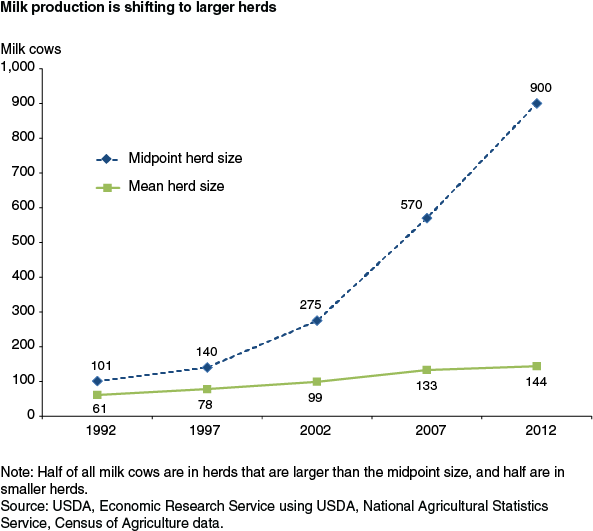
The mean herd size on dairy operations rose from 61 cows in 1992 to 144 in 2012, but that shift understates the nature of the change in dairy production; most cows are now on farms that are much larger than the mean. The midpoint farm size is used to track cows; the midpoint shows the herd size at which half of all cows are in larger herds and half are in smaller herds. In 1992, the midpoint of 101 cows was not much larger than the mean, reflecting the fact that most cows were on small and mid-size dairy farms. However, the midpoint rose sharply over the next two decades, to 900 cows by 2012, over 6 times larger than the mean herd size.
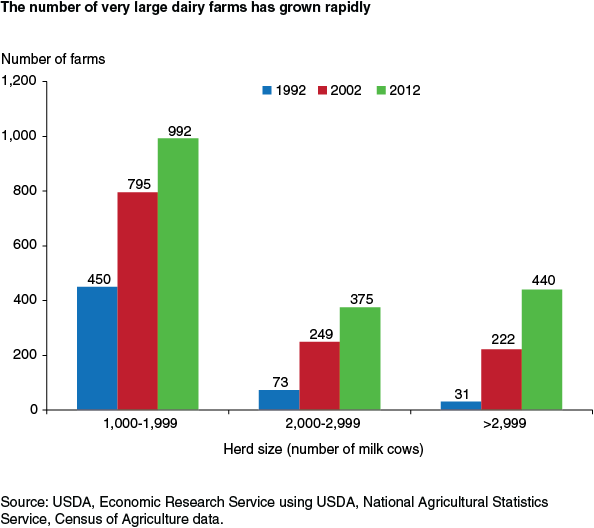
The sharp upward trend in the midpoint reflects changes at the extremes of farm sizes. In 2012, there were still nearly 50,000 dairy farms with fewer than 100 cows, but that represented a large decline from 20 years earlier, when there were almost 135,000. Over the same period, the number of dairy farms with at least 1,000 cows more than tripled to 1,807 farms in 2012. Movements in farm numbers were mirrored by movements in cow inventories. Farms with fewer than 100 cows accounted for 49 percent of the country’s 9.7 million milk cows in 1992, but just 17 percent of the 9.2 million milk cows in 2012. Meanwhile, farms with at least 1,000 cows accounted for 49 percent of all cows in 2012, up from 10 percent in 1992.
| Year | Farms with < 100 cows: number of farms | Farms with < 100 cows: share of cows (percent) | Farms with > 999 cows: number of farms | Farms with > 999 cows: share of cows (percent) |
|---|---|---|---|---|
| 1992 | 134,931 | 49 | 564 | 10 |
| 1997 | 97,134 | 39 | 878 | 18 |
| 2002 | 73,725 | 29 | 1,256 | 29 |
| 2007 | 53,324 | 21 | 1,582 | 40 |
| 2012 | 49,683 | 17 | 1,807 | 49 |
| Source: Census of Agriculture. | ||||
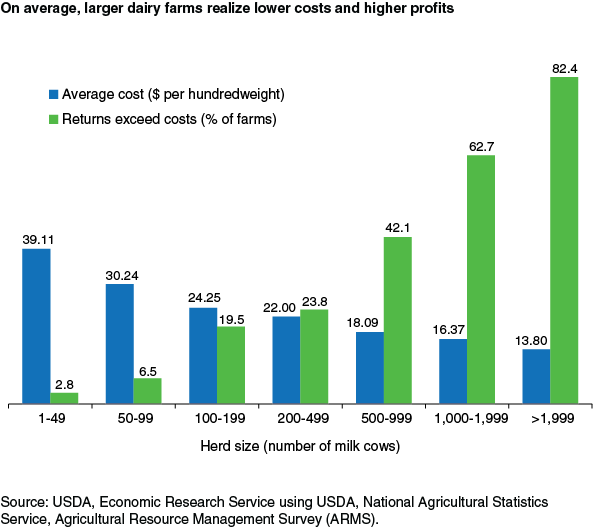
The shift to larger dairy farms is driven largely by the economics of dairy farming. Average costs of production, per hundredweight of milk produced, are lower in larger herds, and the differences are substantial. These costs include the estimated costs of the farm family’s labor as well as capital costs, in addition to the cash expenses that are included under operating costs.
While some small farms earn profits and some large farms incur losses, financial performance is linked to herd size. Most of the largest dairy farms generate gross returns that exceed full costs, while most small and mid-size dairy farms do not earn enough to cover full costs. Full costs include annualized costs of capital as well as the cost of unpaid family labor (measured as what they could earn off the farm), in addition to cash operating expenses. The cost differences reflect differences in input use; on average, larger farms use less labor, capital, and feed per hundredweight of milk produced. These financial returns provide an impetus for structural change.
In 2012, dairy farms with at least 2,000 cows incurred costs that were 16 percent lower, on average, than farms with 1,000-1,999 cows, a difference that could provide a spur to further structural change to even larger farms. In 1992, there were just 31 farms with 3,000 or more milk cows; by 2012, there were 440, and many of them had 5,000 or more cows.
Some smaller dairy farms have found profitable niches through value-added activities like artisanal cheese production, agritourism, or the breeding and sale of high-quality calves. Some are also adapting innovations like robotic milkers that can reduce the labor required for milking by operators on small- and mid-size farms. Finally, some small farms can continue to operate for long periods of time without covering full costs, as long as their revenues are enough to cover cash expenses and provide an acceptable return to the farm family’s labor. However, if they don’t provide a return on capital, few people would be willing to reinvest in them or start new small dairies. The cost advantages of size remain quite substantial on average, and production is likely to continue to shift to very large dairy farms as older operators of small- and mid-size farms retire.
This article is drawn from:
- Milk Cost of Production Estimates. (n.d.). U.S. Department of Agriculture, Economic Research Service.
- MacDonald, J.M., O'Donoghue, E., McBride, W.D., Nehring, R., Sandretto, C. & Mosheim, R. (2007). Profits, Costs, and the Changing Structure of Dairy Farming. U.S. Department of Agriculture, Economic Research Service. ERR-47.
- Census of Agriculture. (2012). National Agricultural Statistics Service, USDA.


