Growth Patterns in the U.S. Organic Industry
- by Catherine Greene
- 10/24/2013
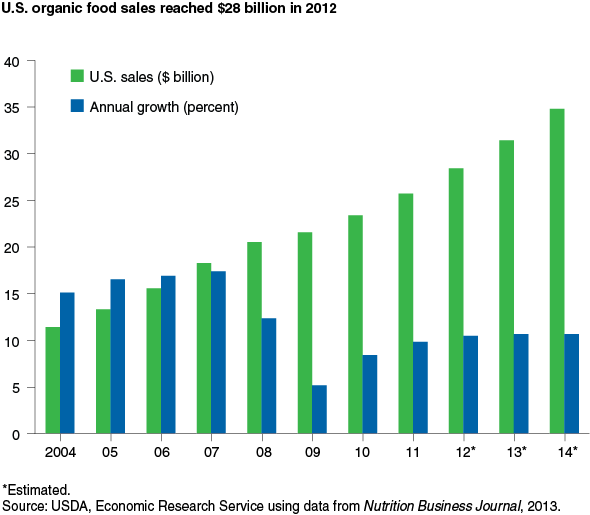
U.S. consumer demand for organically produced goods has grown continuously since USDA established national standards for organic production and processing in 2002. And, while Americans economized on their food purchases during the 2007-09 recession, including purchases of organic products, growth in demand for organic products rebounded quickly following the recession. Industry analysts estimate that U.S. organic food sales were $28 billion in 2012 (over 4 percent of total at-home food sales), up 11 percent from 2011. USDA has begun organic regulation of nonfood agricultural products—for example, laundry detergent with organic coconut oil, aloe vera, and other ingredients—which accounted for another $2.2 billion in organic sales in 2011, according to the Organic Trade Association.
Although USDA does not maintain official statistics on U.S. organic food sales, industry data suggest that the market share of organic sales held by various food categories has been remarkably stable over the last decade. Produce (fruits and vegetables) and dairy are still the top two organic food categories, accounting for 43 and 15 percent of total organic sales in 2012; their standing has been relatively unchanged in recent years. Packaged foods, beverages (including soymilk), and breads/grains have 9-11 percent market shares, down slightly from a decade ago. The meat, fish, and poultry category, which is dominated by poultry sales, gained the most over the last decade but still represents just 3 percent of total organic sales.
U.S. Certified Organic Acreage Rebounded in 2011
USDA set a uniform organic standard in 2000 to provide consumer assurance, and farmers with organic sales over $5,000 in a given year must obtain independent certification. ERS has tracked the amount of certified organic acreage and livestock in the United States since 1997, identifying State-level adoption patterns for over 40 commodities based on information from State and private organic certifiers. USDA currently provides accreditation to over 50 organic certifiers in the U.S.
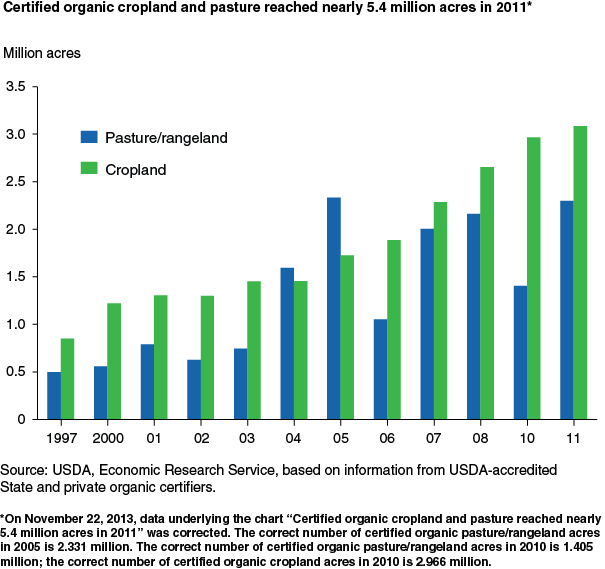
According to new ERS estimates, the U.S. had 3.1 million acres of certified organic cropland in 2011 and 2.3 million acres of certified organic pasture and rangeland, continuing the long-term growth trend in this sector. Certified cropland and pasture dipped between 2008 and 2010 as sluggish growth in consumer demand during the recession dampened the short-term outlook for organic producers. However, the growth in certified acreage of both cropland and pastureland has more than recovered those losses and has reestablished its upward trajectory.
Fruit and vegetable growers and producers in other high-value, market-driven sectors have adopted organic management systems much more widely than producers of other crops, although they typically do not require large amounts of land to produce such crops. As a result, the distribution of certified cropland among crop specialties is a poor indicator of the relative value of the organic food produced by each specialty. For example, fruits and vegetables accounted for an estimated 43 percent of U.S. organic food sales in 2011 but only 16 percent of certified organic cropland.
Overall, certified organic cropland made up roughly 0.7 percent of U.S. cropland in 2011. Only a small percentage of the top U.S. field crops—corn (0.3 percent), soybeans (0.2 percent), and wheat (0.6 percent)—were grown under certified organic farming systems. On the other hand, organic vegetables (6 percent of U.S. vegetable acreage) and organic fruits and nuts (4 percent) were more common. Markets for organic vegetables, fruits, and herbs have been developing for decades in the United States, and fresh produce is still the top-selling organic category in retail sales. As a result, the distribution of certified organic cropland used to raise specific commodities differs substantially from the share of total cropland for these commodities in the conventional sector.
| Crop | U.S. cropland - Acres (thousands) | U.S. cropland - Share of total (%) | Certified organic - Acres (thousands) | Certified organic - Share of total (%) |
|---|---|---|---|---|
| Corn | 91,900 | 30 | 234.5 | 12 |
| Soybeans | 78,000 | 26 | 132.4 | 7 |
| Hay | 61,600 | 20 | 786.0 | 39 |
| Wheat | 54,400 | 18 | 344.6 | 17 |
| Fruit and nuts | 4,000 | 1 | 154.8 | 8 |
| Vegetables | 2,800 | 1 | 160.7 | 8 |
| Rice | 2,700 | 1 | 48.5 | 2 |
| Barley | 2,600 | 1 | 63.9 | 3 |
| Oats | 2,500 | 1 | 62.0 | 3 |
| Dry beans, peas & lentils | 2,100 | 1 | 46.5 | 2 |
| Total, selected crops | 302,500 | 100 | 2,034 | 100 |
| Sources: USDA, Economic Research Service, based on information from USDA-accredited State and private organic certifiers and USDA, National Agricultural Statistics Service, "Agricultural Statistics 2012." | ||||
Organic Trade
Growth in organic agricultural production is taking place in both developed and developing countries worldwide, and the competition for major consumer markets in developed countries is increasing. U.S. producers have been challenged to keep pace with growing consumer demand for organic products for over a decade, and new statistics from the U.S. Department of Commerce show that organic imports play a key role in meeting U.S. demand. Many of the top imported organic products are tropical and subtropical crops, including bananas and coffee, which the U.S. does not produce in large quantities. However, among all organic product imports, soybeans showed the biggest jump in value from 2011 to 2012, more than doubling to $90.2 million, and imports of organic rice, wheat, and other U.S. staple crops also grew.
| Product | 2011 | 2012 | 2013 (Jan-May) |
|---|---|---|---|
| Tropical/subtropical crops | |||
| Bananas | - | - | 214.5 |
| Coffee | 525.8 | 282.5 | 138.9 |
| Olive oil | - | - | 77.9 |
| Mangoes | - | - | 68.7 |
| Tea | 37.2 | 34.5 | 21.9 |
| Avocado | 17.2 | 13.1 | 8.0 |
| Ginger | - | - | 3.5 |
| Grains and oilseeds | |||
| Soybeans | 41.8 | 90.2 | 42.6 |
| Rice | 24.4 | 25.4 | 15.8 |
| Durum wheat | 0.7 | 9.5 | 8.6 |
| Flaxseed | - | - | 1.3 |
| Fruits and vegetables | |||
| Bell peppers | 8.0 | 9.3 | 8.9 |
| Apples | 5.7 | 12.1 | 8.2 |
| Almonds | - | - | 8.1 |
| Pears | 3.7 | 4.0 | 5.9 |
| Blueberries | 2.9 | 3.5 | 3.6 |
| Garlic | - | - | 1.0 |
| Quinces | - | 0.2 | - |
| Other products | |||
| Wine | - | - | 158.2 |
| Honey | - | 11.2 | 7.3 |
| Total, selected products | 667.4 | 495.9 | 802.7 |
| - = Data unavailable. Source: USDA, Economic Research Service using data from U.S. Department of Commerce, U.S. Census Bureau, Foreign Trade Statistics. |
|||
The organic products exported by the U.S. and tracked by the U.S. Department of Commerce are mostly fresh fruits and vegetables, which have the highest organic adoption levels in the United States. Two-thirds of the organic product exports that Commerce is tracking showed some increase in value between 2011 and 2012, with organic apple exports from the U.S. more than doubling in value.
| Organic product | 2011 | 2012 | 2013 (Jan-June) |
|---|---|---|---|
| Fruit and vegetables (fresh/chilled) | |||
| Apples, fresh | 46.2 | 99.8 | 88.3 |
| Lettuce | 87.1 | 83.2 | 45.4 |
| Spinach | 20.9 | 26.0 | 16.3 |
| Carrots | 22.7 | 22.6 | 13.8 |
| Strawberries | 15.8 | 18.4 | 13.5 |
| Citrus | 20.5 | 21.3 | 13.4 |
| Pears | 8.9 | 20.6 | 11.4 |
| Blueberries | 16.4 | 13.7 | 9.5 |
| Cauliflower | 18.0 | 24.0 | 8.8 |
| Broccoli | 9.9 | 13.6 | 7.2 |
| Cherries | 30.6 | 6.4 | 5.7 |
| Tomato | 5.0 | 6.6 | 4.4 |
| Celery | 7.1 | 6.6 | 3.2 |
| Peppers | 2.0 | 2.5 | 2.2 |
| Cabbage | - | 1.1 | 1.8 |
| Grapes | 60.0 | 39.7 | 1.5 |
| Onion sets | 2.2 | 3.5 | 1.4 |
| Potatoes | 1.6 | 1.8 | 0.9 |
| Cucumbers | - | 0.012 | - |
| Processed products: | |||
| Coffee, roasted | 15.2 | 24.5 | 10.0 |
| Tomato sauce | 21.9 | 12.0 | 7.6 |
| Total, selected products | 412.0 | 447.9 | 266.1 |
| - = Data unavailable. Source: USDA, Economic Research Service using data from U.S. Department of Commerce, U.S. Census Bureau, Foreign Trade Statistics. |
|||
This article is drawn from:
- Organic Production. (n.d.). U.S. Department of Agriculture, Economic Research Service.
You may also like:
- Organic Agriculture. (n.d.). U.S. Department of Agriculture, Economic Research Service.


